Home > Comparison > Real Estate > AMT vs CCI
The strategic rivalry between American Tower Corporation and Crown Castle Inc. shapes the evolution of the real estate investment trust (REIT) specialty sector. American Tower operates a vast global portfolio of multitenant communications sites, while Crown Castle focuses on an extensive U.S. footprint of cell towers and fiber infrastructure. This analysis pits American Tower’s global scale against Crown Castle’s domestic network, assessing which model delivers superior risk-adjusted returns for a diversified portfolio.
Table of contents
Companies Overview
American Tower and Crown Castle anchor the U.S. communications infrastructure market with expansive networks and strategic asset bases.
American Tower Corporation: Global REIT Powerhouse
American Tower stands as a leading independent owner of multitenant communications real estate. Its core revenue derives from leasing approximately 219,000 communication sites worldwide. In 2026, the company sharpens its strategic focus on expanding global footprint while optimizing site utilization to enhance recurring revenue streams.
Crown Castle Inc.: U.S. Fiber and Tower Specialist
Crown Castle operates over 40,000 cell towers and 80,000 route miles of fiber, underpinning U.S. wireless and data connectivity. It generates revenue primarily through leasing these communications assets across major U.S. markets. The company’s 2026 strategy centers on strengthening its fiber solutions and small cell infrastructure to meet growing urban data demands.
Strategic Collision: Similarities & Divergences
Both firms share a specialty REIT model focused on communications infrastructure but diverge in scale and asset mix—American Tower goes global with towers, Crown Castle emphasizes U.S. fiber and small cells. Their competition unfolds in wireless coverage and high-speed data delivery. Investors face distinct profiles: American Tower offers global scale with international exposure, while Crown Castle delivers concentrated U.S. fiber growth with urban market penetration.
Income Statement Comparison
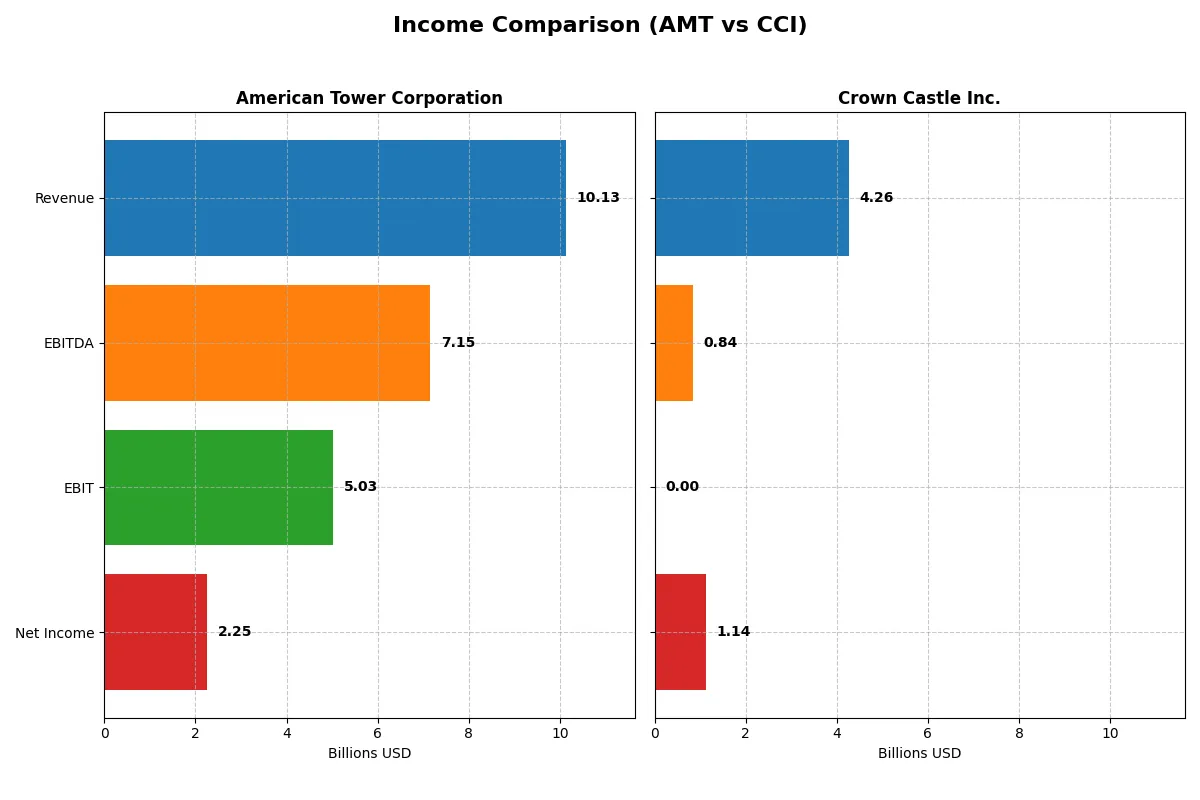
This data dissects the core profitability and scalability of both corporate engines to reveal who dominates the bottom line:
| Metric | American Tower Corporation (AMT) | Crown Castle Inc. (CCI) |
|---|---|---|
| Revenue | 10.13B | 6.57B |
| Cost of Revenue | 2.57B | 1.85B |
| Operating Expenses | 3.04B | 7.66B |
| Gross Profit | 7.55B | 4.72B |
| EBITDA | 7.15B | -1.24B |
| EBIT | 5.03B | -2.98B |
| Interest Expense | 1.40B | 900M |
| Net Income | 2.26B | -3.90B |
| EPS | 4.83 | -8.98 |
| Fiscal Year | 2024 | 2024 |
Income Statement Analysis: The Bottom-Line Duel
This income statement comparison reveals which company runs a more efficient and profitable business engine over recent years.
American Tower Corporation Analysis
American Tower’s revenue rose steadily from 8B in 2020 to over 10B in 2024, with net income climbing from 1.69B to 2.25B. Its gross margin holds strong at 74.6%, and net margin improved to 22.3%. In 2024, EBIT surged 72%, showing robust operational momentum despite a slight revenue growth slowdown.
Crown Castle Inc. Analysis
Crown Castle’s revenue peaked at 7B in 2023 but dropped sharply to 4.26B in 2025, while net income swung from a loss of 3.9B in 2024 to a positive 1.14B in 2025. Gross margin data is unavailable for 2025, but net margin improved to 26.6%. The turnaround in profitability in 2025 signals improving efficiency after a difficult prior year.
Margin Dominance vs. Revenue Resilience
American Tower demonstrates consistent revenue and margin growth, with healthy profitability and strong EBIT expansion. Crown Castle shows volatile revenue but a striking net income recovery in 2025, delivering a higher net margin. For investors, American Tower offers steady operational strength, while Crown Castle’s profile suits those seeking a turnaround story with improving margins.
Financial Ratios Comparison
These vital ratios act as a diagnostic tool to expose the underlying fiscal health, valuation premiums, and capital efficiency of the companies analyzed:
| Ratios | American Tower Corporation (AMT) | Crown Castle Inc. (CCI) |
|---|---|---|
| ROE | 66.67% | 29.35% |
| ROIC | 6.97% | -9.34% |
| P/E | 37.98 | -10.09 |
| P/B | 25.33 | -296.16 |
| Current Ratio | 0.45 | 0.50 |
| Quick Ratio | 0.45 | 0.50 |
| D/E (Debt to Equity) | 12.99 | -222.65 |
| Debt-to-Assets | 71.96% | 90.46% |
| Interest Coverage | 3.22 | -3.26 |
| Asset Turnover | 0.17 | 0.20 |
| Fixed Asset Turnover | 0.37 | 0.31 |
| Payout Ratio | 136.36% | -69.92% |
| Dividend Yield | 3.59% | 6.93% |
| Fiscal Year | 2024 | 2024 |
Efficiency & Valuation Duel: The Vital Signs
Financial ratios serve as a company’s DNA, unveiling hidden operational efficiency and potential risks critical to investment decisions.
American Tower Corporation
American Tower posts a strong 66.7% ROE and a solid 22.3% net margin, signaling robust profitability. However, its valuation appears stretched with a high P/E of 38 and a P/B of 25.3. The company supports shareholders via a 3.6% dividend yield, reflecting steady income distribution despite some leverage and liquidity concerns.
Crown Castle Inc.
Crown Castle shows an anomalous 2934.6% ROE, likely distorted by accounting factors, but suffers a negative net margin of -59.4%. Its P/E and P/B ratios are negative, complicating valuation. Debt metrics are favorable, yet operating returns are weak. The firm offers a neutral 6.9% dividend yield, emphasizing shareholder income over reinvestment.
Premium Valuation vs. Operational Ambiguity
American Tower delivers consistent profitability at a premium valuation, balancing risk with reliable dividends. Crown Castle’s metrics present operational ambiguity and accounting distortions despite attractive dividend yield. Investors seeking stable income may favor American Tower, while those tolerant of volatility might consider Crown Castle’s unique profile.
Which one offers the Superior Shareholder Reward?
I see American Tower Corporation (AMT) delivers a balanced distribution with a 3.6% dividend yield and a payout ratio above 130%, signaling aggressive returns but raising sustainability concerns. Crown Castle Inc. (CCI) offers a higher 6.9% yield, yet its payout ratio is negative due to recent losses, questioning dividend reliability. AMT maintains healthier free cash flow coverage (~70%) and robust buybacks, while CCI’s buyback is less consistent amid financial strain. I conclude AMT’s disciplined capital allocation and sustainable dividends provide superior long-term shareholder rewards in 2026.
Comparative Score Analysis: The Strategic Profile
The radar chart reveals the fundamental DNA and trade-offs of American Tower Corporation and Crown Castle Inc.:
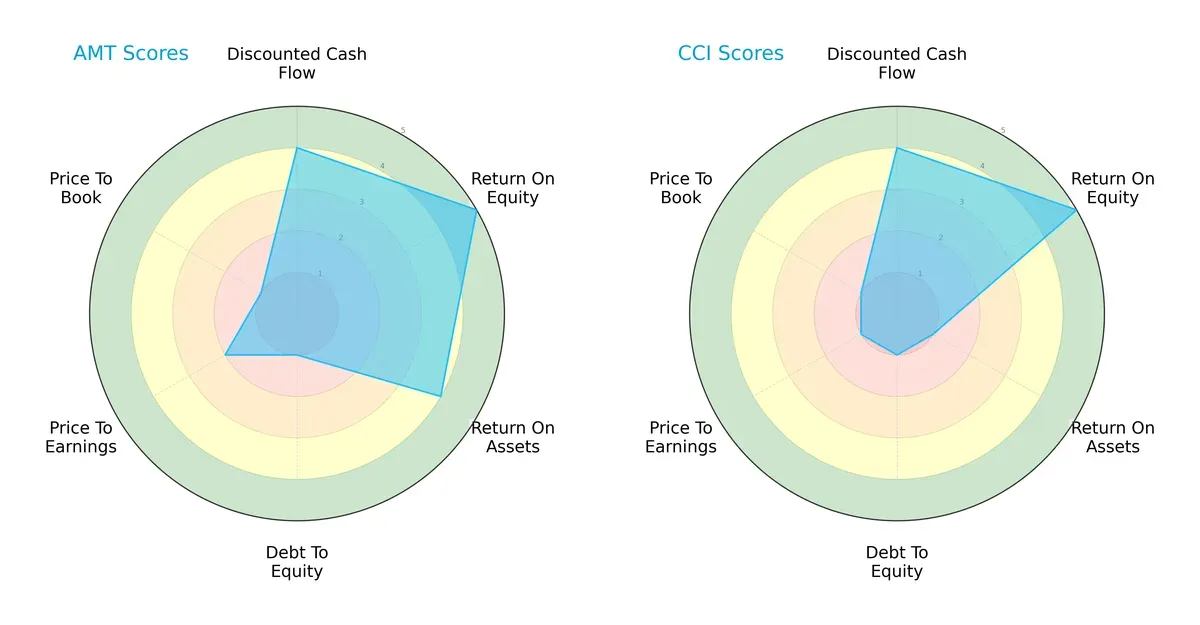
American Tower (AMT) shows a balanced strength in DCF (4), ROE (5), and ROA (4), signaling efficient capital allocation and operational effectiveness. Crown Castle (CCI) matches AMT in DCF and ROE but lags in ROA (1), indicating weaker asset utilization. Both companies share poor debt management (score 1) and undervaluation signals (P/E and P/B scores low). Overall, AMT’s profile is more balanced, while CCI relies heavily on equity efficiency but struggles with asset returns and valuation metrics.
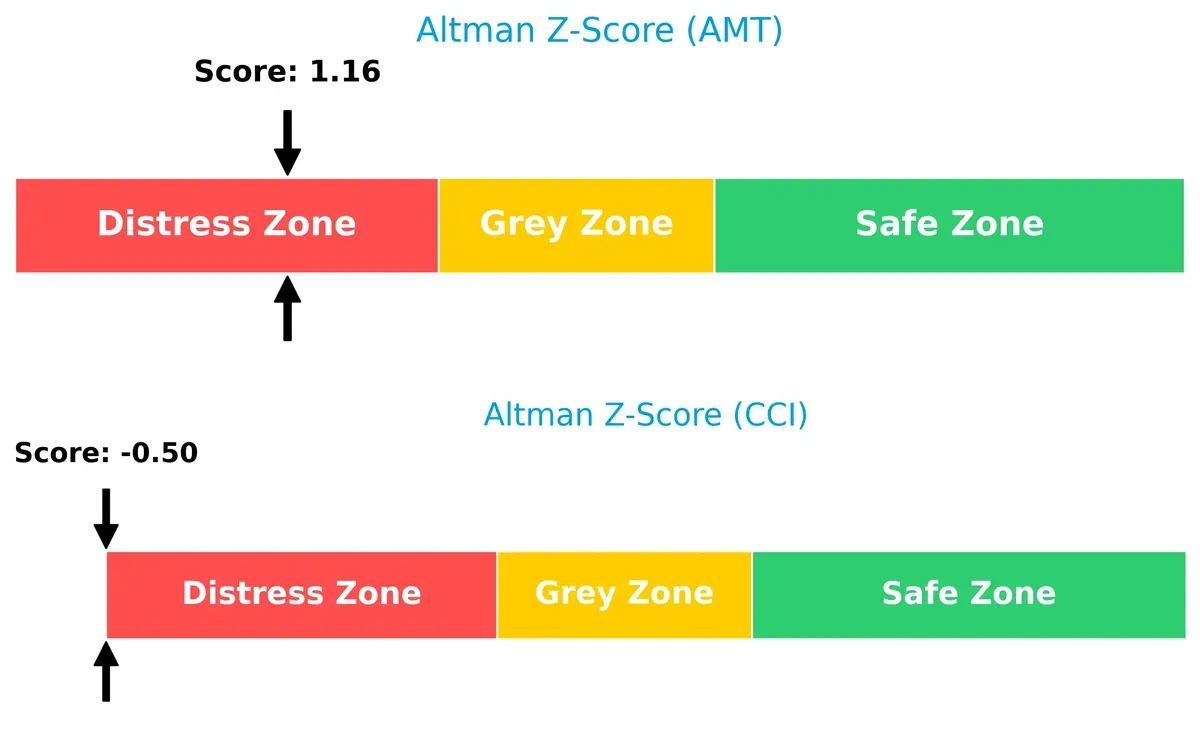
Bankruptcy Risk: Solvency Showdown
AMT’s Altman Z-Score of 1.16 versus CCI’s -0.50 places both in distress zones, but AMT holds a marginally better solvency position. This gap suggests AMT has a slightly improved chance to withstand financial stress in this cycle:
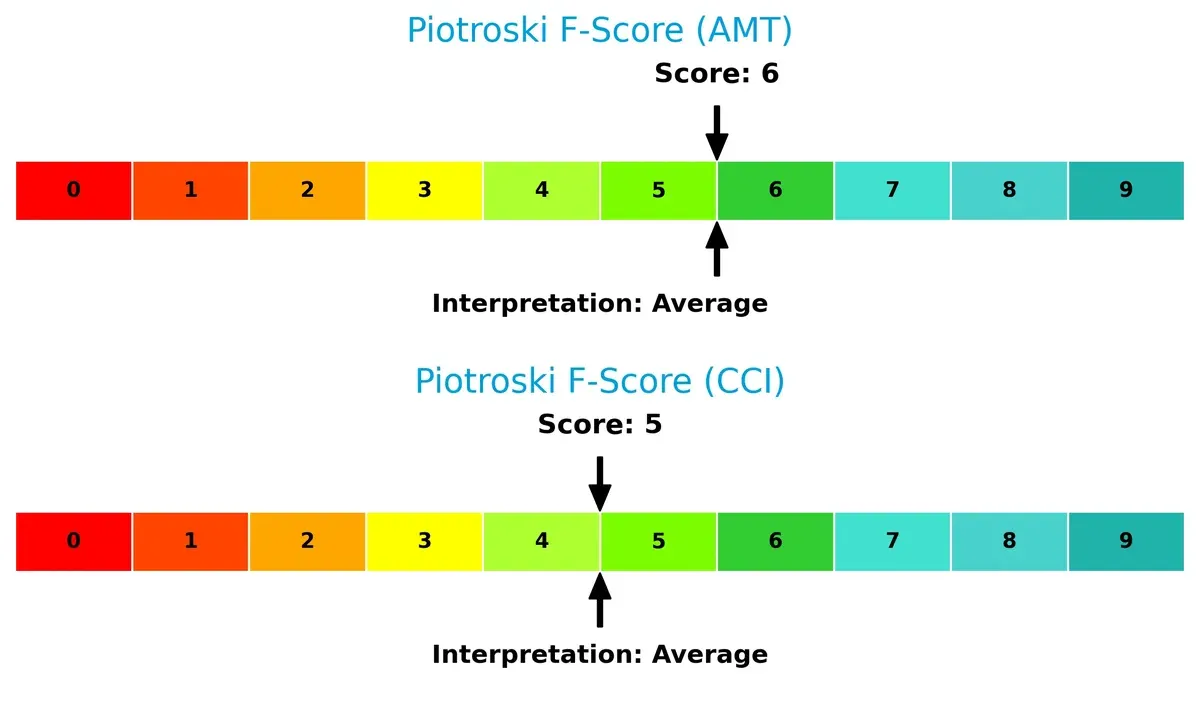
Financial Health: Quality of Operations
AMT’s Piotroski F-Score of 6 outperforms CCI’s 5, reflecting stronger operational quality and internal financial controls. Neither is in peak health, but AMT shows fewer red flags, indicating more reliable profitability and liquidity metrics:
How are the two companies positioned?
This section dissects the operational DNA of American Tower and Crown Castle by comparing their revenue distribution and internal dynamics. The goal is to confront their economic moats to identify which model delivers the most resilient, sustainable competitive advantage today.
Revenue Segmentation: The Strategic Mix
This visual comparison dissects how American Tower Corporation and Crown Castle Inc. diversify income streams and where their primary sector bets lie:
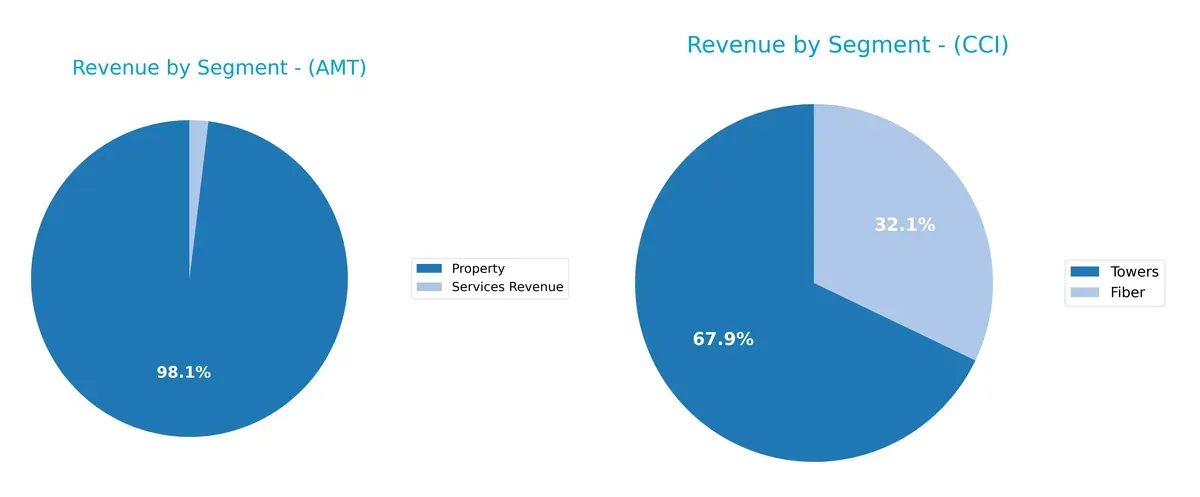
American Tower’s revenue pivots heavily on Property, generating $9.9B in 2024, dwarfing its $194M Services segment. Crown Castle, however, balances $4.5B from Towers and $2.1B from Fiber, showcasing a more diversified mix. AMT’s focus anchors on real estate dominance, risking concentration. CCI leverages infrastructure plus fiber, enhancing ecosystem lock-in and reducing dependency on a single segment. This strategic divergence highlights contrasting risk profiles and growth levers.
Strengths and Weaknesses Comparison
This table compares the Strengths and Weaknesses of American Tower Corporation (AMT) and Crown Castle Inc. (CCI):
AMT Strengths
- Strong net margin at 22.27%
- High ROE of 66.67%
- Favorable WACC at 6.55%
- Diverse global property revenue including US and Latin America
- Stable dividend yield of 3.59%
CCI Strengths
- Exceptionally high ROE at 2934.59%
- Favorable PE and PB ratios despite negative net margin
- Significant fiber and tower revenues
- Higher dividend yield neutrality at 6.93%
AMT Weaknesses
- Low liquidity ratios (current and quick at 0.45)
- High debt-to-assets at 71.96%
- Unfavorable asset turnover metrics
- Unfavorable PE and PB multiples indicating overvaluation
- High debt level (D/E 13.0)
CCI Weaknesses
- Negative net margin at -59.42%
- Negative ROIC at -9.34%
- Unavailable WACC data
- Weak interest coverage near zero
- High debt-to-assets at 90.46%
- Negative D/E ratio likely from accounting anomalies
Both companies show strengths in profitability metrics like ROE, but suffer from high leverage and liquidity concerns. AMT’s diversified global property base contrasts with CCI’s focus on fiber and towers. Each faces distinct financial risks impacting their capital and operational strategies.
The Moat Duel: Analyzing Competitive Defensibility
A structural moat is the only reliable shield protecting long-term profits from relentless competitive erosion. Let’s dissect the moats of two industry leaders:
American Tower Corporation: Global Network Effects Powerhouse
American Tower leverages network effects through its 219K communication sites worldwide. This scale drives high ROIC and margin stability, while expanding data centers and international reach deepen its moat in 2026.
Crown Castle Inc.: U.S. Fiber and Small Cell Cost Advantage
Crown Castle’s moat rests on its dense U.S. fiber network and small cell infrastructure. Unlike AMT’s global scale, CCI’s cost advantage fuels solid net margin growth, but shrinking revenue signals risks to its competitive grip.
Scale and Network Effects vs. Infrastructure Density: The Moat Face-Off
American Tower’s expanding global footprint and improving ROIC suggest a wider, more durable moat than Crown Castle’s concentrated U.S. assets. I see AMT as better equipped to defend and grow market share long term.
Which stock offers better returns?
Over the past year, both American Tower Corporation and Crown Castle Inc. experienced declining stock prices, with notable highs and lows shaping their bearish trends and decelerating momentum.
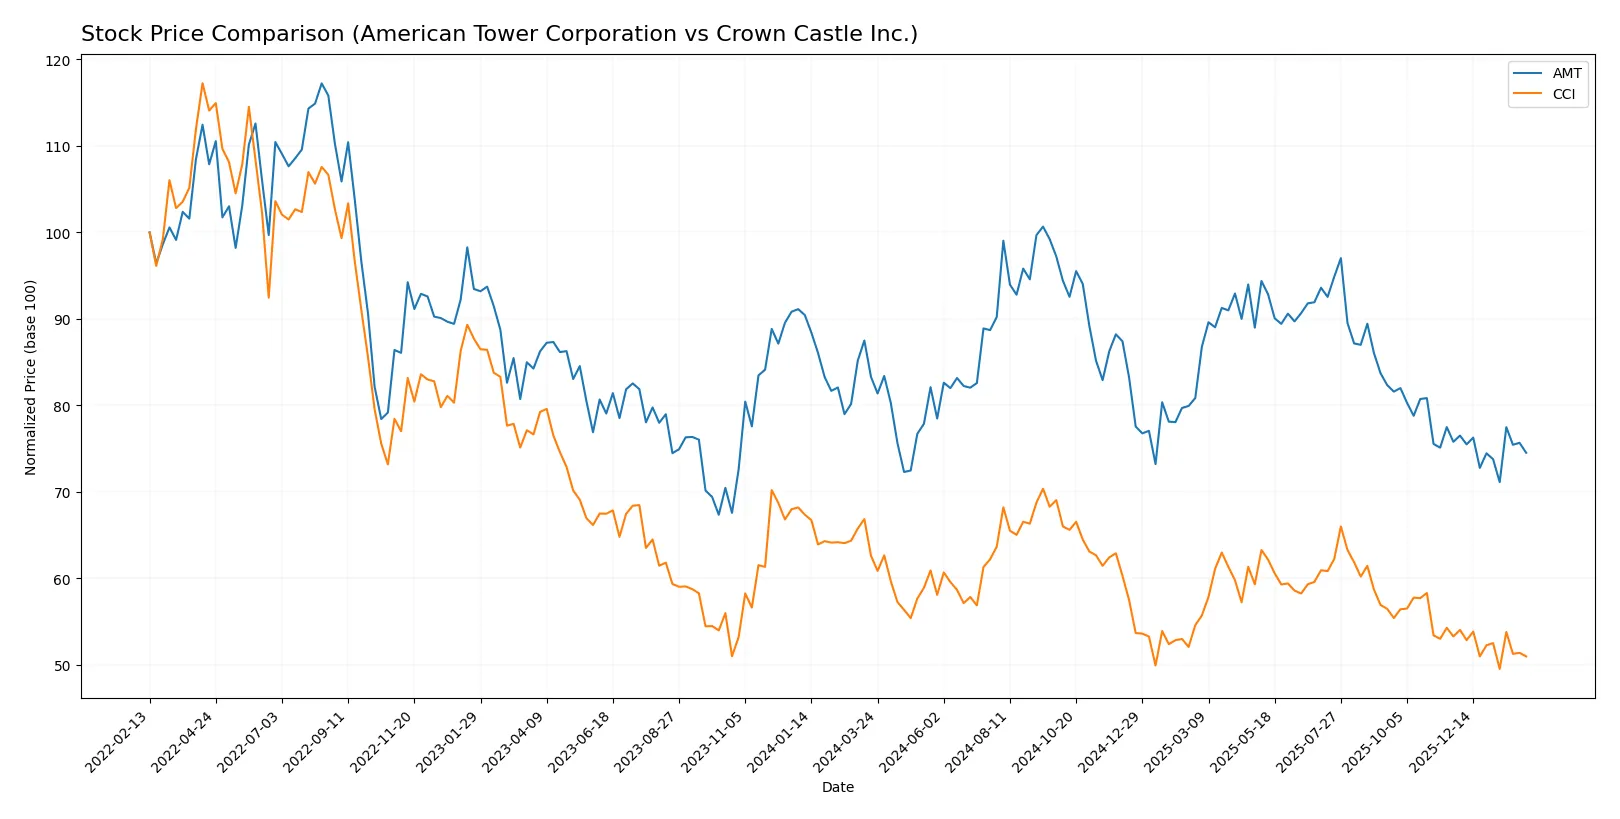
Trend Comparison
American Tower Corporation’s stock fell 10.54% over the past year, showing a bearish trend with deceleration. Its volatility is high, with a standard deviation of 17.85, ranging between 168.51 and 238.5.
Crown Castle Inc. declined 18.59% in the same period, also bearish and decelerating. It had lower volatility, with an 8.11 standard deviation, and prices fluctuated between 83.67 and 118.85.
American Tower’s performance surpassed Crown Castle’s with a smaller percentage decline, indicating relatively better market resilience over the past year.
Target Prices
Analysts present a moderately optimistic consensus for American Tower Corporation and Crown Castle Inc.
| Company | Target Low | Target High | Consensus |
|---|---|---|---|
| American Tower Corporation | 185 | 255 | 214.6 |
| Crown Castle Inc. | 93 | 127 | 109.6 |
The target consensus for both REITs exceeds current prices, implying upside potential. American Tower’s consensus target stands about 21% above its $176.55 price, while Crown Castle’s is nearly 27% higher than its $86.11 share price. Analysts expect these communications infrastructure firms to rebound and grow.

Don’t Let Luck Decide Your Entry Point
Optimize your entry points with our advanced ProRealTime indicators. You’ll get efficient buy signals with precise price targets for maximum performance. Start outperforming now!
How do institutions grade them?
Here is a summary of the latest institutional grades for American Tower Corporation and Crown Castle Inc.:
American Tower Corporation Grades
The table below lists recent grades assigned by key financial institutions:
| Grading Company | Action | New Grade | Date |
|---|---|---|---|
| UBS | Maintain | Buy | 2026-01-20 |
| Scotiabank | Maintain | Sector Outperform | 2026-01-14 |
| JP Morgan | Maintain | Overweight | 2026-01-12 |
| Mizuho | Maintain | Neutral | 2026-01-12 |
| BMO Capital | Downgrade | Market Perform | 2026-01-09 |
| RBC Capital | Maintain | Sector Perform | 2025-12-19 |
| Morgan Stanley | Maintain | Overweight | 2025-12-05 |
| Barclays | Downgrade | Equal Weight | 2025-12-01 |
| Barclays | Maintain | Overweight | 2025-11-17 |
| JP Morgan | Maintain | Overweight | 2025-10-29 |
Crown Castle Inc. Grades
Below are the recent institutional grades for Crown Castle Inc.:
| Grading Company | Action | New Grade | Date |
|---|---|---|---|
| Jefferies | Maintain | Buy | 2026-02-04 |
| Keybanc | Maintain | Overweight | 2026-01-21 |
| UBS | Maintain | Buy | 2026-01-20 |
| Goldman Sachs | Maintain | Neutral | 2026-01-20 |
| Scotiabank | Maintain | Sector Perform | 2026-01-14 |
| JP Morgan | Maintain | Neutral | 2026-01-12 |
| Wells Fargo | Maintain | Overweight | 2025-12-16 |
| Barclays | Downgrade | Equal Weight | 2025-12-01 |
| Barclays | Maintain | Overweight | 2025-11-17 |
| JP Morgan | Maintain | Neutral | 2025-10-23 |
Which company has the best grades?
American Tower Corporation generally receives more “Overweight” and “Sector Outperform” ratings, while Crown Castle Inc. has more “Neutral” and “Equal Weight” grades. Investors may interpret this as stronger institutional confidence in American Tower.
Risks specific to each company
The following categories identify the critical pressure points and systemic threats facing both firms in the 2026 market environment:
1. Market & Competition
American Tower Corporation
- Dominates global tower REITs with 219K sites, facing intense telecom infrastructure competition.
Crown Castle Inc.
- Controls 40K towers plus extensive fiber; competition from fiber-centric providers pressures margins.
2. Capital Structure & Debt
American Tower Corporation
- High debt-to-assets at 72%, with leverage concerns; interest coverage moderate at 3.58x.
Crown Castle Inc.
- Debt-to-assets extremely high at 90%, negative interest coverage signals distress and refinancing risks.
3. Stock Volatility
American Tower Corporation
- Beta at 0.94 suggests moderate market sensitivity; price range stable between $167-$234.
Crown Castle Inc.
- Beta near 0.98 indicates slightly higher volatility; wider price range from $83 to $116.
4. Regulatory & Legal
American Tower Corporation
- Regulatory environment stable but evolving telecom policies could pressure expansion.
Crown Castle Inc.
- Faces similar telecom regulatory risks; fiber expansion subject to local permits and compliance costs.
5. Supply Chain & Operations
American Tower Corporation
- Global operations may face supply chain delays impacting tower deployment and maintenance.
Crown Castle Inc.
- Fiber and small cell deployment vulnerable to supply chain bottlenecks and labor shortages.
6. ESG & Climate Transition
American Tower Corporation
- Focuses on energy efficiency in towers; climate risks moderate but growing in emerging markets.
Crown Castle Inc.
- Increasing pressure to reduce carbon footprint on fiber networks; ESG initiatives still evolving.
7. Geopolitical Exposure
American Tower Corporation
- Global footprint exposes to geopolitical risks, especially in emerging economies.
Crown Castle Inc.
- Operations mainly US-based, reducing foreign geopolitical risks but increasing domestic regulatory scrutiny.
Which company shows a better risk-adjusted profile?
American Tower’s main risk lies in high leverage but sustainable interest coverage. Crown Castle’s critical threat is its extreme leverage and negative interest coverage, elevating bankruptcy risk. I see American Tower with a comparatively better risk-adjusted profile, given its more balanced capital structure and global diversification, despite operational complexity. Recent data shows Crown Castle’s negative net margin and interest coverage as glaring red flags.
Final Verdict: Which stock to choose?
American Tower’s superpower lies in its steadily growing profitability and robust income quality, signaling improving operational execution. Its high leverage and weak liquidity pose points of vigilance that could amplify risk in volatile markets. This stock suits investors with an appetite for aggressive growth and a tolerance for financial leverage.
Crown Castle’s strategic moat stems from its strong return on equity and recurring revenue streams, offering a defensive profile relative to American Tower. However, its declining ROIC trend and distress-zone financial health warrant caution. It fits a GARP (Growth at a Reasonable Price) portfolio seeking more stability but mindful of operational headwinds.
If you prioritize growth backed by improving profitability and can manage leverage risk, American Tower outshines with its rising income quality. However, if you seek a more stable income fortress with a strong equity return, Crown Castle offers better stability despite its troubling ROIC trend. Both present nuanced scenarios requiring careful risk assessment aligned with investor profiles.
Disclaimer: Investment carries a risk of loss of initial capital. The past performance is not a reliable indicator of future results. Be sure to understand risks before making an investment decision.
Go Further
I encourage you to read the complete analyses of American Tower Corporation and Crown Castle Inc. to enhance your investment decisions: