Home > Comparison > Financial Services > AIG vs HIG
The strategic rivalry between American International Group, Inc. (AIG) and The Hartford Financial Services Group, Inc. (HIG) defines the current trajectory of the diversified insurance sector. AIG operates as a global insurance powerhouse with broad commercial and life insurance offerings, while Hartford focuses on tailored commercial and group benefits solutions primarily in the U.S. This head-to-head pits scale and diversification against specialized service depth. This analysis will identify which firm offers superior risk-adjusted potential for a diversified portfolio.

Table of contents
Companies Overview
American International Group and The Hartford stand as pillars in the diversified insurance industry. Both companies wield significant influence across North America and beyond, shaping risk management and financial services.
American International Group, Inc.: Global Insurance Powerhouse
American International Group dominates with diversified insurance products spanning commercial, institutional, and personal lines. Its core revenue engine blends general insurance—covering liability, property, and specialty risks—with life and retirement solutions. In 2026, AIG sharpens its strategic focus on expanding its global footprint and enhancing digital distribution channels to drive growth and operational efficiency.
The Hartford Financial Services Group, Inc.: U.S.-Focused Insurance Innovator
The Hartford commands a strong position in commercial and personal insurance, complemented by group benefits and investment management services. It generates revenue through tailored risk management, property and casualty lines, and retirement-oriented financial products. The company’s 2026 strategy centers on deepening its U.S. market penetration and expanding its group benefits offerings to capture emerging client needs.
Strategic Collision: Similarities & Divergences
Both firms champion diversified insurance portfolios yet diverge in scale and geographic focus—AIG pursues a broader international scope, while Hartford cements its U.S.-centric approach. Their primary battleground lies in commercial insurance and risk management services, where tailored solutions matter most. Investors will note AIG’s global diversification contrasts sharply with Hartford’s concentrated U.S. market expertise.
Income Statement Comparison
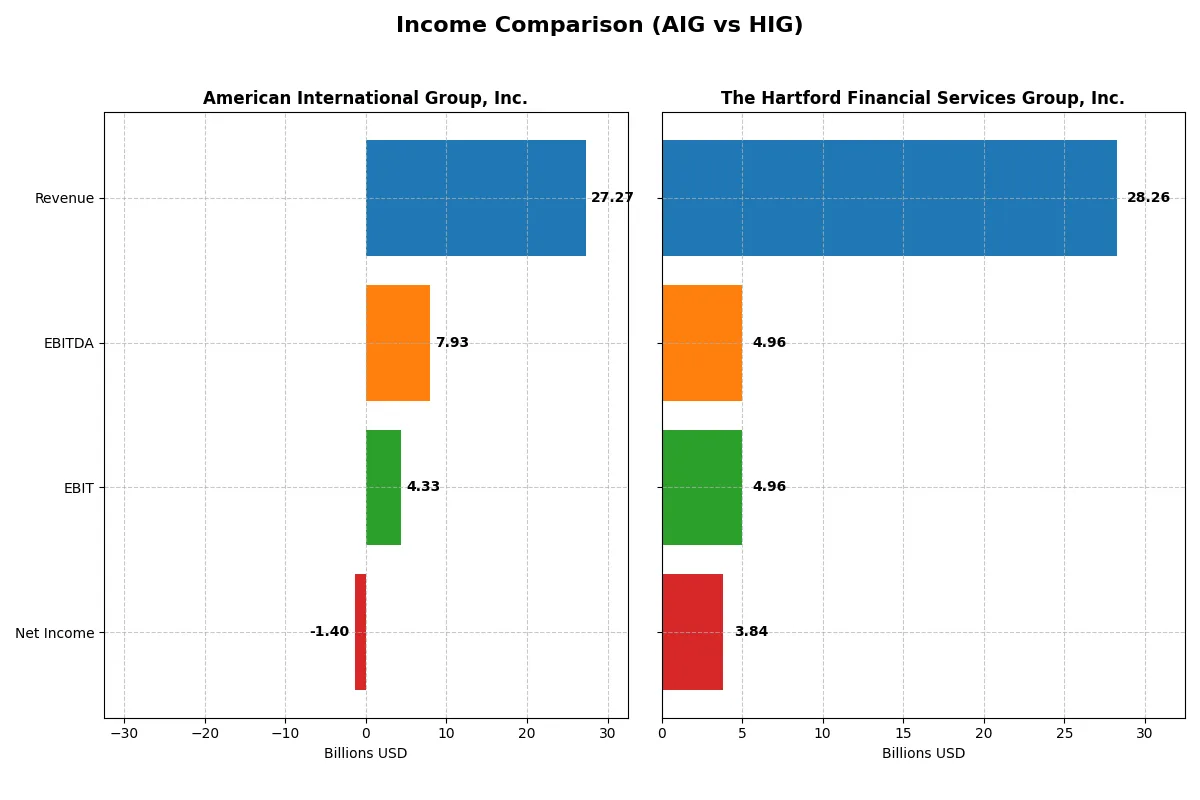
This table dissects the core profitability and scalability of both corporate engines to reveal who dominates the bottom line:
| Metric | American International Group, Inc. (AIG) | The Hartford Financial Services Group, Inc. (HIG) |
|---|---|---|
| Revenue | 27.3B | 26.4B |
| Cost of Revenue | 18.0B | 22.4B |
| Operating Expenses | 5.4B | 0.1B |
| Gross Profit | 9.3B | 4.0B |
| EBITDA | 7.9B | 4.2B |
| EBIT | 4.3B | 3.8B |
| Interest Expense | 0.5B | 0.2B |
| Net Income | -1.4B | 3.1B |
| EPS | 2.35 | 10.51 |
| Fiscal Year | 2024 | 2024 |
Income Statement Analysis: The Bottom-Line Duel
This comparison reveals the true efficiency and profitability of two financial giants over recent years, highlighting their operational strengths and weaknesses.
American International Group, Inc. Analysis
AIG’s revenue declined by 2.5% in 2024 to $27.3B, yet its gross profit more than doubled, signaling improved cost control. The gross margin stays favorable at 34%. However, net income swung to a loss of $-1.4B in 2024, largely due to discontinued operations, reflecting volatility despite an improving EBIT margin of 15.9%.
The Hartford Financial Services Group, Inc. Analysis
Hartford’s revenue grew moderately by 7.1% in 2025, reaching $28.3B, with a robust gross margin of 46%. Net income rose 23% to $3.8B, supported by strong EBIT growth of nearly 29%. The net margin of 13.6% indicates consistent profitability and efficient expense management.
Margin Power vs. Revenue Scale
Hartford outperforms AIG in margin quality and revenue growth, delivering steady net income gains with superior profitability metrics. AIG’s larger scale is undermined by net losses and operational swings. For investors, Hartford’s stable earnings profile and margin expansion offer a more compelling fundamental foundation.
Financial Ratios Comparison
These vital ratios act as a diagnostic tool to expose underlying fiscal health, valuation premiums, and capital efficiency for two leading insurers as of their latest fiscal years:
| Ratios | American International Group, Inc. (AIG) | The Hartford Financial Services Group, Inc. (HIG) |
|---|---|---|
| ROE | -3.30% (2024) | 20.21% (2025) |
| ROIC | 0.00% (2024) | 28.21% (2025) |
| P/E | -31.43 (2024) | 10.14 (2025) |
| P/B | 1.04 (2024) | 2.05 (2025) |
| Current Ratio | N/A | 17.65 (2025) |
| Quick Ratio | N/A | 17.65 (2025) |
| D/E | 0.21 (2024) | 0.23 (2025) |
| Debt-to-Assets | 5.53% (2024) | 5.08% (2025) |
| Interest Coverage | 8.37 (2024) | 23.92 (2025) |
| Asset Turnover | 0.17 (2024) | 0.33 (2025) |
| Fixed Asset Turnover | 0 (2024) | 30.35 (2025) |
| Payout ratio | -72.93% (2024) | 15.90% (2025) |
| Dividend yield | 2.32% (2024) | 1.57% (2025) |
| Fiscal Year | 2024 | 2025 |
Efficiency & Valuation Duel: The Vital Signs
Financial ratios act as a company’s DNA, exposing hidden risks and operational strengths that guide investor decisions decisively.
American International Group, Inc.
AIG posts a negative ROE of -3.3% and a net margin of -5.15%, signaling weak profitability. Its P/E ratio is negative but paired with a modest P/B of 1.04, suggesting the stock is fairly valued but operationally strained. The 2.32% dividend yield offers some shareholder return amid limited reinvestment in R&D.
The Hartford Financial Services Group, Inc.
HIG demonstrates robust profitability with a 20.21% ROE and a 13.57% net margin, indicating efficient operations. Its P/E of 10.14 shows reasonable valuation, while a 2.05 P/B ratio is neutral. The company balances growth and shareholder returns with a stable dividend yield of 1.57%, reflecting solid capital allocation.
Robust Profitability Meets Valuation Discipline
HIG outperforms AIG significantly in profitability and operational efficiency, reflected in stronger ROE and net margins. AIG’s valuation appears fair but is overshadowed by weak returns and operational challenges. Investors seeking stability and growth may favor HIG’s profile, while AIG’s riskier stance suits those tolerant of operational turnaround.
Which one offers the Superior Shareholder Reward?
I compare American International Group (AIG) and The Hartford Financial Services Group (HIG) on distribution strategies. AIG yields ~2.3% with an inconsistent payout and negative net margins recently, signaling dividend risk. HIG offers a lower yield near 1.6%-2.2% but sustains a stable payout ratio (~16%-22%) and consistent free cash flow coverage. While AIG’s buyback activity is less transparent, HIG demonstrates steady capital return via dividends and moderate buybacks. HIG’s conservative leverage and robust profit margins support a more sustainable shareholder reward. I judge HIG provides a superior total return profile for 2026 investors.
Comparative Score Analysis: The Strategic Profile
The radar chart reveals the fundamental DNA and trade-offs of American International Group and The Hartford Financial Services Group:
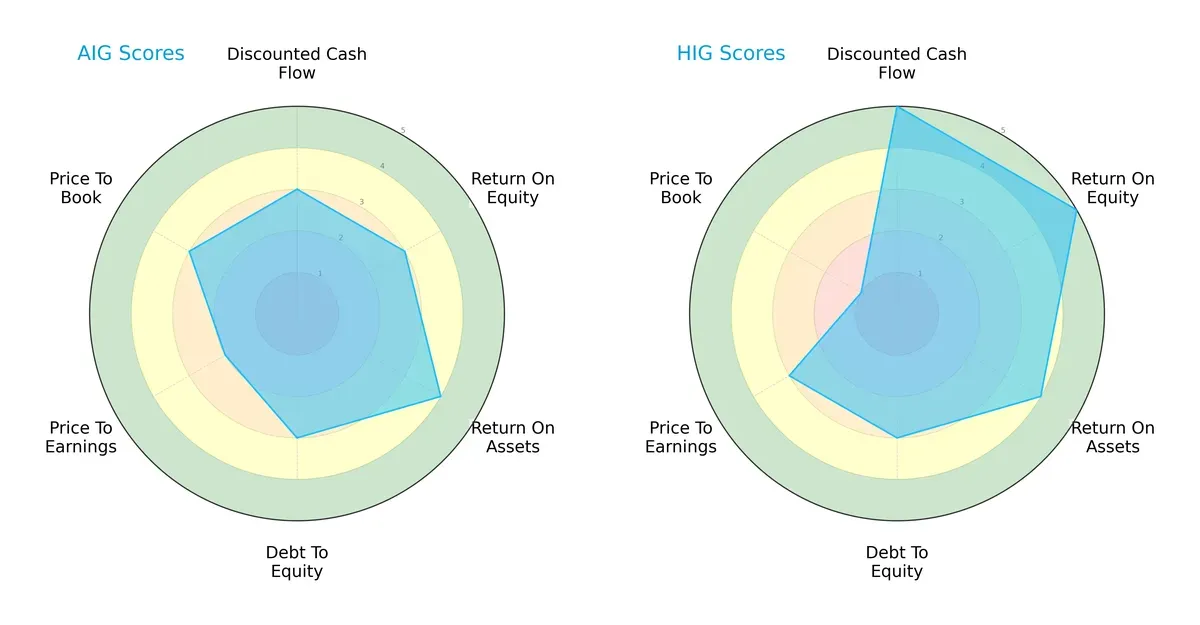
American International Group (AIG) shows a balanced profile with moderate scores in DCF, ROE, and Debt/Equity but slightly weaker valuation metrics. The Hartford (HIG) dominates in DCF and ROE with very favorable scores but suffers from a very unfavorable Price-to-Book ratio. HIG relies on profitability strength, while AIG maintains steadier valuation balance.
Bankruptcy Risk: Solvency Showdown
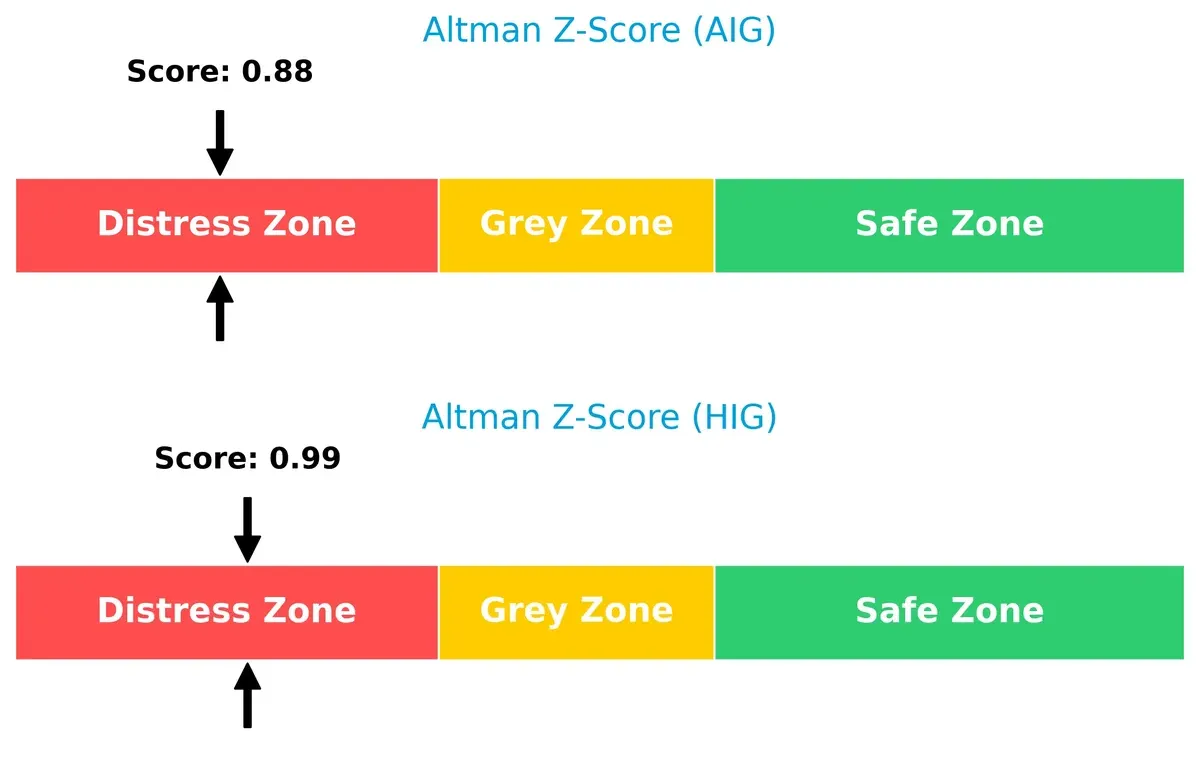
Both AIG and HIG fall in the distress zone with Altman Z-Scores below 1.0, signaling high bankruptcy risk in the current economic cycle:
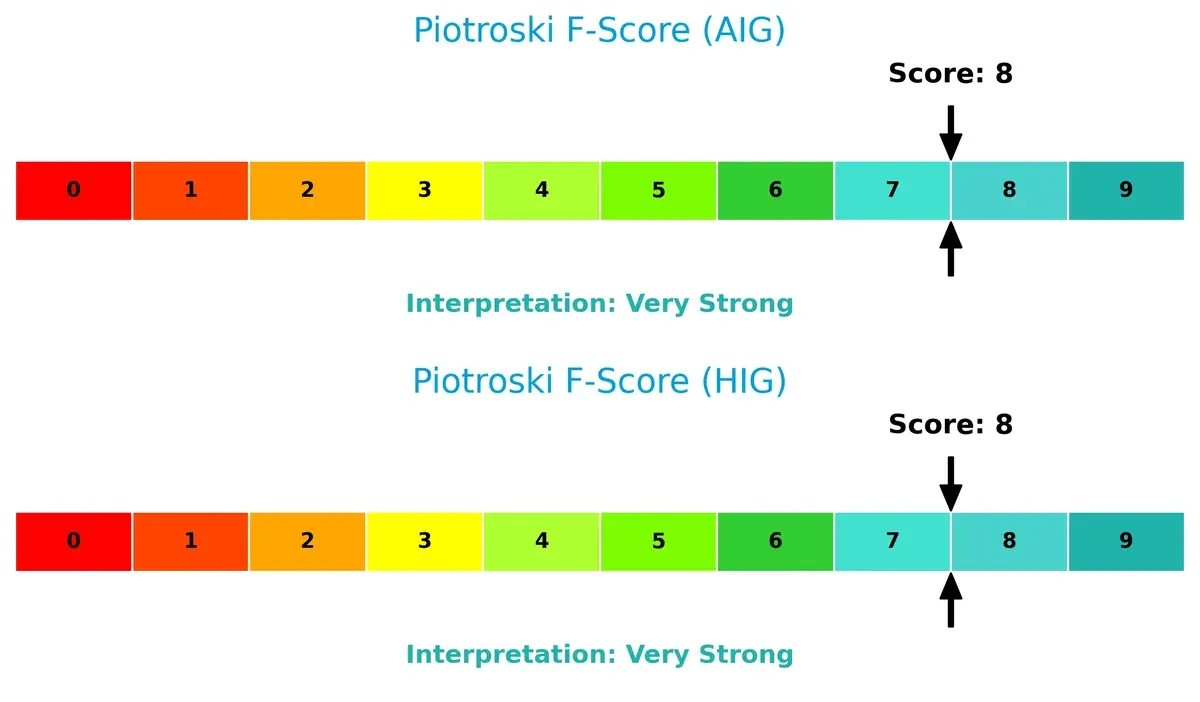
Financial Health: Quality of Operations
Both firms score 8 on the Piotroski F-Score, indicating very strong financial health and operational quality. Neither shows red flags relative to each other:
How are the two companies positioned?
This section dissects the operational DNA of AIG and HIG by comparing their revenue distribution and internal dynamics. The goal is to confront their economic moats and identify which model offers the most resilient competitive advantage.
Revenue Segmentation: The Strategic Mix
The following visual comparison dissects how American International Group, Inc. and The Hartford Financial Services Group, Inc. diversify their income streams and where their primary sector bets lie:
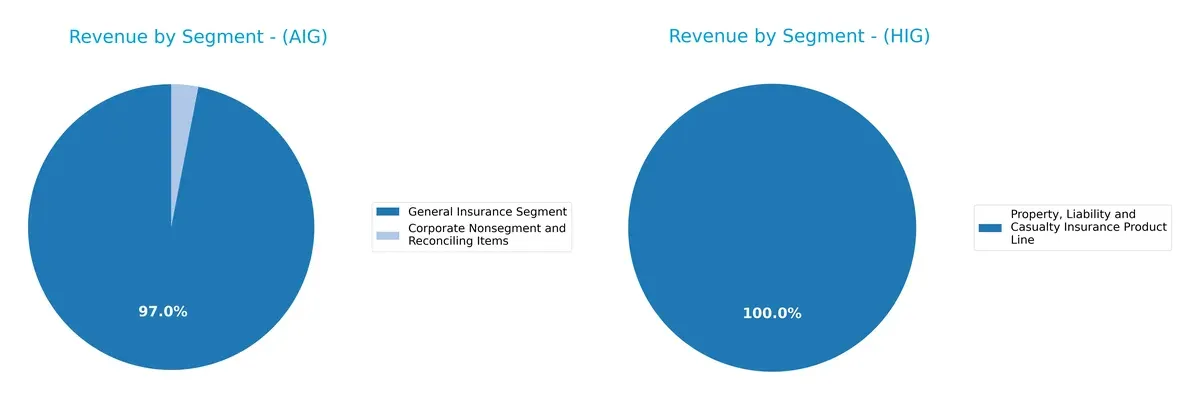
American International Group anchors revenue heavily in its General Insurance Segment with $27.7B in 2024, complemented by Life and Retirement segments. The Hartford shows a more segmented approach, with no single dominant revenue source, spreading across multiple insurance lines like Commercial Automobiles ($3.1B) and Group Life and Accident ($5.2B). AIG’s concentration suggests infrastructure dominance but poses concentration risk, while Hartford’s spread signals diversification and resilience.
Strengths and Weaknesses Comparison
This table compares the Strengths and Weaknesses of American International Group, Inc. (AIG) and The Hartford Financial Services Group, Inc. (HIG):
AIG Strengths
- Diverse revenue from General Insurance and Life & Retirement segments
- Favorable debt-to-equity ratio (0.21) and low debt-to-assets (5.53%)
- Strong interest coverage (9.38) supports financial stability
- Dividend yield at 2.32% provides income return
HIG Strengths
- Strong profitability metrics: net margin 13.57%, ROE 20.21%, ROIC 28.21%
- Favorable capital structure with debt-to-equity 0.23 and low debt-to-assets (5.08%)
- Excellent interest coverage (24.92) indicates robust earnings to cover debt costs
- High fixed asset turnover (30.35) signals operational efficiency
AIG Weaknesses
- Negative net margin (-5.15%) and ROE (-3.3%) indicate profitability issues
- ROIC at 0% signals no return above capital costs
- Zero current and quick ratios pose liquidity concerns
- Low asset turnover (0.17) shows inefficient asset use
HIG Weaknesses
- High current ratio (17.65) may indicate inefficient asset deployment
- Asset turnover remains low (0.33), limiting revenue generation from assets
- Neutral P/B ratio (2.05) suggests moderate market valuation
- Dividend yield neutral at 1.57%, less attractive for income investors
Both companies show solid capital structures and debt management, but HIG’s superior profitability and operational efficiency stand out. AIG faces significant profitability and liquidity challenges that could impact its strategic flexibility.
The Moat Duel: Analyzing Competitive Defensibility
A structural moat is the only reliable shield protecting long-term profits from relentless competition erosion:
American International Group, Inc. (AIG): Diversified Risk Portfolio
AIG’s moat stems from its broad insurance product diversification, supporting margin stability despite fierce market pressure. However, its negative ROIC vs. WACC signals value destruction, threatening moat durability in 2026.
The Hartford Financial Services Group, Inc. (HIG): Efficient Capital Allocation
HIG’s moat relies on superior capital efficiency and strong underwriting discipline. It commands a 21.8% ROIC spread over WACC, showing robust value creation and expanding profitability, poised to deepen its competitive edge next year.
Capital Efficiency vs. Diversification: The Moat Faceoff
HIG holds the deeper moat with a high and growing ROIC that outpaces its cost of capital. AIG’s diversified portfolio lacks capital efficiency, risking market share erosion. HIG is better equipped to defend and grow its franchise.
Which stock offers better returns?
The stock price movements over the past 12 months reveal distinct trajectories for both companies, with notable price peaks and shifts in market momentum shaping their trading dynamics.
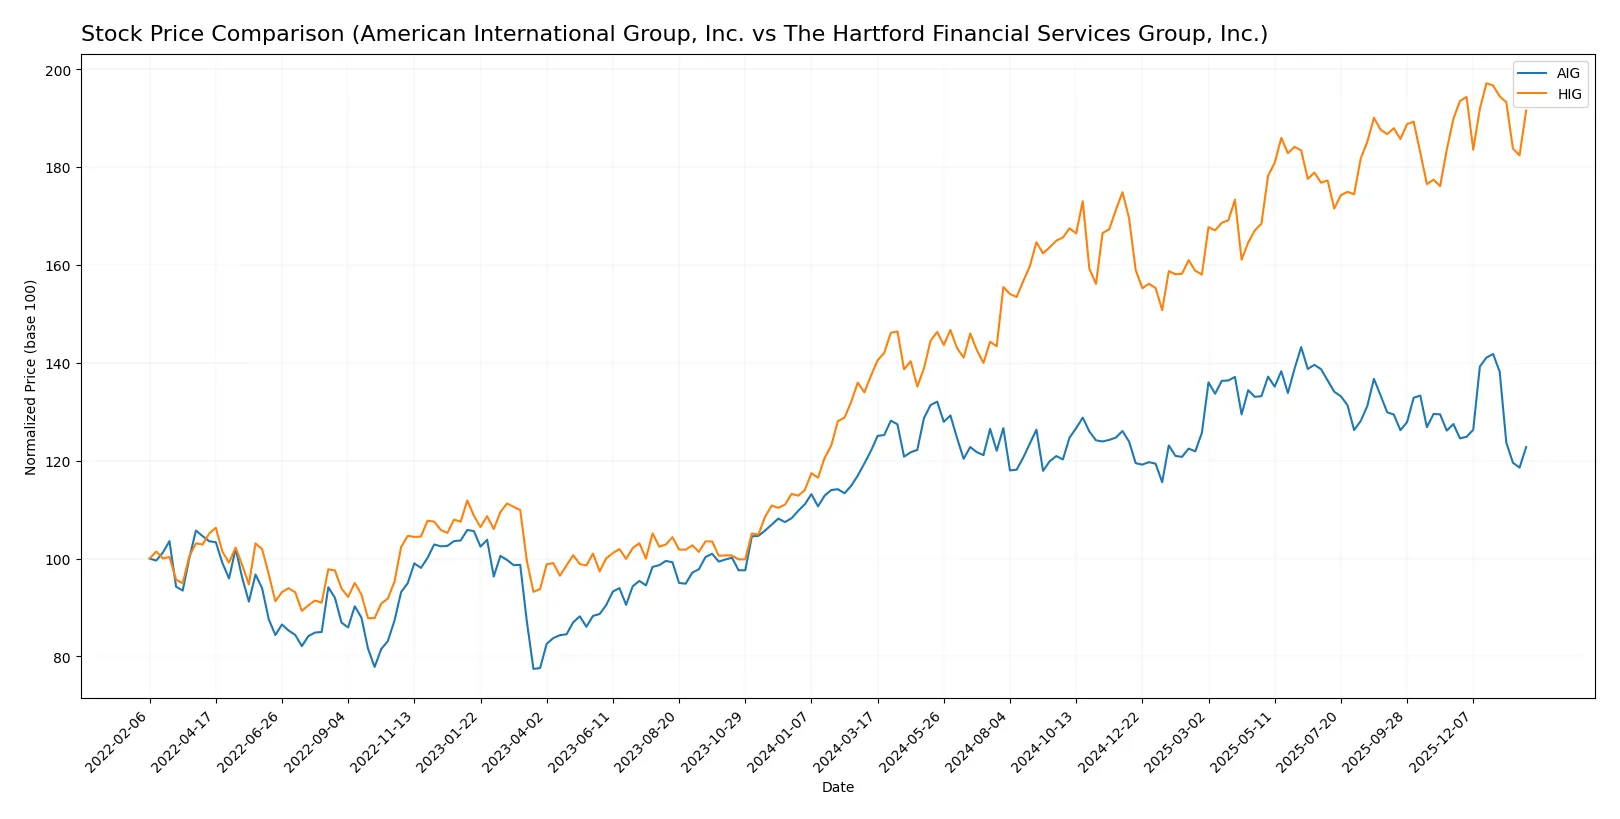
Trend Comparison
American International Group, Inc. (AIG) shows a modest bullish trend with a 0.63% price increase over the past year, but recent months reveal a bearish reversal of -3.69%, indicating decelerating momentum. The stock’s price ranged between 70.5 and 87.34, with volatility measured by a 3.99 std deviation.
The Hartford Financial Services Group, Inc. (HIG) displays a strong bullish trend with a 39.44% price gain over the past year, despite recent mild deceleration and a 0.9% increase in the last quarter. Price oscillated between 95.3 and 139.01, with higher volatility at an 11.88 std deviation.
Comparing the two, HIG delivered substantially higher market returns over the 12-month period, outperforming AIG with a pronounced upward trend and greater price appreciation.
Target Prices
Analysts present a bullish consensus for both American International Group, Inc. and The Hartford Financial Services Group, Inc.
| Company | Target Low | Target High | Consensus |
|---|---|---|---|
| American International Group, Inc. | 77 | 95 | 85.25 |
| The Hartford Financial Services Group, Inc. | 135 | 161 | 152.5 |
The target consensus for AIG stands roughly 14% above its current price of $74.88, suggesting moderate upside. Hartford’s target is about 13% higher than its $135.06 trading price, reflecting similar growth expectations.

Don’t Let Luck Decide Your Entry Point
Optimize your entry points with our advanced ProRealTime indicators. You’ll get efficient buy signals with precise price targets for maximum performance. Start outperforming now!
How do institutions grade them?
Here is a summary of recent institutional grades for American International Group, Inc. and The Hartford Financial Services Group, Inc.:
American International Group, Inc. Grades
The following table shows the latest grades given by recognized grading firms for AIG:
| Grading Company | Action | New Grade | Date |
|---|---|---|---|
| Cantor Fitzgerald | Maintain | Neutral | 2026-01-14 |
| Wells Fargo | Maintain | Equal Weight | 2026-01-13 |
| Barclays | Maintain | Equal Weight | 2026-01-08 |
| Keefe, Bruyette & Woods | Maintain | Outperform | 2026-01-06 |
| Piper Sandler | Maintain | Overweight | 2025-12-22 |
| TD Cowen | Maintain | Hold | 2025-12-16 |
| Barclays | Downgrade | Equal Weight | 2025-12-05 |
| Goldman Sachs | Maintain | Neutral | 2025-11-20 |
| Wells Fargo | Maintain | Equal Weight | 2025-11-12 |
| Barclays | Maintain | Overweight | 2025-11-05 |
The Hartford Financial Services Group, Inc. Grades
The table below lists the latest institutional grades for HIG:
| Grading Company | Action | New Grade | Date |
|---|---|---|---|
| Roth Capital | Maintain | Neutral | 2026-01-30 |
| Cantor Fitzgerald | Maintain | Overweight | 2026-01-14 |
| Wells Fargo | Maintain | Overweight | 2026-01-13 |
| JP Morgan | Maintain | Neutral | 2026-01-07 |
| Evercore ISI Group | Maintain | In Line | 2026-01-07 |
| Keefe, Bruyette & Woods | Maintain | Outperform | 2026-01-06 |
| Piper Sandler | Maintain | Overweight | 2025-12-22 |
| UBS | Maintain | Buy | 2025-12-08 |
| Argus Research | Maintain | Buy | 2025-11-25 |
| Morgan Stanley | Maintain | Equal Weight | 2025-11-17 |
Which company has the best grades?
HIG shows a stronger consensus with multiple Buy and Overweight ratings, indicating more bullish institutional sentiment than AIG. Investors might perceive HIG as having better near-term growth prospects or risk-adjusted returns.
Risks specific to each company
The following categories identify the critical pressure points and systemic threats facing both firms in the 2026 market environment:
1. Market & Competition
American International Group, Inc. (AIG)
- Faces intense competition in diversified insurance products globally, with pressure on net margins and ROIC showing operational challenges.
The Hartford Financial Services Group, Inc. (HIG)
- Strong market position with favorable net margin and ROIC, benefiting from diversified segments and effective capital allocation.
2. Capital Structure & Debt
American International Group, Inc. (AIG)
- Maintains low debt-to-equity at 0.21, interest coverage at 9.38, reflecting prudent leverage and manageable debt costs.
The Hartford Financial Services Group, Inc. (HIG)
- Slightly higher debt-to-equity ratio at 0.23 but superior interest coverage of 24.92, indicating robust debt servicing capacity.
3. Stock Volatility
American International Group, Inc. (AIG)
- Beta of 0.624 signals moderate volatility below market average, offering relative stock price stability.
The Hartford Financial Services Group, Inc. (HIG)
- Beta of 0.613 also indicates low volatility, providing a stable risk profile comparable to AIG.
4. Regulatory & Legal
American International Group, Inc. (AIG)
- Operates globally, exposing it to varied regulatory regimes and compliance costs, with potential legal liabilities.
The Hartford Financial Services Group, Inc. (HIG)
- Focuses on U.S. and UK markets with established regulatory frameworks but faces risks from evolving insurance laws and claims litigation.
5. Supply Chain & Operations
American International Group, Inc. (AIG)
- Complex product offerings require sophisticated operational management; asset turnover at 0.17 is suboptimal, indicating inefficiencies.
The Hartford Financial Services Group, Inc. (HIG)
- Higher asset turnover of 0.33 and fixed asset turnover at 30.35 demonstrate more efficient asset utilization and operational effectiveness.
6. ESG & Climate Transition
American International Group, Inc. (AIG)
- Faces ESG risks inherent to insurance on environmental liabilities and climate change impact on underwriting portfolios.
The Hartford Financial Services Group, Inc. (HIG)
- Active in ESG integration with risk management aligned to climate transition, but must navigate increased disclosure regulations.
7. Geopolitical Exposure
American International Group, Inc. (AIG)
- Global footprint increases exposure to geopolitical instability and currency fluctuations affecting earnings.
The Hartford Financial Services Group, Inc. (HIG)
- Concentrated mostly in stable markets (U.S., UK), lowering geopolitical risks but still vulnerable to international trade tensions.
Which company shows a better risk-adjusted profile?
The single most impactful risk for AIG is its weak profitability and operational inefficiency, reflected in negative net margin and ROIC near zero. Hartford’s primary concern is its stretched current ratio at 17.65, signaling potential liquidity distortion despite strong profitability. Hartford displays a better risk-adjusted profile, supported by superior profitability metrics and operational efficiency. Recent data highlights AIG’s Altman Z-Score deep in the distress zone, underscoring financial vulnerability versus Hartford’s healthier position.
Final Verdict: Which stock to choose?
American International Group (AIG) excels as a cash generator with a solid capital structure that supports resilience. Its main point of vigilance is the lack of excess capital to reinvest, signaling limited growth potential. AIG fits portfolios seeking steady income with a moderate risk tolerance.
The Hartford Financial Services Group (HIG) stands out with a durable competitive moat driven by its efficient capital allocation and robust profitability. It offers better stability than AIG, backed by a strong ROIC well above its WACC. HIG suits investors favoring growth at a reasonable price with a focus on quality.
If you prioritize resilient value creation and capital efficiency, HIG is the compelling choice due to its durable moat and superior profitability. However, if you seek a reliable cash flow engine with moderate risk, AIG offers a cash machine profile. Both carry risks, but HIG outshines in growth durability while AIG appeals to income-focused investors.
Disclaimer: Investment carries a risk of loss of initial capital. The past performance is not a reliable indicator of future results. Be sure to understand risks before making an investment decision.
Go Further
I encourage you to read the complete analyses of American International Group, Inc. and The Hartford Financial Services Group, Inc. to enhance your investment decisions: