American International Group, Inc. (AIG) and Principal Financial Group, Inc. (PFG) are two prominent players in the diversified insurance industry, offering a broad range of products from personal insurance to retirement solutions. Both companies share a commitment to innovation and global market presence but differ in their core strategies and client focus. In this article, I will analyze their strengths and risks to help you decide which stock deserves a place in your portfolio.

Table of contents
Companies Overview
I will begin the comparison between American International Group, Inc. and Principal Financial Group, Inc. by providing an overview of these two companies and their main differences.
American International Group, Inc. Overview
American International Group, Inc. (AIG) operates in the diversified insurance sector, serving commercial, institutional, and individual customers globally. Its offerings span general insurance, including liability and property coverage, as well as life and retirement products such as variable annuities and financial advisory services. Founded in 1919 and headquartered in New York City, AIG is a prominent player in insurance with a market cap of approximately $40B.
Principal Financial Group, Inc. Overview
Principal Financial Group, Inc. (PFG) provides retirement, asset management, and insurance products worldwide. Its business segments include retirement solutions, global investments, international pensions, and U.S. insurance services, covering a broad range of life and specialty insurance products. Founded in 1879 and based in Des Moines, Iowa, Principal has a market cap near $20B and focuses on diversified financial services for individuals and institutions.
Key similarities and differences
Both AIG and Principal operate within the diversified insurance industry and offer life insurance and retirement products. However, AIG emphasizes general insurance lines and crisis management, while Principal leans toward retirement solutions and asset management. AIG’s portfolio spans commercial and personal insurance, whereas Principal integrates global investment management and international pension services, reflecting differing strategic focuses within the financial services sector.
Income Statement Comparison
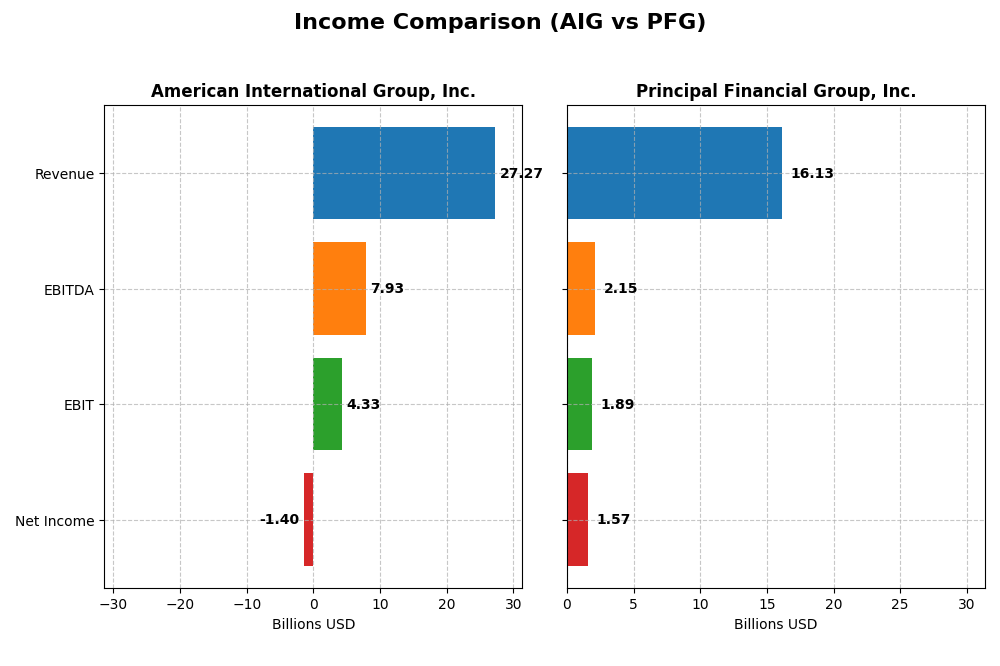
This table presents a side-by-side comparison of the most recent fiscal year income statement figures for American International Group, Inc. (AIG) and Principal Financial Group, Inc. (PFG).
| Metric | American International Group, Inc. (AIG) | Principal Financial Group, Inc. (PFG) |
|---|---|---|
| Market Cap | 40.1B | 20.3B |
| Revenue | 27.3B | 16.1B |
| EBITDA | 7.93B | 2.15B |
| EBIT | 4.33B | 1.89B |
| Net Income | -1.40B | 1.57B |
| EPS | 2.35 | 6.77 |
| Fiscal Year | 2024 | 2024 |
Income Statement Interpretations
American International Group, Inc.
From 2020 to 2024, AIG’s revenue trend was downward, declining by 37.8%, while net income showed a positive growth of 76.38%. Gross and EBIT margins remained favorable at 34.02% and 15.89%, respectively. However, the 2024 net margin dipped to -5.15%, reflecting a net loss despite improved EBIT and gross profit growth in the latest year.
Principal Financial Group, Inc.
PFG experienced steady growth in revenue and net income over the 2020-2024 period, with respective growth rates of 9.4% and 12.55%. Its margins were strong, highlighted by a 45.59% gross margin and a 9.74% net margin in 2024. The most recent year showed significant improvements in EBIT and net margin, as well as robust EPS growth, indicating solid operational performance.
Which one has the stronger fundamentals?
Comparing both, PFG demonstrates more consistent revenue and net income growth with predominantly favorable margins and no unfavorable evaluations. AIG, despite positive net income growth overall and strong operational margins, suffers from recent net losses and declining revenue. Thus, PFG’s income statement reflects relatively stronger and more stable fundamentals.
Financial Ratios Comparison
Below is a comparison of key financial ratios for American International Group, Inc. (AIG) and Principal Financial Group, Inc. (PFG) based on their most recent fiscal year 2024 data.
| Ratios | American International Group, Inc. (AIG) | Principal Financial Group, Inc. (PFG) |
|---|---|---|
| ROE | -3.30% | 14.17% |
| ROIC | 0% | 10.46% |
| P/E | -31.43 | 11.15 |
| P/B | 1.04 | 1.58 |
| Current Ratio | 0 | 0 |
| Quick Ratio | 0 | 0 |
| D/E (Debt-to-Equity) | 0.21 | 0.37 |
| Debt-to-Assets | 5.53% | 1.31% |
| Interest Coverage | 8.37 | 726.77 |
| Asset Turnover | 0.17 | 0.05 |
| Fixed Asset Turnover | 0 | 20.96 |
| Payout Ratio | -72.93% | 41.91% |
| Dividend Yield | 2.32% | 3.76% |
Interpretation of the Ratios
American International Group, Inc. (AIG)
AIG shows mixed financial health with half of its key ratios favorable, such as a low debt-to-equity ratio of 0.21 and a strong interest coverage of 9.38, but concerns arise from negative net margin (-5.15%) and return on equity (-3.3%). Asset turnover is weak at 0.17. The company pays dividends with a 2.32% yield, signaling shareholder returns but the payout may carry risk given the uneven profitability.
Principal Financial Group, Inc. (PFG)
PFG displays a generally favorable ratio profile, with 57% favorable metrics including a very high ROIC of 1046.43% and strong interest coverage of 726.77. However, asset turnover remains low at 0.05, and current and quick ratios are unfavorable. Dividend yield is higher at 3.76%, supported by a payout consistent with stable earnings and cash flow, despite some neutral indicators like ROE at 14.17%.
Which one has the best ratios?
Comparing both, PFG holds a more favorable overall ratio evaluation with stronger returns on invested capital, superior interest coverage, and higher dividend yield. AIG presents balanced strengths and weaknesses but suffers from negative profitability ratios. Thus, PFG’s ratios suggest a comparatively stronger financial position based on the 2024 fiscal year data.
Strategic Positioning
This section compares the strategic positioning of American International Group, Inc. (AIG) and Principal Financial Group, Inc. (PFG) including market position, key segments, and exposure to technological disruption:
American International Group, Inc. (AIG)
- Large market cap of $40B with diversified insurance products and global footprint facing moderate competitive pressure.
- Key segments: General Insurance ($27.7B) and Life & Retirement ($17.7B) driving revenues across broad insurance and financial products.
- Exposure to technological disruption not specified explicitly in data, suggesting traditional insurance and financial services focus.
Principal Financial Group, Inc. (PFG)
- Mid-cap of $20B focused on retirement, asset management, and insurance with competitive positioning in diversified financial services.
- Key segments: Retirement and Investor Services ($7.9B), Benefits and Protection ($4.8B), and Asset Management ($2.8B) focus on retirement and investment solutions.
- No explicit data on technological disruption exposure; core business in retirement and asset management implies moderate technology reliance.
AIG vs PFG Positioning
AIG operates a broader, diversified insurance and financial services portfolio with significant global reach, while PFG concentrates on retirement and asset management services. AIG’s scale offers revenue diversity; PFG’s focus supports specialization in growing asset management areas.
Which has the best competitive advantage?
PFG shows a very favorable MOAT with growing ROIC well above WACC, indicating durable competitive advantage and value creation. AIG’s unfavorable MOAT reflects stable but value-destroying returns and no excess capital for reinvestment.
Stock Comparison
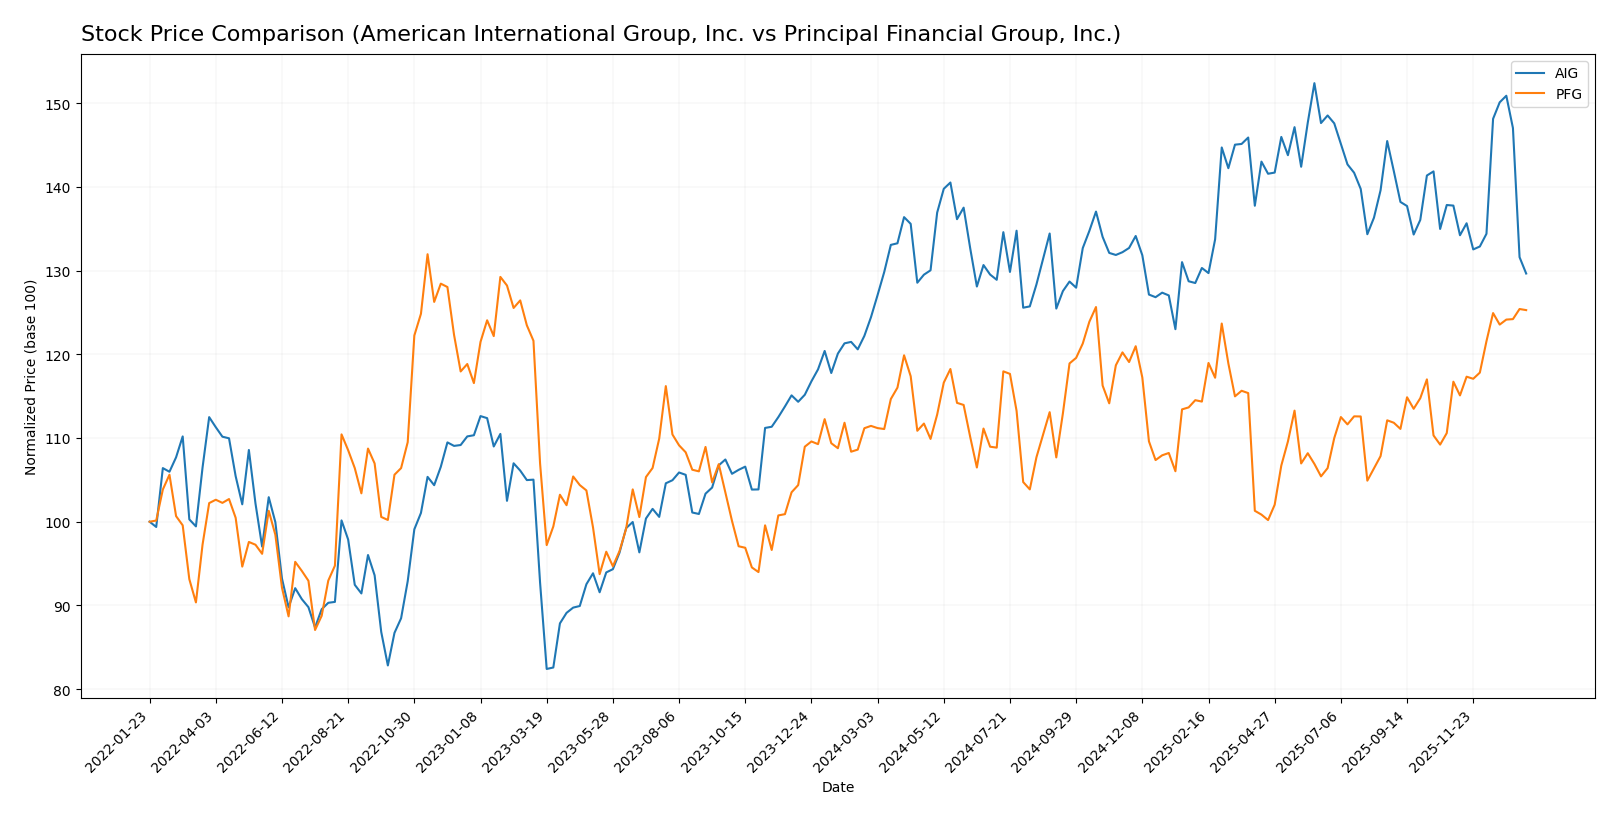
The stock price movements of American International Group, Inc. (AIG) and Principal Financial Group, Inc. (PFG) over the past 12 months reveal distinct bullish trends with varying acceleration patterns and volume dynamics.
Trend Analysis
American International Group, Inc. (AIG) experienced a 4.19% price increase over the past year, indicating a bullish trend with acceleration. The stock fluctuated between $70.5 and $87.34, showing moderate volatility with a 4.01 std deviation.
Principal Financial Group, Inc. (PFG) showed a stronger bullish trend with a 12.41% price gain over the same period, also accelerating. Its price ranged from $72.14 to $90.46, with a comparable volatility of 4.23 std deviation.
Comparing both, PFG delivered the highest market performance with a 12.41% increase, outperforming AIG’s 4.19% gain over the past 12 months.
Target Prices
Analysts present a positive target consensus for both American International Group, Inc. and Principal Financial Group, Inc.
| Company | Target High | Target Low | Consensus |
|---|---|---|---|
| American International Group, Inc. | 95 | 81 | 86.25 |
| Principal Financial Group, Inc. | 100 | 85 | 92.8 |
The target consensus for AIG at 86.25 USD is well above its current price of 74.34 USD, indicating potential upside. Similarly, PFG’s consensus target of 92.8 USD slightly exceeds its current price of 90.21 USD, suggesting moderate growth expectations.
Analyst Opinions Comparison
This section compares analysts’ ratings and grades for American International Group, Inc. (AIG) and Principal Financial Group, Inc. (PFG):
Rating Comparison
AIG Rating
- Rating: B+, classified as Very Favorable by analysts.
- Discounted Cash Flow Score: 4, indicating favorable valuation based on future cash flows.
- ROE Score: 3, showing moderate efficiency in generating profit from equity.
- ROA Score: 3, reflecting moderate asset utilization to generate earnings.
- Debt To Equity Score: 3, representing moderate financial risk and balance.
- Overall Score: 3, a moderate summary assessment of financial standing.
PFG Rating
- Rating: B+, also classified as Very Favorable by analysts.
- Discounted Cash Flow Score: 4, suggesting favorable future cash flow valuation.
- ROE Score: 4, indicating favorable efficiency in generating profit from equity.
- ROA Score: 2, showing moderate but lower asset utilization compared to AIG.
- Debt To Equity Score: 3, indicating similar moderate financial risk.
- Overall Score: 3, also a moderate overall financial standing assessment.
Which one is the best rated?
Both AIG and PFG share the same overall rating of B+ and an overall score of 3, indicating moderate standing. PFG scores higher in ROE while AIG has a better ROA score, suggesting different strengths in profitability and asset utilization.
Scores Comparison
Here is a comparison of the financial health scores for AIG and PFG:
AIG Scores
- Altman Z-Score: 0.88, in distress zone indicating high bankruptcy risk.
- Piotroski Score: 8, very strong financial health rating.
PFG Scores
- Altman Z-Score: 0.13, in distress zone showing very high bankruptcy risk.
- Piotroski Score: 9, very strong financial health rating.
Which company has the best scores?
Both AIG and PFG are in the Altman Z-Score distress zone, indicating financial distress risk. PFG has a slightly lower Z-Score but a higher Piotroski Score of 9 compared to AIG’s 8, suggesting marginally stronger financial health for PFG based on these scores.
Grades Comparison
Here is a detailed comparison of the recent grades assigned to American International Group, Inc. and Principal Financial Group, Inc.:
American International Group, Inc. Grades
The following table presents recent grades from established grading firms for AIG:
| Grading Company | Action | New Grade | Date |
|---|---|---|---|
| Barclays | Maintain | Equal Weight | 2026-01-08 |
| Keefe, Bruyette & Woods | Maintain | Outperform | 2026-01-06 |
| Piper Sandler | Maintain | Overweight | 2025-12-22 |
| TD Cowen | Maintain | Hold | 2025-12-16 |
| Barclays | Downgrade | Equal Weight | 2025-12-05 |
| Goldman Sachs | Maintain | Neutral | 2025-11-20 |
| Wells Fargo | Maintain | Equal Weight | 2025-11-12 |
| Barclays | Maintain | Overweight | 2025-11-05 |
| JP Morgan | Maintain | Neutral | 2025-10-09 |
| UBS | Maintain | Buy | 2025-10-08 |
The grades for AIG generally trend toward a neutral to slightly positive outlook, with multiple firms maintaining “Equal Weight,” “Hold,” or “Neutral” ratings, and some “Buy” or “Outperform” recommendations.
Principal Financial Group, Inc. Grades
The following table shows recent grades from reputable grading firms for PFG:
| Grading Company | Action | New Grade | Date |
|---|---|---|---|
| UBS | Maintain | Neutral | 2026-01-08 |
| JP Morgan | Downgrade | Neutral | 2026-01-05 |
| Piper Sandler | Maintain | Overweight | 2025-12-23 |
| Keefe, Bruyette & Woods | Maintain | Market Perform | 2025-10-30 |
| Wells Fargo | Maintain | Underweight | 2025-10-29 |
| Morgan Stanley | Upgrade | Equal Weight | 2025-10-23 |
| Keefe, Bruyette & Woods | Maintain | Market Perform | 2025-10-09 |
| Evercore ISI Group | Maintain | In Line | 2025-10-09 |
| Barclays | Maintain | Underweight | 2025-10-08 |
| Wells Fargo | Maintain | Underweight | 2025-10-08 |
Grades for PFG predominantly reflect a cautious stance, with multiple “Neutral,” “Market Perform,” and “Underweight” ratings, plus a recent downgrade by JP Morgan.
Which company has the best grades?
American International Group, Inc. has received comparatively stronger grades, including “Outperform,” “Overweight,” and “Buy,” indicating a more favorable analyst sentiment than Principal Financial Group, Inc., which shows a more conservative outlook with several “Underweight” and “Neutral” ratings. This difference may affect investor perception of growth potential and risk exposure.
Strengths and Weaknesses
Below is a comparative table summarizing key strengths and weaknesses of American International Group, Inc. (AIG) and Principal Financial Group, Inc. (PFG) based on the most recent financial and operational data.
| Criterion | American International Group, Inc. (AIG) | Principal Financial Group, Inc. (PFG) |
|---|---|---|
| Diversification | Moderate diversification with strong general insurance and life & retirement segments, but legacy portfolio weighs on complexity | Well-diversified in benefits, retirement, asset management, and protection segments |
| Profitability | Negative net margin (-5.15%) and ROE (-3.3%), value destroying | Positive net margin (9.74%) and ROE (14.17%), strong value creation |
| Innovation | Limited evidence of innovation; stable but unfavorable ROIC trend | Demonstrates durable competitive advantage with rapidly growing ROIC and profitability |
| Global presence | Global insurer with significant operations worldwide, but financial strain impacts stability | Global financial services firm with strong international asset management growth |
| Market Share | Large market share in insurance but challenged by profitability and operational efficiency | Growing market share in retirement and asset management with favorable financial metrics |
Key takeaway: PFG stands out with robust profitability, strong competitive advantages, and efficient capital use, suggesting a favorable investment profile. In contrast, AIG struggles with profitability and value creation despite a broad product portfolio, warranting cautious consideration.
Risk Analysis
Below is a comparison of key risks for American International Group, Inc. (AIG) and Principal Financial Group, Inc. (PFG) based on the most recent data from 2024.
| Metric | American International Group, Inc. (AIG) | Principal Financial Group, Inc. (PFG) |
|---|---|---|
| Market Risk | Moderate (Beta 0.62, stable but affected by insurance sector cycles) | Moderate to High (Beta 0.9, more sensitive to market swings) |
| Debt level | Low (Debt-to-Equity 0.21, Debt-to-Assets 5.53%) | Low (Debt-to-Equity 0.37, Debt-to-Assets 1.31%) |
| Regulatory Risk | Moderate (Insurance regulations in US and global markets) | Moderate (Similar regulatory environment with international exposure) |
| Operational Risk | Moderate (Diverse insurance products, moderate operational complexity) | Moderate (Wide range of retirement and insurance products, operational scale) |
| Environmental Risk | Moderate (Exposure via environmental liability insurance) | Low to Moderate (Less direct exposure, but some risks via investments) |
| Geopolitical Risk | Moderate (International operations subject to political instability) | Moderate (Global markets presence, especially in emerging countries) |
Both companies face moderate market and regulatory risks typical of diversified insurers. AIG’s lower beta suggests slightly less market volatility, while PFG’s higher beta indicates greater sensitivity to economic cycles. Both maintain low debt levels, reducing financial risk. Operational complexity and international exposure introduce moderate environmental and geopolitical risks.
The most impactful risk is market sensitivity for PFG, given its higher beta, and the operational challenges in managing diverse product lines for both. AIG’s Altman Z-score places it in the distress zone, signaling financial vulnerability despite a strong Piotroski score, which suggests internal financial strength. PFG also shows distress in Altman Z but demonstrates very strong financial health per Piotroski, highlighting the need for cautious monitoring of their financial stability.
Which Stock to Choose?
American International Group, Inc. (AIG) shows a mixed income evolution with a 2.46% revenue decline in 2024, but favorable gross and EBIT margins. Its financial ratios are evenly split between favorable and unfavorable, with moderate debt and a B+ rating. Profitability remains challenged with a negative net margin and ROE. The company is value-destroying as ROIC equals zero and below WACC, indicating no excess capital for reinvestment.
Principal Financial Group, Inc. (PFG) has a favorable income evolution marked by 18.02% revenue growth and solid net margin expansion. Most financial ratios are favorable, including low debt and strong interest coverage, supported by a B+ rating. Profitability metrics like ROE and ROIC greatly exceed WACC, signaling value creation and a durable competitive advantage with growing returns on invested capital.
For investors prioritizing stability and durable value creation, PFG’s very favorable rating and consistent income and ratio improvements could appear more attractive. Conversely, AIG’s neutral ratio profile and unfavorable value creation might signal greater caution, potentially suiting investors with a tolerance for mixed financial signals and cyclical recovery. The choice may depend on individual risk tolerance and investment strategy.
Disclaimer: Investment carries a risk of loss of initial capital. The past performance is not a reliable indicator of future results. Be sure to understand risks before making an investment decision.
Go Further
I encourage you to read the complete analyses of American International Group, Inc. and Principal Financial Group, Inc. to enhance your investment decisions: