Berkshire Hathaway Inc. and American International Group, Inc. are two giants in the diversified insurance industry, each with unique approaches to growth and innovation. Berkshire Hathaway stands out with its broad business portfolio beyond insurance, while AIG focuses deeply on specialized insurance products and global markets. Comparing these companies reveals distinct strategies impacting investor value. Join me as we explore which company currently offers the most compelling opportunity for your investment portfolio.

Table of contents
Companies Overview
I will begin the comparison between Berkshire Hathaway Inc. and American International Group, Inc. by providing an overview of these two companies and their main differences.
Berkshire Hathaway Overview
Berkshire Hathaway Inc. operates globally through subsidiaries in insurance, freight rail transportation, and utilities. It offers diverse insurance products, including property, casualty, life, accident, and health coverage. The company also manages extensive railroad systems, generates and distributes electricity from various sources, and engages in manufacturing, retail, and financial services. Headquartered in Omaha, Nebraska, Berkshire Hathaway is a major player in diversified financial services and industrial sectors.
American International Group Overview
American International Group, Inc. provides insurance products and services to commercial, institutional, and individual clients worldwide. Its offerings include general liability, property, auto, and specialty insurance, along with life and retirement products such as annuities and mutual funds. AIG serves its customers through multiple distribution channels, including agents, financial advisors, and brokers. Founded in 1919 and based in New York City, AIG focuses mainly on diversified insurance and related financial planning services.
Key similarities and differences
Both Berkshire Hathaway and AIG operate within the diversified insurance industry, offering a broad range of insurance products. Berkshire Hathaway’s business model is more diversified, encompassing utilities, manufacturing, retail, and transportation alongside insurance, whereas AIG concentrates primarily on insurance and financial services. Additionally, Berkshire Hathaway is significantly larger in market capitalization and employee base, reflecting its broader industrial footprint compared to AIG’s focused insurance operations.
Income Statement Comparison
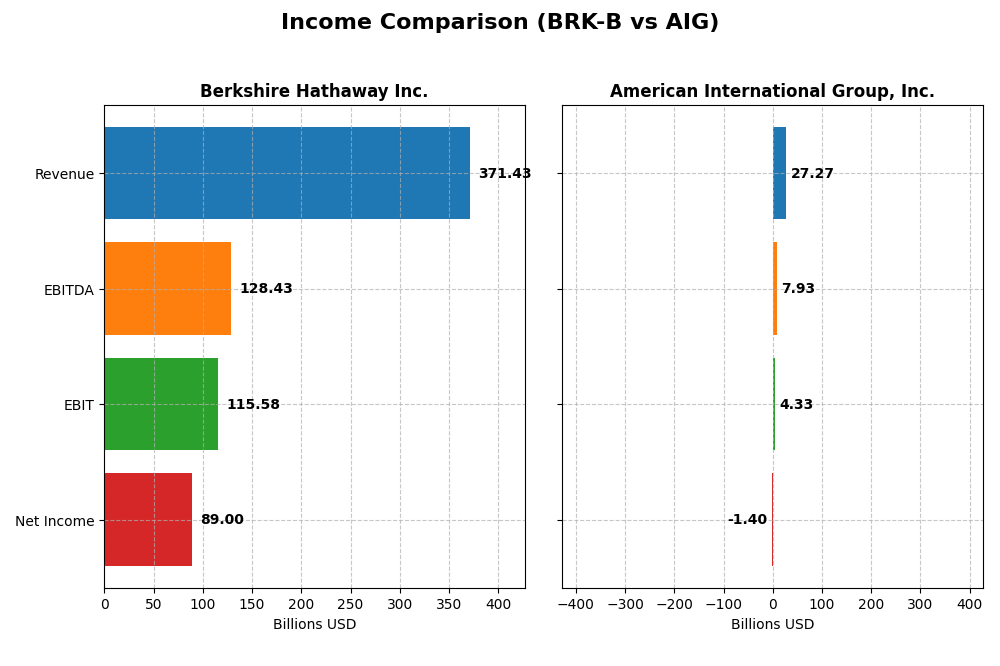
The table below compares key income statement metrics for Berkshire Hathaway Inc. and American International Group, Inc. based on their most recent fiscal year results.
| Metric | Berkshire Hathaway Inc. | American International Group, Inc. |
|---|---|---|
| Market Cap | 1.08T | 40.2B |
| Revenue | 371.4B | 27.3B |
| EBITDA | 128.4B | 7.9B |
| EBIT | 115.6B | 4.3B |
| Net Income | 89.0B | -1.4B |
| EPS | 41.27 | 2.35 |
| Fiscal Year | 2024 | 2024 |
Income Statement Interpretations
Berkshire Hathaway Inc.
Berkshire Hathaway’s revenue showed a positive trend over 2020-2024, growing overall by 29.72%, though it declined by 15.46% in the last year. Net income more than doubled over the period, with a 109.3% increase, despite a slight dip in EPS last year. Margins remain strong, with a 23.96% net margin and a 31.12% EBIT margin, both favorable, indicating solid profitability despite recent revenue contraction.
American International Group, Inc.
AIG’s revenue declined by 37.8% over the 2020-2024 period, with a slight 2.46% drop in the most recent year. Net income grew 76.38% overall but turned negative in 2024, reflecting a net margin of -5.15%. Gross margin and EBIT margin remain favorable at 34.02% and 15.89%, respectively, though recent EPS and net margin growth were unfavorable, highlighting volatility in profitability.
Which one has the stronger fundamentals?
Berkshire Hathaway demonstrates stronger fundamentals with consistent positive net margin and EBIT margin, alongside significant net income growth over the period. AIG, though showing favorable margins, struggles with recent negative net income and revenue declines. Berkshire’s higher proportion of favorable income statement indicators (71.43%) versus AIG’s (57.14%) supports this view based on the data provided.
Financial Ratios Comparison
Below is a comparative overview of key financial ratios for Berkshire Hathaway Inc. and American International Group, Inc. based on their latest fiscal year data.
| Ratios | Berkshire Hathaway Inc. (2024) | American International Group, Inc. (2024) |
|---|---|---|
| ROE | 13.7% | -3.3% |
| ROIC | 4.4% | 0% |
| P/E | 10.98 | -31.43 |
| P/B | 1.51 | 1.04 |
| Current Ratio | 5.94 | 0 |
| Quick Ratio | 5.61 | 0 |
| D/E (Debt-to-Equity) | 0.22 | 0.21 |
| Debt-to-Assets | 12.4% | 5.5% |
| Interest Coverage | 11.43 | 8.37 |
| Asset Turnover | 0.32 | 0.17 |
| Fixed Asset Turnover | 1.62 | 0 |
| Payout Ratio | 0 | -73% |
| Dividend Yield | 0% | 2.32% |
Interpretation of the Ratios
Berkshire Hathaway Inc.
Berkshire Hathaway shows a mix of strong and weak ratios in 2024. Net margin and WACC are favorable, indicating profitability and efficient capital cost management, but ROIC and asset turnover are weak, suggesting challenges in capital efficiency. Its current ratio is unusually high, which may reflect excess liquidity or underutilized assets. Berkshire does not pay dividends, focusing on reinvestment and growth instead.
American International Group, Inc.
AIG’s 2024 ratios reveal significant weaknesses, with negative net margin and ROE, and zero ROIC, highlighting profitability struggles. However, the firm maintains favorable debt metrics and interest coverage, supporting financial stability. AIG pays a dividend with a 2.32% yield, supported by share buybacks and free cash flow coverage, though profitability risks persist due to operating challenges.
Which one has the best ratios?
Berkshire Hathaway’s overall ratio profile is slightly favorable, balancing profitability and capital cost advantages against some inefficiencies. AIG’s ratios are split evenly between favorable and unfavorable, with deeper profitability concerns offset by solid financial structure. Thus, Berkshire Hathaway demonstrates a more balanced and positive ratio outlook compared to AIG’s neutral stance.
Strategic Positioning
This section compares the strategic positioning of Berkshire Hathaway Inc. and American International Group, Inc. regarding market position, key segments, and exposure to technological disruption:
Berkshire Hathaway Inc.
- Large market cap with diversified operations across industries; faces broad competitive pressure.
- Key segments include insurance, energy, freight rail, manufacturing, retail, and services.
- Limited explicit exposure to technological disruption detailed in data.
American International Group, Inc.
- Smaller market cap focused mainly on insurance; faces competitive pressure in insurance markets.
- Key segments are general insurance and life and retirement products.
- No explicit indication of significant exposure to technological disruption in provided data.
Berkshire Hathaway Inc. vs American International Group, Inc. Positioning
Berkshire Hathaway’s strategy is highly diversified across multiple industries, spreading risk and business drivers, while AIG concentrates mainly on insurance. Diversification offers broader revenue streams but may dilute focus, whereas concentration may allow specialization but increase vulnerability to sector-specific risks.
Which has the best competitive advantage?
Based on MOAT evaluation, Berkshire Hathaway shows a very unfavorable moat with declining profitability and value destruction. AIG has an unfavorable moat with stable but insufficient returns. Neither currently demonstrates a strong competitive advantage.
Stock Comparison
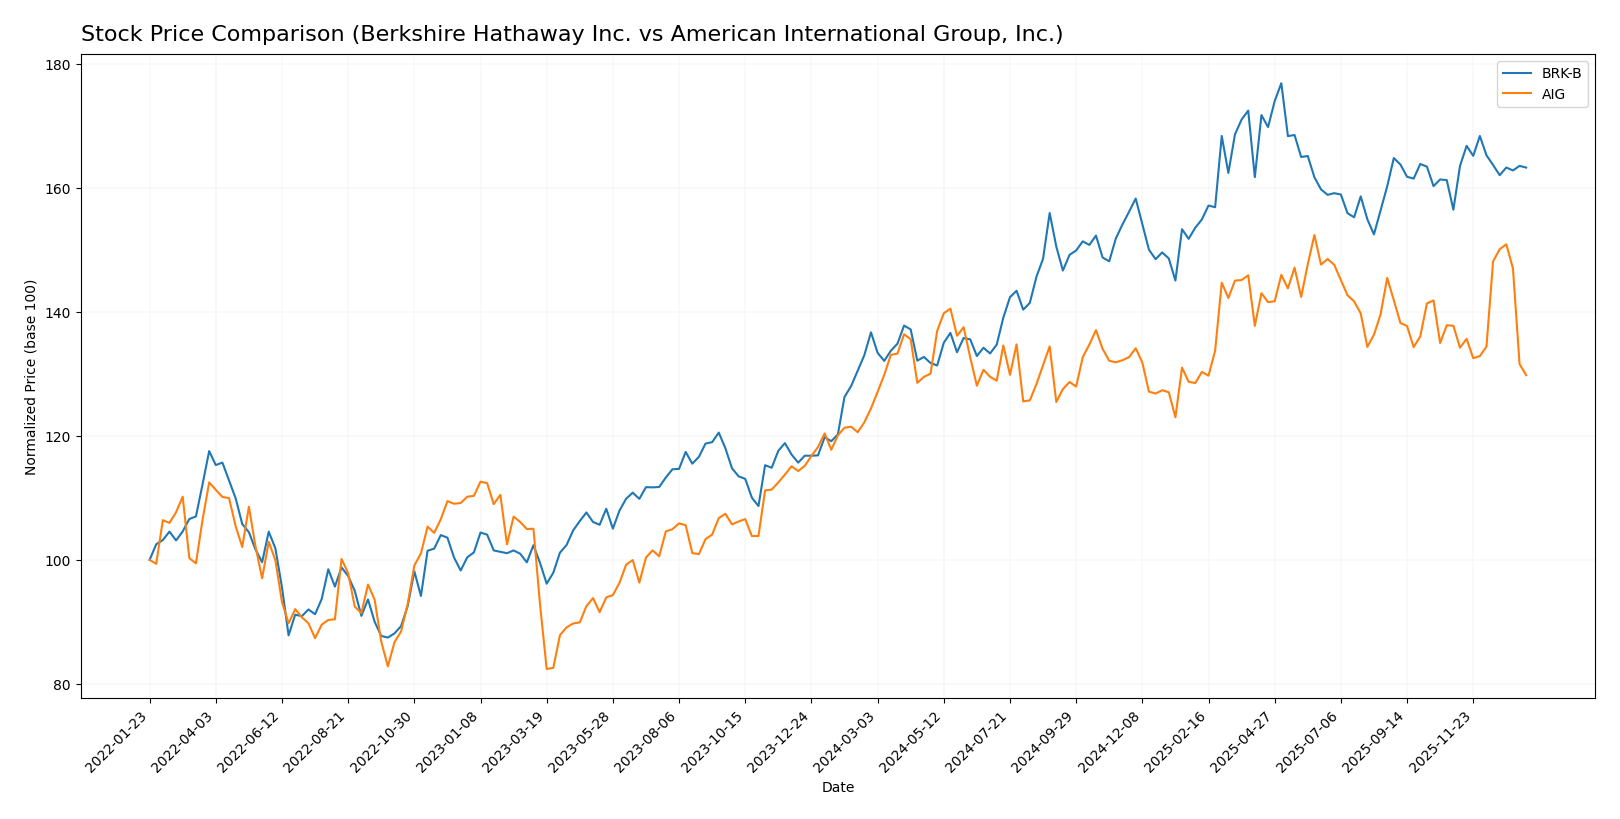
The stock price chart highlights significant bullish trends for both Berkshire Hathaway Inc. and American International Group, Inc. over the past year, with notable price fluctuations and evolving trading volumes shaping their trajectories.
Trend Analysis
Berkshire Hathaway Inc. (BRK-B) experienced a 19.43% price increase over the past 12 months, indicating a bullish trend with deceleration. The stock showed high volatility, ranging from $400.87 to $539.8.
American International Group, Inc. (AIG) recorded a 4.3% price increase over the past year, also bullish with acceleration. Its price fluctuated between $70.5 and $87.34, showing lower volatility than BRK-B.
Comparing both stocks, BRK-B delivered the highest market performance with a 19.43% gain versus AIG’s 4.3%, reflecting stronger price appreciation despite higher volatility.
Target Prices
The consensus target prices from verified analysts indicate moderate upside potential for both companies.
| Company | Target High | Target Low | Consensus |
|---|---|---|---|
| Berkshire Hathaway Inc. | 481 | 450 | 465.5 |
| American International Group, Inc. | 95 | 81 | 86.25 |
Analysts expect Berkshire Hathaway’s stock to trade below its current price of 498.39 USD, suggesting limited upside or potential downside. For AIG, the consensus target of 86.25 USD is notably above its current 74.43 USD, indicating a possible bullish outlook.
Analyst Opinions Comparison
This section compares analysts’ ratings and financial scores for Berkshire Hathaway Inc. and American International Group, Inc.:
Rating Comparison
Berkshire Hathaway Inc. Rating
- Rating: B+, classified as Very Favorable by analysts.
- Discounted Cash Flow Score: 4, indicating a favorable valuation.
- ROE Score: 3, a moderate efficiency in generating shareholder profit.
- ROA Score: 4, showing strong asset utilization.
- Debt To Equity Score: 3, moderate financial risk.
- Overall Score: 3, a moderate overall financial standing.
American International Group, Inc. Rating
- Rating: B+, also classified as Very Favorable by analysts.
- Discounted Cash Flow Score: 4, indicating a favorable valuation.
- ROE Score: 3, a moderate efficiency in generating shareholder profit.
- ROA Score: 3, moderate effectiveness in asset utilization.
- Debt To Equity Score: 3, moderate financial risk.
- Overall Score: 3, a moderate overall financial standing.
Which one is the best rated?
Both companies share the same overall rating of B+ and overall score of 3, indicating moderate financial standing. Berkshire Hathaway shows a slightly stronger asset utilization (ROA score 4 vs. 3), while other scores are equal.
Scores Comparison
Here is a comparison of the Altman Z-Score and Piotroski Score for Berkshire Hathaway Inc. and American International Group, Inc.:
BRK-B Scores
- Altman Z-Score: 3.10, indicating a safe zone with low bankruptcy risk.
- Piotroski Score: 4, representing average financial strength.
AIG Scores
- Altman Z-Score: 0.88, in the distress zone, signaling high bankruptcy risk.
- Piotroski Score: 8, reflecting very strong financial health.
Which company has the best scores?
Based on the scores, Berkshire Hathaway shows stronger bankruptcy safety, while AIG demonstrates much stronger financial health with a higher Piotroski score. Each company excels in a different financial measure.
Grades Comparison
The grades for Berkshire Hathaway Inc. and American International Group, Inc. provided by recognized grading companies are as follows:
Berkshire Hathaway Inc. Grades
The following table summarizes recent grades issued by UBS for Berkshire Hathaway Inc.:
| Grading Company | Action | New Grade | Date |
|---|---|---|---|
| UBS | Maintain | Buy | 2025-11-03 |
| UBS | Maintain | Buy | 2025-10-15 |
| UBS | Maintain | Buy | 2025-08-04 |
| UBS | Maintain | Buy | 2025-07-23 |
| UBS | Maintain | Buy | 2025-06-03 |
| UBS | Maintain | Buy | 2025-04-25 |
| UBS | Maintain | Buy | 2025-02-24 |
| UBS | Maintain | Buy | 2025-01-24 |
| UBS | Maintain | Buy | 2024-11-04 |
| UBS | Maintain | Buy | 2024-02-28 |
Overall, Berkshire Hathaway has consistently received a “Buy” rating from UBS with no changes over the past two years.
American International Group, Inc. Grades
The following table presents recent grades from multiple reputable firms for American International Group, Inc.:
| Grading Company | Action | New Grade | Date |
|---|---|---|---|
| Barclays | Maintain | Equal Weight | 2026-01-08 |
| Keefe, Bruyette & Woods | Maintain | Outperform | 2026-01-06 |
| Piper Sandler | Maintain | Overweight | 2025-12-22 |
| TD Cowen | Maintain | Hold | 2025-12-16 |
| Barclays | Downgrade | Equal Weight | 2025-12-05 |
| Goldman Sachs | Maintain | Neutral | 2025-11-20 |
| Wells Fargo | Maintain | Equal Weight | 2025-11-12 |
| Barclays | Maintain | Overweight | 2025-11-05 |
| JP Morgan | Maintain | Neutral | 2025-10-09 |
| UBS | Maintain | Buy | 2025-10-08 |
American International Group’s ratings show a wider range with some downgrades but generally maintain a neutral to positive stance.
Which company has the best grades?
Berkshire Hathaway Inc. has received consistently positive “Buy” ratings from UBS, while American International Group, Inc. shows more varied opinions ranging from “Hold” to “Outperform”. This consistency may indicate stronger analyst confidence in Berkshire Hathaway, potentially affecting investor sentiment and portfolio stability.
Strengths and Weaknesses
Below is a comparative overview of key strengths and weaknesses for Berkshire Hathaway Inc. (BRK-B) and American International Group, Inc. (AIG) based on recent financial and strategic data.
| Criterion | Berkshire Hathaway Inc. (BRK-B) | American International Group, Inc. (AIG) |
|---|---|---|
| Diversification | Highly diversified across insurance, energy, transportation, manufacturing, retailing | Moderate diversification, primarily insurance with some life & retirement segments |
| Profitability | Strong net margin (23.96%), neutral ROE (13.7%), but unfavorable ROIC (4.37%) below WACC | Negative net margin (-5.15%) and ROE (-3.3%), zero ROIC indicating no value creation |
| Innovation | Traditional industries with stable but limited innovation focus | Insurance sector with ongoing efforts but limited evidence of breakthrough innovation |
| Global presence | Significant global footprint via multiple business units | Strong global insurance presence but less diversified globally |
| Market Share | Leading positions in multiple sectors including insurance and rail transportation | Solid market share in insurance but fragmented and challenged by profitability issues |
Key takeaways: Berkshire Hathaway shows strength in diversification and profitability with some concerns on capital efficiency, while AIG faces challenges in profitability and value creation despite stable global insurance presence. Investors should weigh BRK-B’s broad portfolio against AIG’s focused but currently less profitable position.
Risk Analysis
Below is a comparative table outlining key risk factors for Berkshire Hathaway Inc. and American International Group, Inc. as of 2024.
| Metric | Berkshire Hathaway Inc. (BRK-B) | American International Group, Inc. (AIG) |
|---|---|---|
| Market Risk | Moderate (Beta 0.71) | Moderate (Beta 0.62) |
| Debt level | Low (Debt/Equity 0.22, favorable) | Low (Debt/Equity 0.21, favorable) |
| Regulatory Risk | Moderate (diversified insurance and utilities) | High (complex, global insurance products) |
| Operational Risk | Moderate (diversified operations, complex supply chains) | Moderate (insurance underwriting and claims management) |
| Environmental Risk | Moderate (coal and natural gas assets exposure) | Moderate (subject to climate risk in insurance) |
| Geopolitical Risk | Moderate (North America focus, global operations) | High (international insurance exposure) |
Berkshire Hathaway’s most impactful risks lie in regulatory complexity and environmental exposure due to its energy and industrial businesses. AIG faces higher regulatory and geopolitical risks from its broad international insurance operations. Both have manageable debt levels, but AIG’s Altman Z-score signals financial distress, increasing risk.
Which Stock to Choose?
Berkshire Hathaway Inc. (BRK-B) shows a mixed income evolution with a recent revenue decline of -15.46% but strong long-term net income growth of 109.3%. Its financial ratios are slightly favorable overall, supported by a high net margin of 23.96% and moderate ROE of 13.7%, with low debt levels and a solid B+ rating.
American International Group, Inc. (AIG) exhibits unfavorable recent income trends with a -2.46% revenue decline and negative net margin of -5.15%, though it demonstrates 76.38% net income growth over the long term. Its financial ratios are neutral, featuring moderate debt, a low ROE of -3.3%, and also a B+ rating.
For investors prioritizing financial stability and favorable income statement metrics, Berkshire Hathaway might appear more attractive given its stronger profitability and slightly favorable financial ratios. Conversely, those with tolerance for mixed signals and seeking potential turnaround opportunities could view AIG’s neutral ratios and long-term income growth as noteworthy.
Disclaimer: Investment carries a risk of loss of initial capital. The past performance is not a reliable indicator of future results. Be sure to understand risks before making an investment decision.
Go Further
I encourage you to read the complete analyses of Berkshire Hathaway Inc. and American International Group, Inc. to enhance your investment decisions: