Home > Comparison > Financial Services > AIG vs ACGL
The strategic rivalry between American International Group, Inc. (AIG) and Arch Capital Group Ltd. (ACGL) shapes the competitive landscape of the diversified insurance industry. AIG operates as a large-scale, global insurer offering a broad product mix across commercial and personal lines. In contrast, ACGL emphasizes reinsurance and niche insurance segments with a leaner operational footprint. This analysis aims to identify which business model delivers superior risk-adjusted returns for a balanced investment portfolio.
Table of contents
Companies Overview
American International Group and Arch Capital Group dominate the diversified insurance sector with substantial global footprints.
American International Group, Inc.: Global Insurance Powerhouse
American International Group, Inc. stands as a diversified insurance leader in North America and internationally. It generates revenue through commercial and personal insurance products, including liability, property, and specialty coverages. In 2026, its strategic focus sharpens on expanding life and retirement solutions alongside enhancing crisis management insurance, leveraging a broad distribution network.
Arch Capital Group Ltd.: Reinsurance and Specialty Insurance Specialist
Arch Capital Group Ltd. operates as a global provider of insurance, reinsurance, and mortgage insurance products. Its revenue engine spans primary casualty insurance and diverse reinsurance solutions marketed through independent brokers. The 2026 strategy prioritizes growth in casualty reinsurance and risk management services, solidifying its niche in complex underwriting and global risk transfer.
Strategic Collision: Similarities & Divergences
Both firms embrace diversified insurance models but differ in emphasis: American International Group focuses on broad-market personal and commercial insurance, while Arch targets specialized reinsurance and mortgage segments. Their battleground centers on risk underwriting and global distribution reach. Each presents a distinct investment profile—AIG with scale and product breadth, Arch with underwriting discipline and niche expertise.
Income Statement Comparison
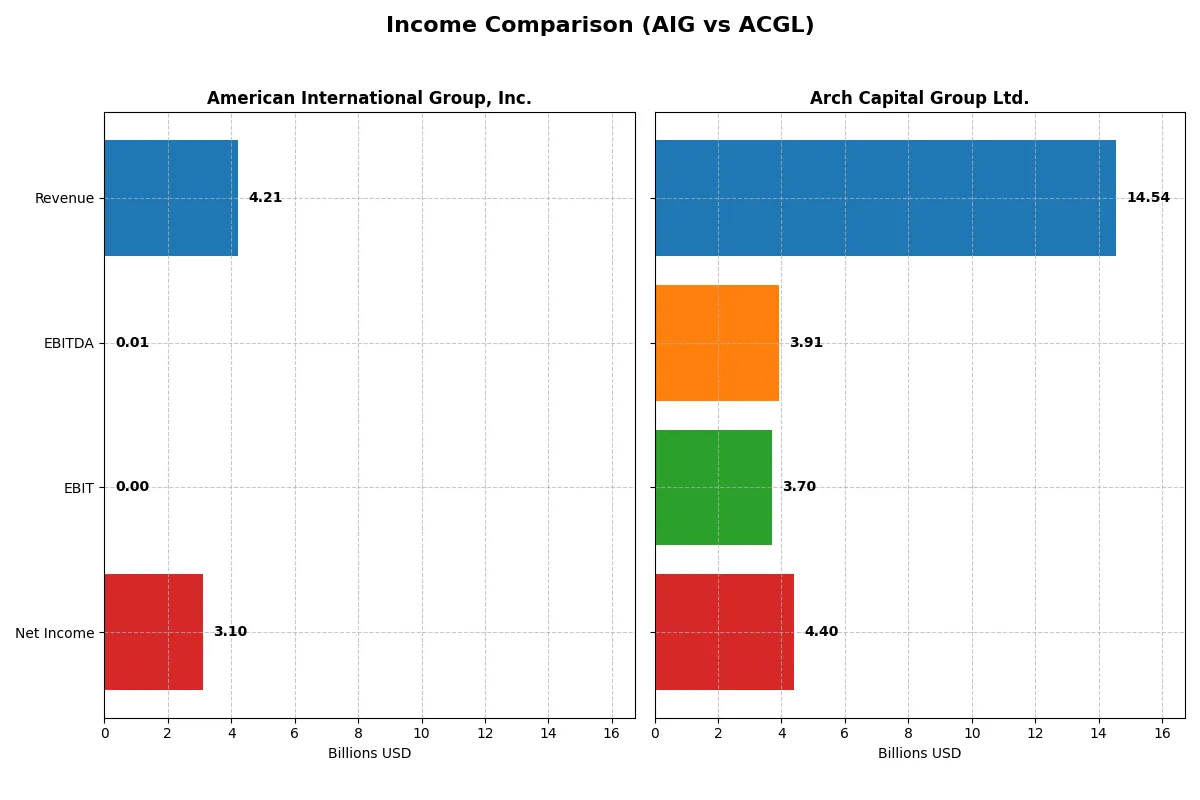
This table dissects the core profitability and scalability of both corporate engines to reveal who dominates the bottom line:
| Metric | American International Group, Inc. (AIG) | Arch Capital Group Ltd. (ACGL) |
|---|---|---|
| Revenue | 4.2B | 14.5B |
| Cost of Revenue | 0 | 9.5B |
| Operating Expenses | 0 | 1.4B |
| Gross Profit | 0 | 5.0B |
| EBITDA | 5.5M | 3.9B |
| EBIT | 0 | 3.7B |
| Interest Expense | 0 | 72M |
| Net Income | 3.1B | 4.4B |
| EPS | 7.09 | 11.84 |
| Fiscal Year | 2025 | 2025 |
Income Statement Analysis: The Bottom-Line Duel
This income statement comparison reveals the true efficiency and profitability of each company’s corporate engine over recent years.
American International Group, Inc. (AIG) Analysis
AIG’s revenue peaked at $52B in 2021 but plunged sharply to $4.2B in 2025, reflecting significant top-line contraction. Despite this, net income rebounded to $3.1B in 2025 after a negative swing in 2024. Margins suffered, with gross profit disappearing by 2025, yet the net margin surged to a robust 73%, signaling strong bottom-line efficiency despite revenue decline.
Arch Capital Group Ltd. (ACGL) Analysis
ACGL steadily grew revenue from $8.9B in 2021 to $14.5B in 2025, although it slipped 14% in the last year. Net income followed suit, reaching $4.4B in 2025. Margins stayed healthy: a 35% gross margin and 30% net margin in 2025 indicate consistent operational control. The company showed solid earnings momentum and margin expansion across the period.
Margin Resilience vs. Revenue Growth
AIG impresses with exceptional net margin resilience amid steep revenue declines, highlighting cost control and bottom-line focus. ACGL displays more balanced growth, expanding both revenue and net income with stable margins. Investors seeking robust earnings quality amid volatility may favor AIG, while those prioritizing growth with consistent profitability might prefer ACGL’s profile.
Financial Ratios Comparison
These vital ratios act as a diagnostic tool to expose the underlying fiscal health, valuation premiums, and capital efficiency of the companies analyzed:
| Ratios | American International Group, Inc. (AIG) | Arch Capital Group Ltd. (ACGL) |
|---|---|---|
| ROE | 7.53% | 20.71% |
| ROIC | 11.10% | N/A |
| P/E | 15.6 | 7.98 |
| P/B | 1.18 | 1.65 |
| Current Ratio | 9.83 | 0 |
| Quick Ratio | 9.83 | 0 |
| D/E (Debt-to-Equity) | 0.22 | 0.13 |
| Debt-to-Assets | 5.60% | 3.85% |
| Interest Coverage | 0 | 31.73 |
| Asset Turnover | 0.03 | 0.24 |
| Fixed Asset Turnover | 0 | 0 |
| Payout ratio | 31.5% | 44.2% |
| Dividend yield | 2.02% | 5.54% |
| Fiscal Year | 2025 | 2025 |
Efficiency & Valuation Duel: The Vital Signs
Financial ratios act as a company’s DNA, exposing hidden risks and operational strength behind headline figures.
American International Group, Inc.
AIG shows a mixed profitability profile with a modest ROE of 7.53% but a strong net margin of 73.45%, reflecting operational efficiency. Its P/E of 15.62 suggests a fairly valued stock. AIG maintains shareholder returns with a 2.02% dividend yield, balancing payouts and reinvestment. However, a high current ratio signals potential liquidity management issues.
Arch Capital Group Ltd.
ACGL reports a favorable net margin of 30.25% but registers zero ROE and ROIC, indicating profitability concerns. Valuation metrics are unavailable or zero, complicating price assessment. The company lacks dividend payouts, implying reliance on growth or internal reinvestment. Strong interest coverage at 51.42 contrasts with absent liquidity ratios, raising caution on financial health.
Balanced Strength vs. Question Mark Efficiency
AIG offers a better blend of profitability and valuation with tangible shareholder returns despite liquidity red flags. ACGL’s favorable margins are overshadowed by absent returns on equity and capital, signaling operational uncertainty. Investors seeking stable income may prefer AIG; those favoring potential growth should weigh ACGL’s risks carefully.
Which one offers the Superior Shareholder Reward?
I observe that American International Group, Inc. (AIG) delivers a 2.02% dividend yield in 2025 with a moderate 31.5% payout ratio, well covered by free cash flow. AIG complements this with steady buybacks, enhancing shareholder returns sustainably. Arch Capital Group Ltd. (ACGL) forgoes dividends, investing heavily in growth and acquisitions, yet its buyback activity is limited. ACGL’s 5.54% dividend yield in 2024 was an outlier, not sustained in 2025. AIG’s balanced distribution and capital allocation offer more consistent, risk-mitigated total returns. I conclude AIG provides superior shareholder reward for 2026 investors.
Comparative Score Analysis: The Strategic Profile
The radar chart reveals the fundamental DNA and trade-offs of both firms, exposing their strategic strengths and vulnerabilities:
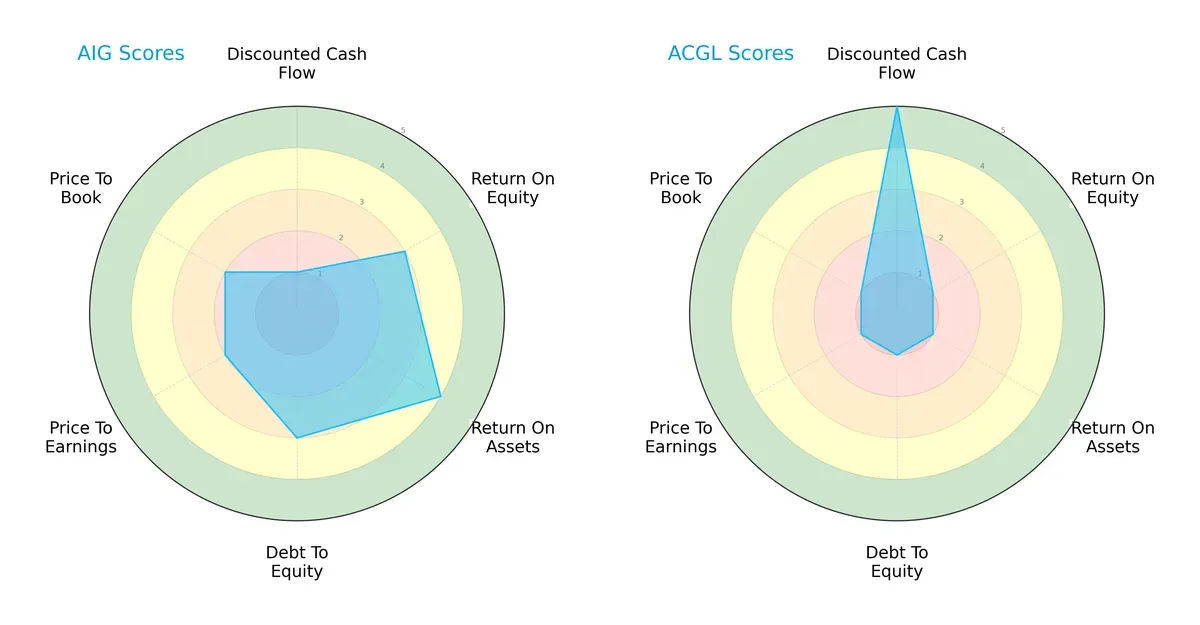
American International Group, Inc. (AIG) shows a balanced profile with moderate to favorable scores in ROE (3) and ROA (4), indicating efficient asset utilization and shareholder returns. Arch Capital Group Ltd. (ACGL) relies heavily on its discounted cash flow strength (score 5) but suffers across profitability and leverage metrics, including ROE (1) and debt-to-equity (1). AIG’s valuation metrics (P/E and P/B scores at 2) are weak but still outperform ACGL’s uniformly low valuations (score 1), suggesting ACGL trades at a more distressed multiple.
—
Bankruptcy Risk: Solvency Showdown
The Altman Z-Score delta reveals both companies hover in the distress zone, implying heightened bankruptcy risks in this cycle:
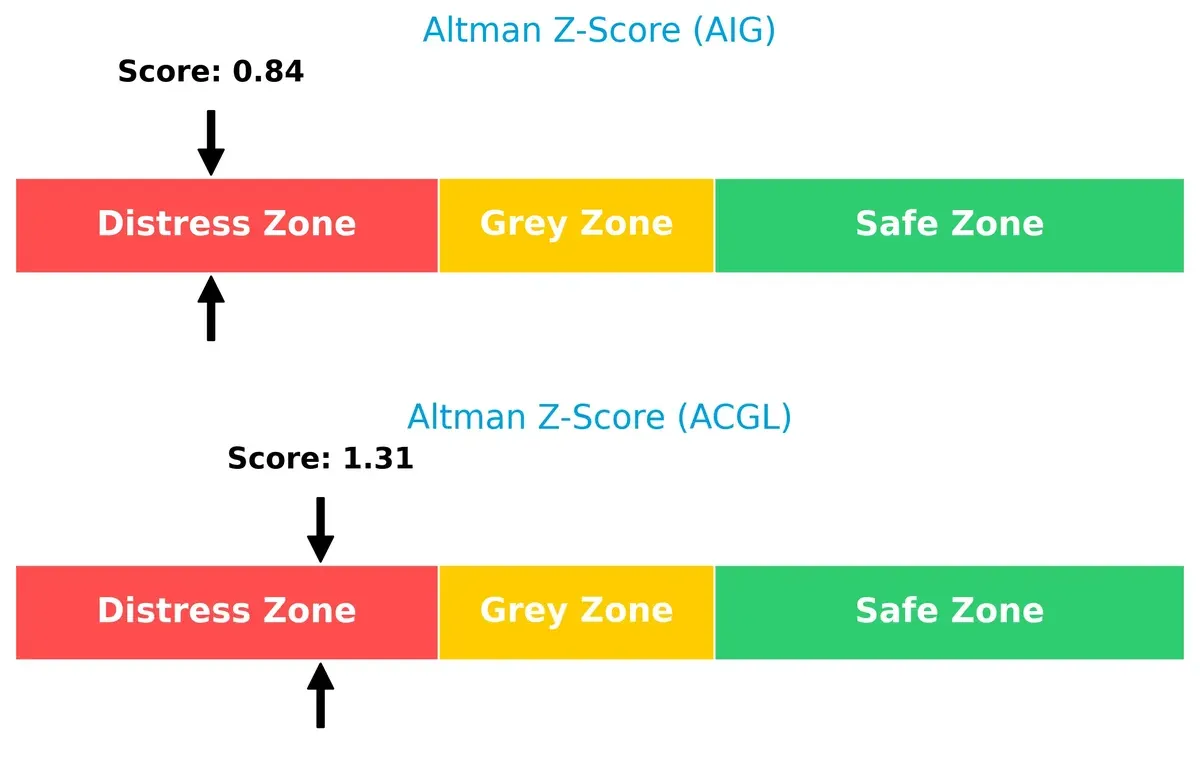
AIG’s Z-score of 0.84 signals significant financial distress, with a higher bankruptcy risk than the safer threshold of 3. ACGL’s score of 1.31, although slightly better, remains well below the grey zone cutoff, reflecting fragile solvency amid market pressures.
—
Financial Health: Quality of Operations
Both firms share a moderate Piotroski F-Score of 5, indicating average operational quality but hidden red flags in internal financial metrics:
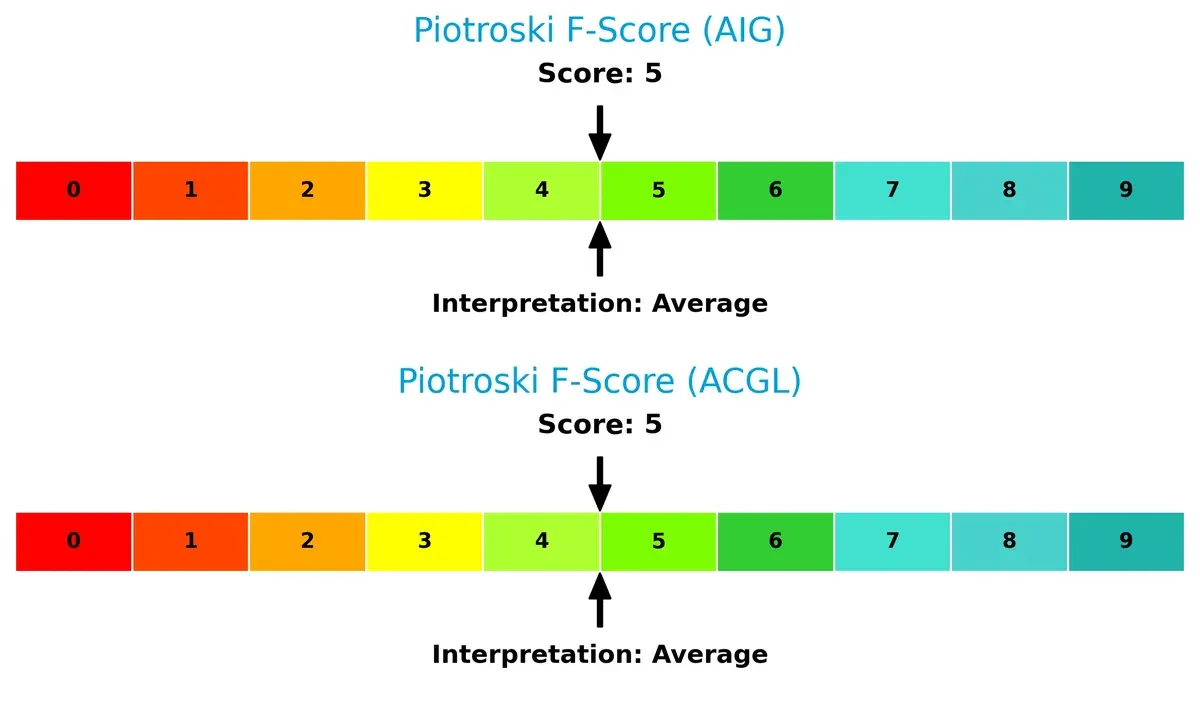
Neither company demonstrates peak financial health. This parity in Piotroski scores suggests both struggle to generate consistent profitability and maintain strong balance sheets, warranting caution for risk-averse investors.
How are the two companies positioned?
This section dissects AIG’s and ACGL’s operational DNA by comparing revenue distribution and internal strengths and weaknesses. The goal is to confront their economic moats and identify which model offers the most resilient, sustainable advantage today.
Revenue Segmentation: The Strategic Mix
This comparison dissects how American International Group, Inc. and Arch Capital Group Ltd. diversify their income streams and reveals their core sector focuses:
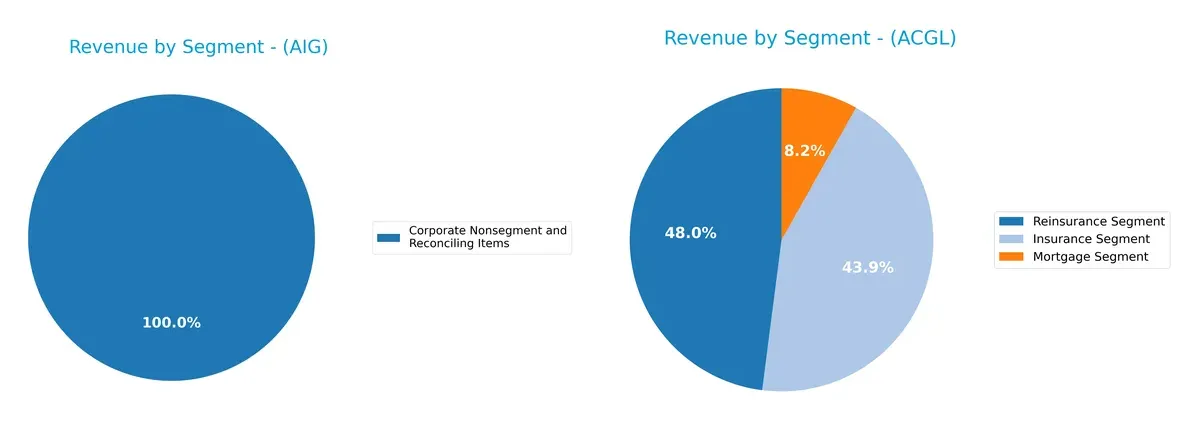
American International Group anchors revenue in its General Insurance Segment with $28.5B (2023), complemented by a $17.7B Life and Retirement division in 2022, showing moderate diversification. Arch Capital Group, by contrast, spreads revenue more evenly across Insurance ($6.6B), Reinsurance ($7.2B), and Mortgage ($1.2B) segments in 2024. AIG’s concentration risks contrast with Arch’s balanced model, which may foster resilience amid sector shifts.
Strengths and Weaknesses Comparison
This table compares the Strengths and Weaknesses of American International Group, Inc. (AIG) and Arch Capital Group Ltd. (ACGL):
AIG Strengths
- Strong net margin at 73.45%
- ROIC exceeds WACC, indicating value creation
- Low debt-to-assets ratio at 5.6%
- High quick ratio at 9.83
- Diversified revenue streams including insurance and retirement segments
- Significant global presence with $14B international revenue
ACGL Strengths
- Favorable net margin at 30.25%
- High interest coverage at 51.42, showing strong debt servicing ability
- Positive price-to-earnings and price-to-book ratios
- Low debt-to-assets ratio
- Diverse segments including insurance, reinsurance, mortgage
- Consistent revenue growth across segments
AIG Weaknesses
- Unfavorable ROE at 7.53%
- Interest coverage at 0, raising solvency concerns
- Low asset and fixed asset turnover ratios
- Unusually high current ratio at 9.83 may indicate inefficient asset use
- Dividend yield at 2.02% limits income appeal
ACGL Weaknesses
- ROE and ROIC reported as zero, indicating inefficiency or data gaps
- Unavailable WACC complicates cost of capital assessment
- Current and quick ratios at zero suggest liquidity risk
- Asset turnover also at zero
- No dividend yield
- Slightly unfavorable overall financial ratio profile
Overall, AIG demonstrates robust profitability and global diversification but faces operational efficiency and liquidity challenges. ACGL shows strong debt management and segment diversification but reveals potential liquidity and profitability weaknesses that could constrain strategic flexibility.
The Moat Duel: Analyzing Competitive Defensibility
A structural moat is the only reliable shield protecting long-term profits from relentless competitive erosion. Let’s dissect the moats of two insurance giants:
American International Group, Inc. (AIG): Expanding Intangible Asset Moat
AIG’s primary moat lies in its extensive brand recognition and diversified global insurance offerings. This manifests in a very favorable ROIC exceeding WACC by 5.3%, signaling efficient capital use and growing profitability. New product innovations and international market penetration in 2026 could further deepen this competitive edge.
Arch Capital Group Ltd. (ACGL): Niche Specialty and Reinsurance Focus
ACGL’s moat centers on specialized underwriting expertise and reinsurance capabilities, contrasting AIG’s scale and brand. Despite a strong net margin (30%) and solid segment diversification, its declining ROIC trend signals pressure on capital efficiency. Growth opportunities in mortgage insurance and casualty reinsurance remain key for future moat reinforcement.
Moat Strength Showdown: Brand Power vs. Niche Expertise
AIG boasts a wider and deeper moat with a sustained, growing ROIC well above its cost of capital. ACGL’s niche focus offers resilience but lacks the capital efficiency momentum of AIG. I conclude AIG is better positioned to defend and expand its market share amid competitive pressures.
Which stock offers better returns?
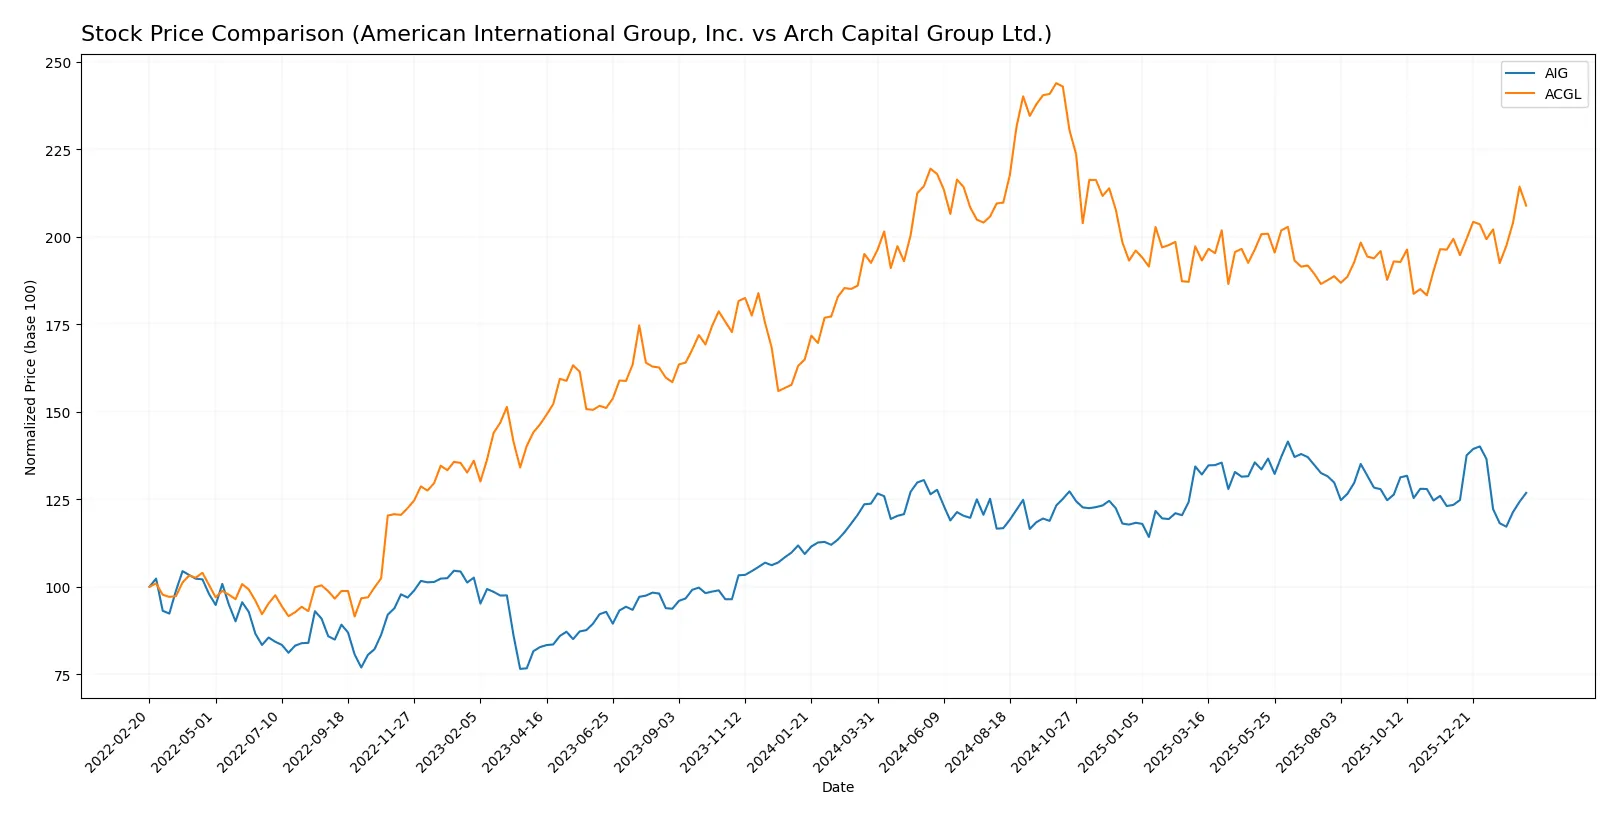
The past year shows clear bullish trends for both stocks, with Arch Capital Group Ltd. gaining momentum and American International Group, Inc. exhibiting a decelerating uptrend.
Trend Comparison
American International Group, Inc. (AIG) rose 2.47% over the last 12 months, showing a bullish but decelerating trend with a 3.97 std deviation and a high at 87.34.
Arch Capital Group Ltd. (ACGL) increased 8.49%, accelerating its bullish momentum with a higher volatility of 6.7 and reaching 114.86 as its peak price.
ACGL outperformed AIG by a wide margin, delivering the stronger and more accelerating market return over the analyzed period.
Target Prices
Analysts show a bullish outlook with clear upside potential across both insurers.
| Company | Target Low | Target High | Consensus |
|---|---|---|---|
| American International Group, Inc. | 77 | 95 | 85.25 |
| Arch Capital Group Ltd. | 93 | 125 | 104.88 |
American International Group trades near $78, with consensus 9% above, signaling moderate upside. Arch Capital Group trades at $98, with targets implying a 7% gain, reflecting solid analyst confidence.

Don’t Let Luck Decide Your Entry Point
Optimize your entry points with our advanced ProRealTime indicators. You’ll get efficient buy signals with precise price targets for maximum performance. Start outperforming now!
How do institutions grade them?
American International Group, Inc. Grades
The following table summarizes recent grades from reputable financial institutions for AIG:
| Grading Company | Action | New Grade | Date |
|---|---|---|---|
| Keefe, Bruyette & Woods | Maintain | Outperform | 2026-02-12 |
| Piper Sandler | Maintain | Overweight | 2026-02-12 |
| Cantor Fitzgerald | Maintain | Neutral | 2026-01-14 |
| Wells Fargo | Maintain | Equal Weight | 2026-01-13 |
| Barclays | Maintain | Equal Weight | 2026-01-08 |
| Keefe, Bruyette & Woods | Maintain | Outperform | 2026-01-06 |
| Piper Sandler | Maintain | Overweight | 2025-12-22 |
| TD Cowen | Maintain | Hold | 2025-12-16 |
| Barclays | Downgrade | Equal Weight | 2025-12-05 |
| Goldman Sachs | Maintain | Neutral | 2025-11-20 |
Arch Capital Group Ltd. Grades
Below are the latest institutional grades for Arch Capital Group Ltd.:
| Grading Company | Action | New Grade | Date |
|---|---|---|---|
| Citigroup | Maintain | Buy | 2026-02-13 |
| Keefe, Bruyette & Woods | Maintain | Market Perform | 2026-02-13 |
| Mizuho | Maintain | Neutral | 2026-02-12 |
| RBC Capital | Maintain | Outperform | 2026-02-11 |
| Wells Fargo | Maintain | Overweight | 2026-02-11 |
| Cantor Fitzgerald | Maintain | Neutral | 2026-01-14 |
| Goldman Sachs | Maintain | Sell | 2026-01-08 |
| Barclays | Maintain | Equal Weight | 2026-01-08 |
| Evercore ISI Group | Maintain | In Line | 2026-01-07 |
| JP Morgan | Maintain | Neutral | 2026-01-07 |
Which company has the best grades?
Arch Capital Group Ltd. has received a broader range of positive grades, including a Buy and Outperform, while AIG’s grades cluster around Neutral to Outperform. Investors might view Arch as favored by more bullish outlooks, potentially impacting demand and price momentum.
Risks specific to each company
The following categories identify critical pressure points and systemic threats facing American International Group, Inc. (AIG) and Arch Capital Group Ltd. (ACGL) in the 2026 market environment:
1. Market & Competition
American International Group, Inc. (AIG)
- Faces intense competition in diversified insurance; legacy scale is an advantage but innovation pace is crucial.
Arch Capital Group Ltd. (ACGL)
- Competes globally with niche focus on reinsurance; smaller scale but specialized underwriting offers differentiation.
2. Capital Structure & Debt
American International Group, Inc. (AIG)
- Maintains low debt-to-equity ratio (0.22) and favorable debt metrics; interest coverage is a red flag at zero.
Arch Capital Group Ltd. (ACGL)
- Virtually no debt reported; very strong interest coverage (51.42) supports financial flexibility.
3. Stock Volatility
American International Group, Inc. (AIG)
- Beta of 0.598 indicates moderate volatility; stock price range suggests relative stability.
Arch Capital Group Ltd. (ACGL)
- Beta of 0.381 shows lower volatility; price fluctuations smaller, implying defensive stock behavior.
4. Regulatory & Legal
American International Group, Inc. (AIG)
- Subject to stringent U.S. insurance regulations; reputational risks from legacy legal exposures remain.
Arch Capital Group Ltd. (ACGL)
- Operates under Bermuda and international regulations; regulatory complexity is elevated but less U.S.-centric.
5. Supply Chain & Operations
American International Group, Inc. (AIG)
- Large global operations with diverse agent networks; operational complexity risks persist.
Arch Capital Group Ltd. (ACGL)
- Smaller workforce with focused broker network; operational risks mitigated by streamlined structure.
6. ESG & Climate Transition
American International Group, Inc. (AIG)
- Increasing pressure to manage climate risk in underwriting; ESG disclosures improving but require vigilance.
Arch Capital Group Ltd. (ACGL)
- ESG initiatives growing; exposure to catastrophe reinsurances links risk to climate volatility.
7. Geopolitical Exposure
American International Group, Inc. (AIG)
- U.S.-centric but with international operations; geopolitical tensions could impact foreign business.
Arch Capital Group Ltd. (ACGL)
- Headquartered in Bermuda with global reach; geopolitical risks include regulatory shifts and currency fluctuations.
Which company shows a better risk-adjusted profile?
AIG’s single most impactful risk is its interest coverage at zero, signaling potential strain servicing debt despite low leverage. ACGL’s biggest risk is its unfavorable return on equity and assets, reflecting operational profitability challenges. Despite these flaws, ACGL’s robust interest coverage and low volatility offer a slightly better risk-adjusted profile. The recent zero interest coverage for AIG stands out as a red flag demanding close investor scrutiny.
Final Verdict: Which stock to choose?
American International Group, Inc. (AIG) excels as a value creator with a proven ability to sustain a growing return on invested capital well above its cost of capital. Its superpower lies in generating consistent economic profits despite sector headwinds. A point of vigilance remains its stretched current ratio, which signals liquidity management challenges. AIG suits investors seeking aggressive growth backed by a durable competitive advantage.
Arch Capital Group Ltd. (ACGL) stands out for its strategic moat in underwriting discipline and strong interest coverage, offering a safer profile than AIG. It delivers steady cash flow yields with disciplined capital allocation, making it attractive for those favoring growth at a reasonable price. However, ACGL’s declining ROIC trend and limited data transparency warrant caution. It fits portfolios prioritizing risk-adjusted stability.
If you prioritize sustainable value creation and are comfortable navigating liquidity nuances, AIG outshines with its robust economic moat and improving profitability. However, if you seek a more conservative play with stronger coverage ratios and less volatility, ACGL offers better stability despite weaker returns on capital. Each name caters to distinct investor profiles balancing growth ambition against risk tolerance.
Disclaimer: Investment carries a risk of loss of initial capital. The past performance is not a reliable indicator of future results. Be sure to understand risks before making an investment decision.
Go Further
I encourage you to read the complete analyses of American International Group, Inc. and Arch Capital Group Ltd. to enhance your investment decisions: