Home > Comparison > Financial Services > V vs AXP
The strategic rivalry between Visa Inc. and American Express Company shapes the competitive landscape of financial credit services. Visa operates a global payments technology network, emphasizing transaction processing at scale. In contrast, American Express blends payment solutions with travel and lifestyle services, focusing on premium customer experiences. This analysis evaluates their distinct operational models to determine which offers a superior risk-adjusted return for diversified portfolios amid evolving sector dynamics.

Table of contents
Companies Overview
Visa Inc. and American Express Company dominate the global credit services market with distinct strategic models.
Visa Inc.: Payment Network Powerhouse
Visa Inc. operates as a payments technology company facilitating digital transactions worldwide. Its core revenue engine is VisaNet, a vast transaction processing network enabling authorization, clearing, and settlement. In 2026, Visa focuses on expanding strategic partnerships, such as its agreement with Ooredoo, to enhance payment experiences and broaden global reach.
American Express Company: Premium Card Services Leader
American Express Company is a premier provider of charge and credit payment card products alongside travel-related services globally. It generates revenue through diversified segments including consumer, commercial, and merchant services. The firm prioritizes customer loyalty programs and fraud prevention in 2026, leveraging its broad service suite to deepen engagement across consumer and corporate clients.
Strategic Collision: Similarities & Divergences
Visa pursues an open, scalable transaction network while American Express adopts a closed-loop, customer-centric model. Their primary battleground lies in cardholder engagement and merchant acceptance. Visa’s expansive reach contrasts with American Express’s premium brand focus, defining distinct risk profiles and growth strategies for investors.
Income Statement Comparison
This data dissects the core profitability and scalability of both corporate engines to reveal who dominates the bottom line:
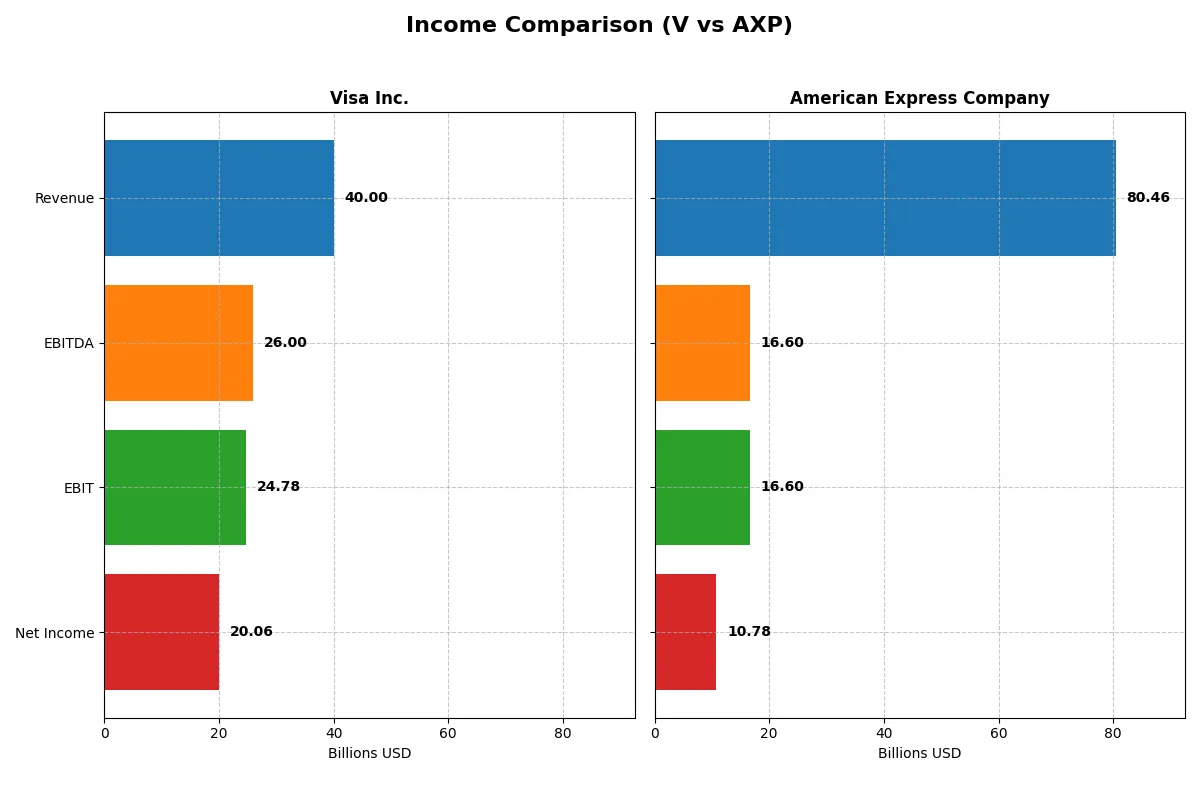
| Metric | Visa Inc. (V) | American Express Company (AXP) |
|---|---|---|
| Revenue | 40B | 80.5B |
| Cost of Revenue | 7.9B | 29.9B |
| Operating Expenses | 8.2B | 34B |
| Gross Profit | 32.1B | 50.6B |
| EBITDA | 26B | 16.6B |
| EBIT | 24.8B | 16.6B |
| Interest Expense | 589M | 2.8B |
| Net Income | 20B | 10.8B |
| EPS | 10.22 | 15.4 |
| Fiscal Year | 2025 | 2025 |
Income Statement Analysis: The Bottom-Line Duel
This income statement comparison reveals the true efficiency and profitability momentum of Visa Inc. and American Express Company.
Visa Inc. Analysis
Visa shows a strong revenue rise from $24.1B in 2021 to $40B in 2025, with net income expanding from $12.3B to nearly $20B. Its gross margin sustains a robust 80.36% in 2025, while net margin holds a healthy 50.14%. Despite a slight net margin decline recently, Visa’s EPS growth of 4.83% signals solid earnings momentum and operational efficiency.
American Express Company Analysis
American Express scaled revenue from $44.4B in 2021 to $80.5B in 2025, but net income grew more modestly from $8.1B to $10.8B. Gross margin stayed favorable at 62.85%, with net margin at 13.39% in 2025. The company improved EBIT by 28.76% last year, reflecting operational gains, though net margin contraction suggests margin pressure amid rising costs.
Margin Power vs. Revenue Scale
Visa leads with superior net and gross margins, delivering higher profitability on each sales dollar. American Express boasts larger top-line growth but struggles to convert revenue into proportionate earnings. For investors prioritizing margin dominance and earnings quality, Visa’s profile appears more attractive than American Express’s scale-focused but margin-challenged performance.
Financial Ratios Comparison
These vital ratios act as a diagnostic tool to expose underlying fiscal health, valuation premiums, and capital efficiency of the companies compared below:
| Ratios | Visa Inc. (V) | American Express Company (AXP) |
|---|---|---|
| ROE | 52.9% | 32.2% |
| ROIC | 28.4% | 4.3% |
| P/E | 33.1 | 23.9 |
| P/B | 17.5 | 7.7 |
| Current Ratio | 1.08 | 79.97 |
| Quick Ratio | 1.08 | 79.97 |
| D/E | 0.66 | 1.73 |
| Debt-to-Assets | 25.3% | 19.2% |
| Interest Coverage | 40.7 | 5.9 |
| Asset Turnover | 0.40 | 0.27 |
| Fixed Asset Turnover | 9.44 | 0 |
| Payout Ratio | 23.1% | 21.1% |
| Dividend Yield | 0.70% | 0.88% |
| Fiscal Year | 2025 | 2025 |
Efficiency & Valuation Duel: The Vital Signs
Financial ratios act as a company’s DNA, exposing hidden risks and operational strengths that raw figures often mask.
Visa Inc.
Visa dominates with a stellar 52.9% ROE and a strong 50.14% net margin, signaling exceptional profitability. However, its P/E of 33.05 and P/B of 17.49 mark the stock as expensive and stretched. Visa returns value modestly through a 0.7% dividend, favoring long-term growth over aggressive payouts.
American Express Company
American Express posts a solid 32.2% ROE and a 13.39% net margin, showing decent profitability but lower efficiency than Visa. Its P/E of 23.86 suggests a fair valuation, though a weak P/B and high debt-to-equity ratio indicate financial leverage concerns. Dividend yield at 0.88% reflects cautious shareholder returns amid growth reinvestment.
Premium Valuation vs. Operational Safety
Visa offers superior profitability and a more favorable risk profile despite its premium valuation. American Express trades cheaper but carries higher leverage and weaker capital returns. Growth-oriented investors may prefer Visa’s efficiency; cautious income seekers might lean toward American Express’s steadier payout.
Which one offers the Superior Shareholder Reward?
Visa Inc. and American Express Company both pay dividends and buy back shares, but their approaches differ. Visa yields about 0.7% with a payout ratio near 23%, supported by strong free cash flow (FCF) coverage above 90%, signaling sustainable dividends. Visa’s buyback activity is consistent but modest relative to its market cap. American Express offers a higher dividend yield around 0.9% to 1.3%, with payout ratios close to 20-21%, also backed by solid FCF coverage near 90-100%. However, Amex deploys more aggressive buybacks relative to its size, leveraging higher financial leverage. I see Visa’s conservative payout and robust margins ensuring durable shareholder rewards. American Express’s higher yield and buybacks offer upside but bring greater balance sheet risk. For 2026, Visa’s balanced distribution philosophy delivers superior long-term total return potential with prudent risk management.
Comparative Score Analysis: The Strategic Profile
The radar chart reveals the fundamental DNA and trade-offs of Visa Inc. and American Express Company, highlighting their financial strengths and valuation nuances:
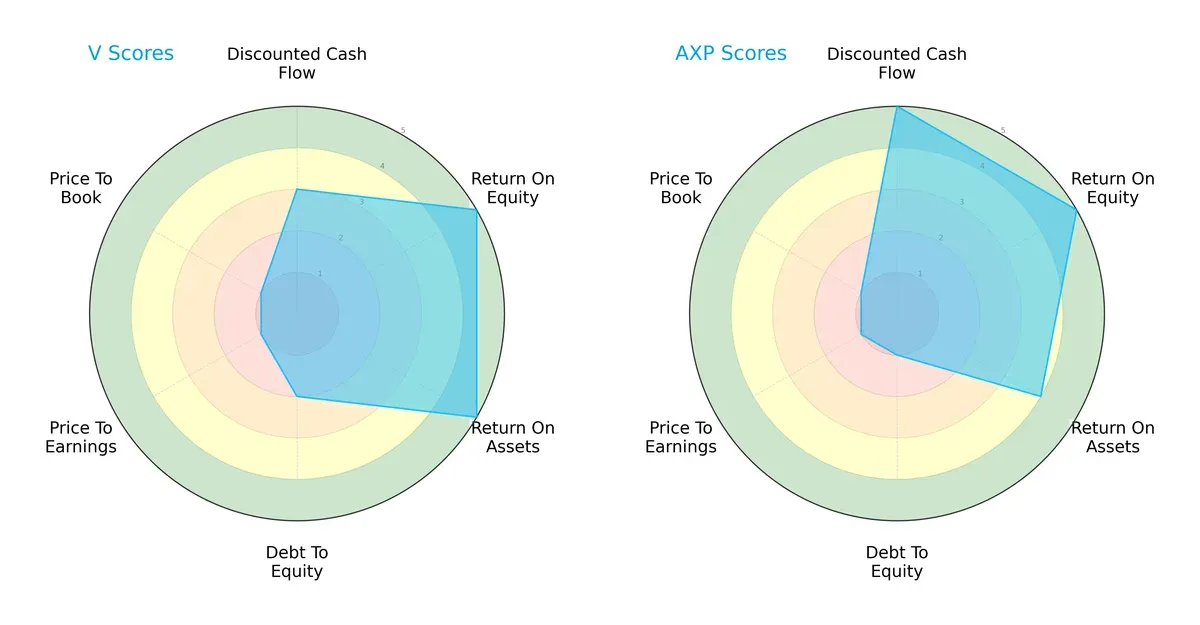
Visa Inc. shows balanced operational efficiency with strong ROE and ROA scores (5 each) but carries higher financial risk with a weaker debt-to-equity score (2). American Express excels in discounted cash flow (5) and maintains a solid return on equity (5) but shows higher leverage risk (debt-to-equity score 1). Both struggle on valuation metrics (P/E and P/B scores at 1), reflecting potential overpricing. Visa’s profile is more balanced operationally, while American Express relies more on cash flow strength.
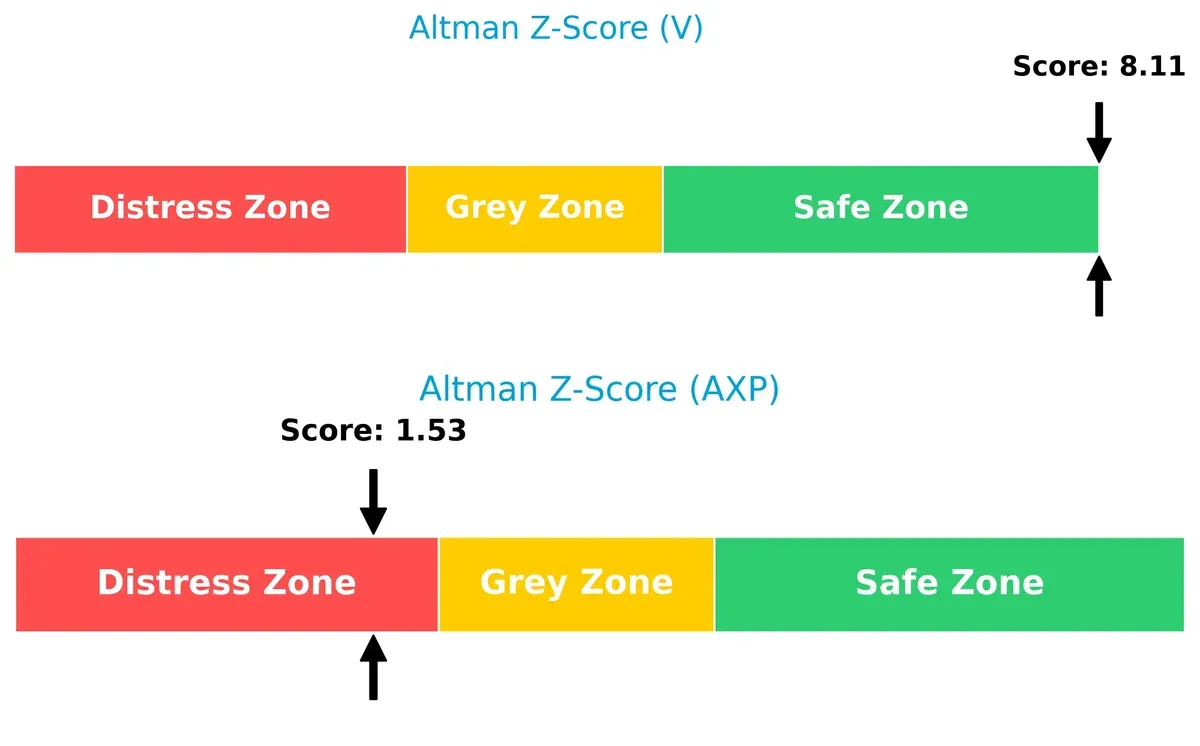
Bankruptcy Risk: Solvency Showdown
Visa’s Altman Z-Score of 8.11 places it securely in the safe zone, indicating strong long-term survival capacity. American Express’s 1.53 score signals distress risk, raising solvency concerns in this cycle:
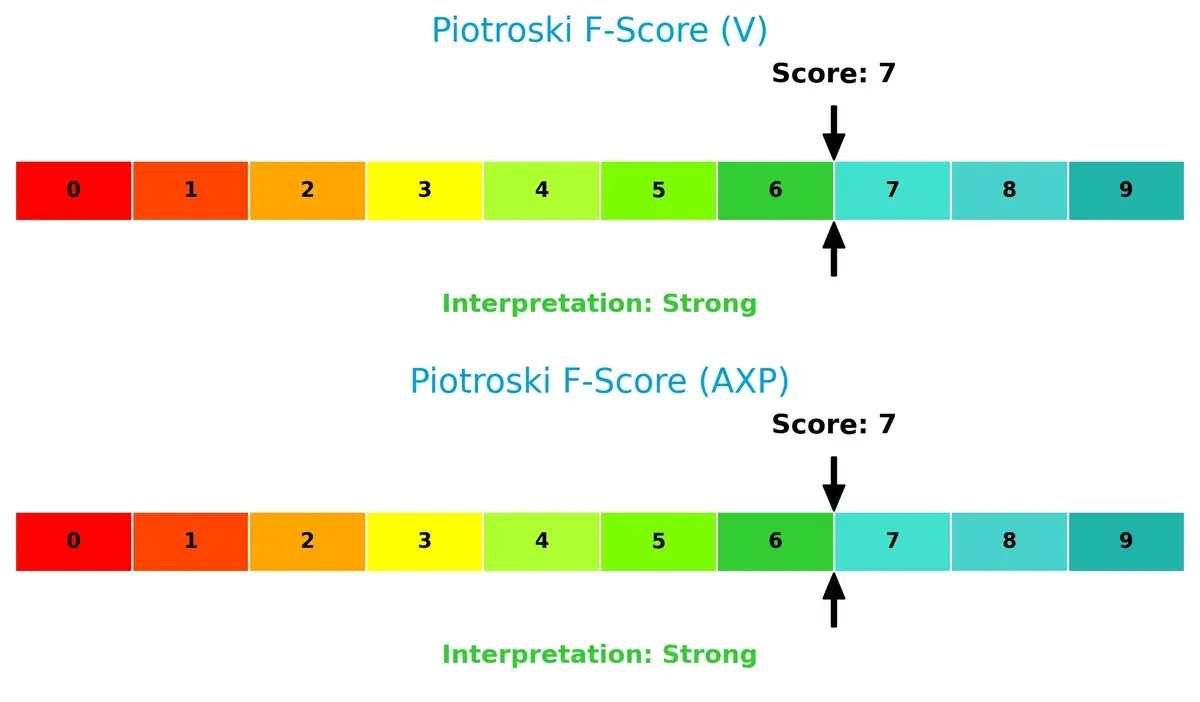
Financial Health: Quality of Operations
Both companies score 7 on the Piotroski F-Score, reflecting strong internal financial health. Neither shows alarming red flags, suggesting robust profitability and operational quality:
How are the two companies positioned?
This section dissects Visa and American Express’s operational DNA by comparing their revenue distribution and internal strengths and weaknesses. The goal is to confront their economic moats and identify which model offers the most resilient, sustainable competitive advantage today.
Revenue Segmentation: The Strategic Mix
This visual comparison dissects how Visa Inc. and American Express Company diversify their income streams and where their primary sector bets lie:
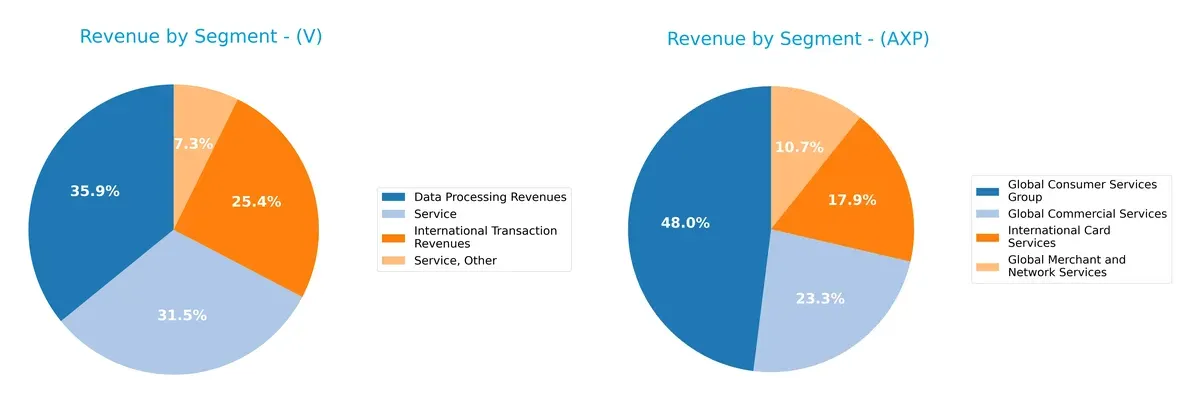
Visa anchors its revenue in Data Processing ($20B) and Service ($17.5B), showing a focused approach on transaction infrastructure. American Express pivots on Global Consumer Services ($35B), with notable contributions from International Card Services ($13B) and Commercial Services ($17B), highlighting a broader portfolio. Visa’s concentrated segments suggest efficiency in scale but raise concentration risk. American Express’s diversified model spreads risk and leverages ecosystem lock-in through its broad service suite.
Strengths and Weaknesses Comparison
This table compares the Strengths and Weaknesses of Visa Inc. and American Express Company:
Visa Inc. Strengths
- High net margin of 50% and ROE above 50%
- Favorable ROIC at 28% exceeding WACC
- Strong international revenues of 24B
- Diverse service revenues exceeding 17B
- Favorable interest coverage ratio at 42x
- Balanced debt to assets at 25% with low leverage
American Express Strengths
- Positive net margin at 13% and strong ROE of 32%
- Favorable interest coverage at nearly 6x
- Significant U.S. revenues at 56B with global commercial services of 17B
- Favorable quick ratio despite weak current ratio
- Favorable debt to assets at 19%
- Established global consumer services with 35B revenue
Visa Inc. Weaknesses
- Unfavorable high P/E of 33 and P/B at 17.5 indicating expensive valuation
- Asset turnover low at 0.4 despite fixed asset efficiency
- Dividend yield low at 0.7%
- Current ratio only neutral at 1.08
- Moderate debt-to-equity ratio at 0.66
American Express Weaknesses
- Low ROIC at 4.35% below WACC of 8.1%
- Unfavorable P/B at 7.7 and very high current ratio of 80 indicating liquidity concerns
- Debt-to-equity high at 1.73
- Fixed asset turnover at zero signals weak asset utilization
- Dividend yield low at 0.88%
Visa demonstrates superior profitability and international diversification supported by strong capital efficiency. American Express shows strength in U.S. market dominance and solid interest coverage but faces challenges in capital returns and asset utilization. Both companies balance global presence with distinct financial profiles, influencing their strategic positioning.
The Moat Duel: Analyzing Competitive Defensibility
A structural moat protects long-term profits from relentless competition erosion. Only a sustainable advantage secures lasting market power:
Visa Inc.: Network Effects Powerhouse
Visa’s moat stems from powerful network effects, linking millions of merchants and consumers globally. Its 62%+ EBIT margin signals margin durability. Expansion into emerging markets should deepen this moat in 2026.
American Express Company: Brand and Loyalty Moat
AmEx leverages a strong brand and customer loyalty, contrasting Visa’s network scale. Its narrower margin profile and declining ROIC suggest vulnerability. Yet, targeted premium offerings could boost defenses if executed well.
Network Effects vs. Brand Loyalty: The Moat Showdown
Visa’s robust ROIC 21% above WACC reflects a wider, more sustainable moat than AmEx’s value-destroying profile. Visa stands better equipped to defend and grow its market share through scale and innovation.
Which stock offers better returns?
Over the past 12 months, Visa Inc. and American Express Company showed strong upward price movements with decelerating momentum and shifting buyer-seller dynamics in recent weeks.
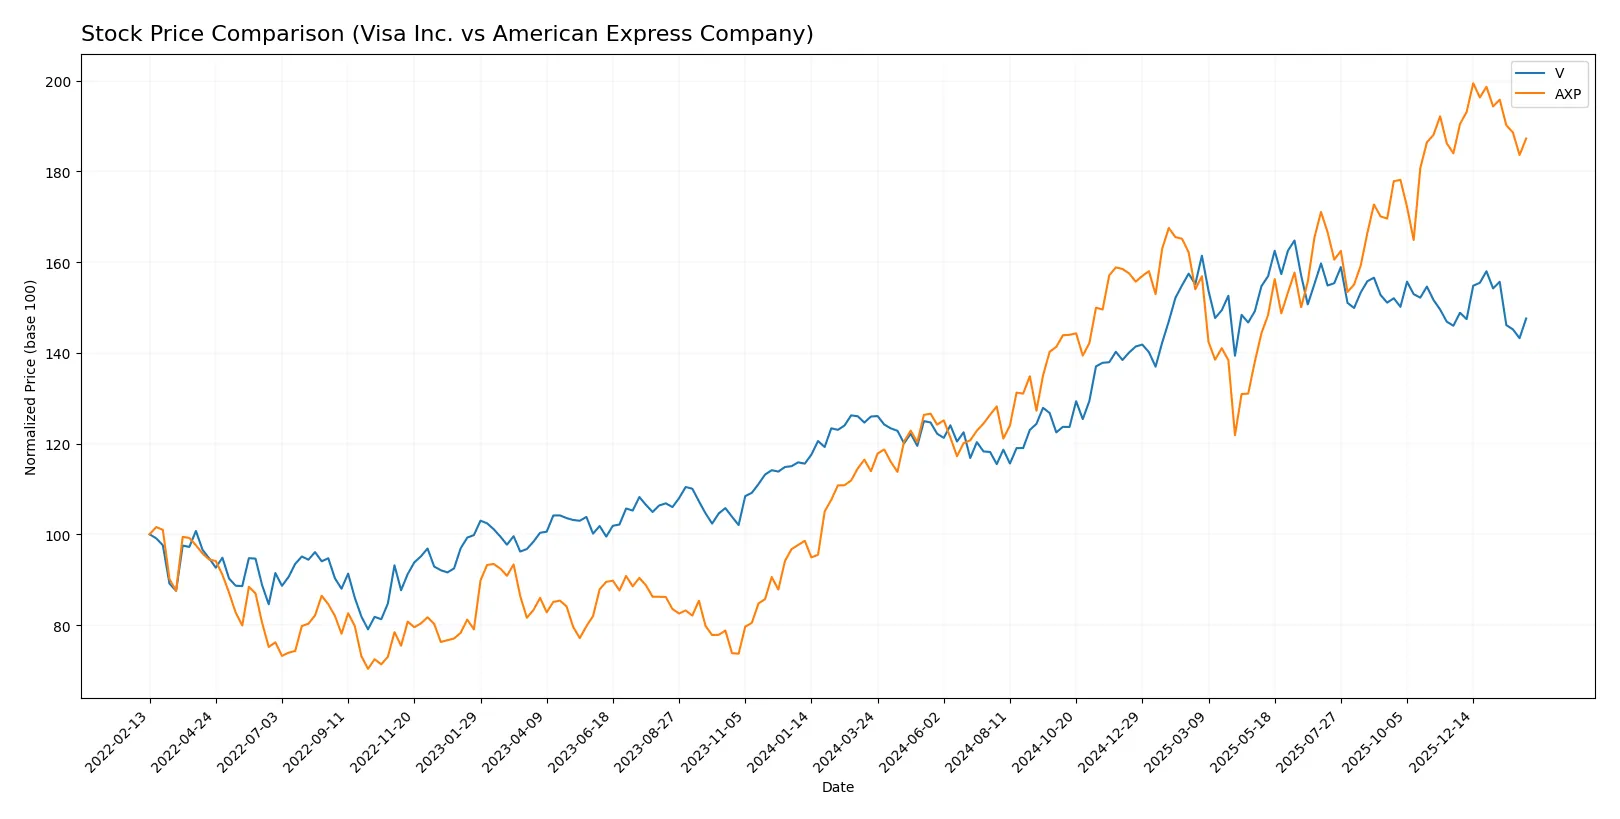
Trend Comparison
Visa Inc. posted a 17.15% price gain over the past year, confirming a bullish trend with decelerating acceleration and a high volatility level (32.8 std deviation). The stock peaked at 370.22 and bottomed at 259.46.
American Express Company outperformed with a 64.4% increase over the same period, also bullish yet decelerating. Its volatility was higher at 45.81, with a highest price of 382.56 and lowest of 218.2.
Comparing both, American Express delivered the strongest market performance, gaining nearly four times Visa’s percentage increase over the last 12 months.
Target Prices
Analysts present a broad but optimistic target consensus for Visa Inc. and American Express Company.
| Company | Target Low | Target High | Consensus |
|---|---|---|---|
| Visa Inc. | 160 | 425 | 378 |
| American Express Company | 295 | 425 | 375.17 |
The consensus targets for both companies exceed current prices, signaling analyst confidence in their growth potential despite market volatility. Visa’s price at 332 and American Express at 359 remain below their median targets, suggesting room for appreciation.

Don’t Let Luck Decide Your Entry Point
Optimize your entry points with our advanced ProRealTime indicators. You’ll get efficient buy signals with precise price targets for maximum performance. Start outperforming now!
How do institutions grade them?
Visa Inc. Grades
The following table summarizes recent grades for Visa Inc. from leading grading companies:
| Grading Company | Action | New Grade | Date |
|---|---|---|---|
| Cantor Fitzgerald | Maintain | Overweight | 2026-01-30 |
| RBC Capital | Maintain | Outperform | 2026-01-30 |
| Macquarie | Maintain | Outperform | 2026-01-30 |
| Morgan Stanley | Maintain | Overweight | 2026-01-30 |
| B of A Securities | Upgrade | Buy | 2025-12-11 |
| HSBC | Upgrade | Buy | 2025-12-08 |
| Raymond James | Maintain | Outperform | 2025-10-29 |
| UBS | Maintain | Buy | 2025-10-29 |
| Baird | Maintain | Outperform | 2025-10-06 |
American Express Company Grades
Recent institutional grades for American Express Company are detailed below:
| Grading Company | Action | New Grade | Date |
|---|---|---|---|
| Truist Securities | Maintain | Buy | 2026-02-02 |
| JP Morgan | Maintain | Neutral | 2026-02-02 |
| BTIG | Maintain | Sell | 2026-02-02 |
| TD Cowen | Maintain | Hold | 2026-01-08 |
| Barclays | Maintain | Equal Weight | 2026-01-06 |
| Wells Fargo | Maintain | Overweight | 2025-12-17 |
| Freedom Capital Markets | Upgrade | Hold | 2025-10-24 |
Which company has the best grades?
Visa Inc. consistently earns higher grades such as Buy and Outperform across more firms than American Express, which shows mixed ratings including Sell and Neutral. This suggests Visa currently holds stronger institutional confidence, potentially influencing investor sentiment positively.
Risks specific to each company
The following categories identify the critical pressure points and systemic threats facing both firms in the 2026 market environment:
1. Market & Competition
Visa Inc.
- Dominates global digital payments with strong network effects but faces intense competition from fintech disruptors.
American Express Company
- Focuses on premium charge and credit cards, vulnerable to shifts in consumer spending and competitive pressure from large and niche players.
2. Capital Structure & Debt
Visa Inc.
- Maintains a moderate debt-to-equity ratio of 0.66, signaling balanced leverage and strong interest coverage at 42x.
American Express Company
- Exhibits high leverage with a debt-to-equity ratio of 1.73 and lower interest coverage near 6x, raising financial risk concerns.
3. Stock Volatility
Visa Inc.
- Beta of 0.78 indicates lower volatility than the market, supporting stability in turbulent cycles.
American Express Company
- Beta of 1.13 suggests higher sensitivity to market swings, increasing risk for volatility-averse investors.
4. Regulatory & Legal
Visa Inc.
- Faces scrutiny over data privacy and anti-trust issues globally, requiring ongoing compliance vigilance.
American Express Company
- Subject to regulatory risks in credit and payment services, with additional exposure from international operations.
5. Supply Chain & Operations
Visa Inc.
- Operates VisaNet, a robust transaction network with high fixed asset turnover, minimizing operational disruptions.
American Express Company
- Relies heavily on merchant services and travel-related products, sensitive to operational hiccups and market disruptions.
6. ESG & Climate Transition
Visa Inc.
- Demonstrates progressive ESG initiatives aligned with global standards, lowering transition risks.
American Express Company
- Increasing focus on sustainability, but slower integration of climate risks into core business could pose future challenges.
7. Geopolitical Exposure
Visa Inc.
- Global footprint exposes it to geopolitical tensions and currency fluctuations, especially in emerging markets.
American Express Company
- Also exposed globally, but with more concentrated business segments, heightening vulnerability to regional geopolitical shifts.
Which company shows a better risk-adjusted profile?
Visa’s strongest risk lies in intensified competition from fintech disruptors, while American Express faces significant financial risk from its elevated leverage. Visa’s safe-zone Altman Z-score and lower beta indicate a more resilient risk-adjusted profile. The stark contrast in debt-to-equity ratios and interest coverage underscores my concern over American Express’s financial vulnerability amid rising interest rates.
Final Verdict: Which stock to choose?
Visa Inc. shines as a cash-generating powerhouse with an exceptional ability to convert invested capital into robust returns. Its main point of vigilance lies in its premium valuation, which could temper near-term upside. Visa suits portfolios seeking aggressive growth fueled by durable competitive advantages.
American Express Company boasts a strategic moat rooted in its recurring revenue model and brand loyalty. It offers relatively greater safety due to lower valuation multiples and steady income quality. American Express fits well in GARP portfolios aiming for balanced growth with moderate risk.
If you prioritize sustainable value creation and superior capital efficiency, Visa outshines American Express with its strong and growing ROIC well above WACC. However, if you seek growth at a reasonable price with a focus on recurring revenue stability, American Express offers better stability despite its weaker moat and financial leverage concerns.
Disclaimer: Investment carries a risk of loss of initial capital. The past performance is not a reliable indicator of future results. Be sure to understand risks before making an investment decision.
Go Further
I encourage you to read the complete analyses of Visa Inc. and American Express Company to enhance your investment decisions: