Home > Comparison > Financial Services > AXP vs SYF
The strategic rivalry between American Express Company and Synchrony Financial shapes the competitive landscape of financial credit services. American Express operates as a diversified, global payment network with premium travel and loyalty services. Synchrony Financial focuses on consumer financing through private label and co-branded credit products tied to retail partners. This analysis will evaluate which model better balances growth and risk, offering superior risk-adjusted returns for a diversified portfolio in financial services.

Table of contents
Companies Overview
American Express and Synchrony Financial stand as key players in the U.S. credit services market. Both wield significant influence but differ in scale and operational scope.
American Express Company: Global Payment Powerhouse
American Express dominates the high-end payments sector with its charge and credit card products globally. It generates revenue through cardholder fees, merchant services, and travel-related offerings. In 2026, AmEx emphasizes expanding its merchant network and enhancing customer loyalty programs to deepen its competitive moat.
Synchrony Financial: Consumer Credit Specialist
Synchrony Financial focuses on consumer credit products across retail and healthcare sectors in the U.S. Its revenue primarily comes from private label credit cards and installment loans. In 2026, Synchrony targets growth via digital channels and sector-specific financing solutions, aiming to diversify beyond traditional retail credit.
Strategic Collision: Similarities & Divergences
American Express leverages a closed ecosystem with premium branding, while Synchrony embraces an open platform integrating with diverse retailers. Their battleground centers on consumer credit innovation and market penetration. American Express offers a broader global reach and brand strength; Synchrony presents a nimble, focused investment profile with distinct growth drivers.
Income Statement Comparison
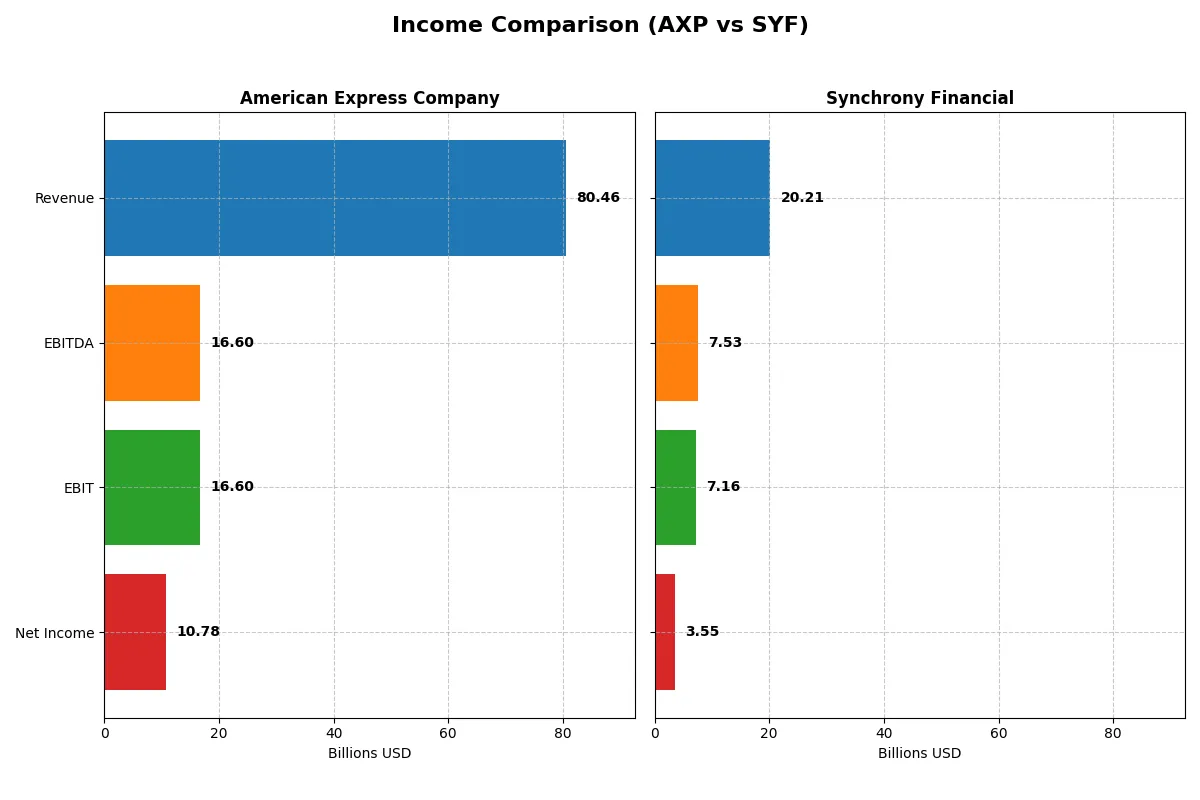
This data dissects the core profitability and scalability of both corporate engines to reveal who dominates the bottom line in their latest fiscal year:
| Metric | American Express Company (AXP) | Synchrony Financial (SYF) |
|---|---|---|
| Revenue | 80.5B | 20.2B |
| Cost of Revenue | 29.9B | 7.9B |
| Operating Expenses | 33.9B | 5.1B |
| Gross Profit | 50.6B | 12.3B |
| EBITDA | 16.6B | 7.5B |
| EBIT | 16.6B | 7.2B |
| Interest Expense | 2.8B | 4.1B |
| Net Income | 10.8B | 3.5B |
| EPS | 15.4 | 9.35 |
| Fiscal Year | 2025 | 2025 |
Income Statement Analysis: The Bottom-Line Duel
This income statement comparison reveals which company converts revenue into profit most efficiently through recent market cycles.
American Express Company Analysis
American Express grew revenue steadily from 44B in 2021 to 80B in 2025, lifting net income from 7.9B to 10.8B. Its gross margin remains strong at 62.85%, though slightly contracted recently. The net margin at 13.4% is healthy and reflects improved operating efficiency, supported by a 28.8% jump in EBIT in 2025, signaling robust momentum.
Synchrony Financial Analysis
Synchrony’s revenue climbed from 11.2B in 2021 to a peak of 20.8B in 2024, then dipped 2.6% in 2025 to 20.2B. Net income fell overall from 4.2B to 3.5B, despite a strong 30.9% gross profit rise in 2025. The net margin of 17.6% is higher than American Express’s but hampered by a steep 20.5% interest expense ratio, which weighs on profitability.
Margin Strength vs. Revenue Growth
American Express leads with consistent revenue and net income growth, paired with stable margins and controlled interest costs. Synchrony shows impressive efficiency with a higher net margin but suffers from volatile revenue and a heavy interest burden. For investors, American Express’s profile offers steadier profit expansion, while Synchrony demands caution due to margin pressure from financing costs.
Financial Ratios Comparison
These vital ratios act as a diagnostic tool to expose the underlying fiscal health, valuation premiums, and capital efficiency of the companies compared below:
| Ratios | American Express Company (AXP) | Synchrony Financial (SYF) |
|---|---|---|
| ROE | 32.19% | 21.19% |
| ROIC | 4.35% | -91.64% |
| P/E | 23.86 | 8.41 |
| P/B | 7.68 | 1.78 |
| Current Ratio | 79.97 | 0 |
| Quick Ratio | 79.97 | 0 |
| D/E | 1.73 | 0.91 |
| Debt-to-Assets | 19.25% | 12.75% |
| Interest Coverage | 5.91 | 1.73 |
| Asset Turnover | 0.27 | 0.17 |
| Fixed Asset Turnover | 0 | 0 |
| Payout ratio | 21.08% | 11.59% |
| Dividend yield | 0.88% | 1.38% |
| Fiscal Year | 2025 | 2025 |
Efficiency & Valuation Duel: The Vital Signs
Financial ratios serve as a company’s DNA, revealing hidden risks and operational strengths essential for investment decisions.
American Express Company
American Express shows robust profitability with a 32.2% ROE and a healthy 13.4% net margin. Its P/E ratio at 23.9 suggests a fairly valued stock. The company’s high dividend yield of 0.88% signals moderate shareholder returns, balancing income with reinvestment in stable operations amid some unfavorable capital efficiency metrics.
Synchrony Financial
Synchrony delivers a solid 17.6% net margin and 21.2% ROE, reflecting efficient profit generation. Its low P/E of 8.4 marks the stock as attractively valued. While dividends yield 1.38%, lower interest coverage and negative ROIC highlight financial risks. Shareholder value leans on steady dividends amid operational challenges.
Balanced Profitability Meets Valuation Trade-Offs
American Express offers higher profitability and a balanced valuation but faces efficiency headwinds. Synchrony’s cheaper valuation and dividend appeal contrast with elevated financial risks. Investors prioritizing income may favor Synchrony, while those seeking operational strength might lean toward American Express.
Which one offers the Superior Shareholder Reward?
I compare American Express Company (AXP) and Synchrony Financial (SYF) on dividends, buybacks, and distribution sustainability. AXP yields 0.88% with a 21% payout ratio, strongly covered by free cash flow at 100%. SYF pays a higher 1.38% yield at a modest 12% payout, signaling conservative cash returns. Buybacks differ markedly: AXP’s robust cash flows suggest substantial share repurchases, while SYF’s free cash flow is less clear, indicating limited buyback capacity. Historically, AXP’s distribution combines reliable dividends and aggressive buybacks, sustaining long-term shareholder value. SYF prioritizes dividend growth with restrained payouts and reinvestment in operations. I conclude AXP offers a superior total return profile in 2026 due to its balanced, sustainable distribution and strong capital allocation discipline.
Comparative Score Analysis: The Strategic Profile
The radar chart reveals the fundamental DNA and trade-offs of American Express and Synchrony Financial, highlighting their financial strengths and valuation contrasts:
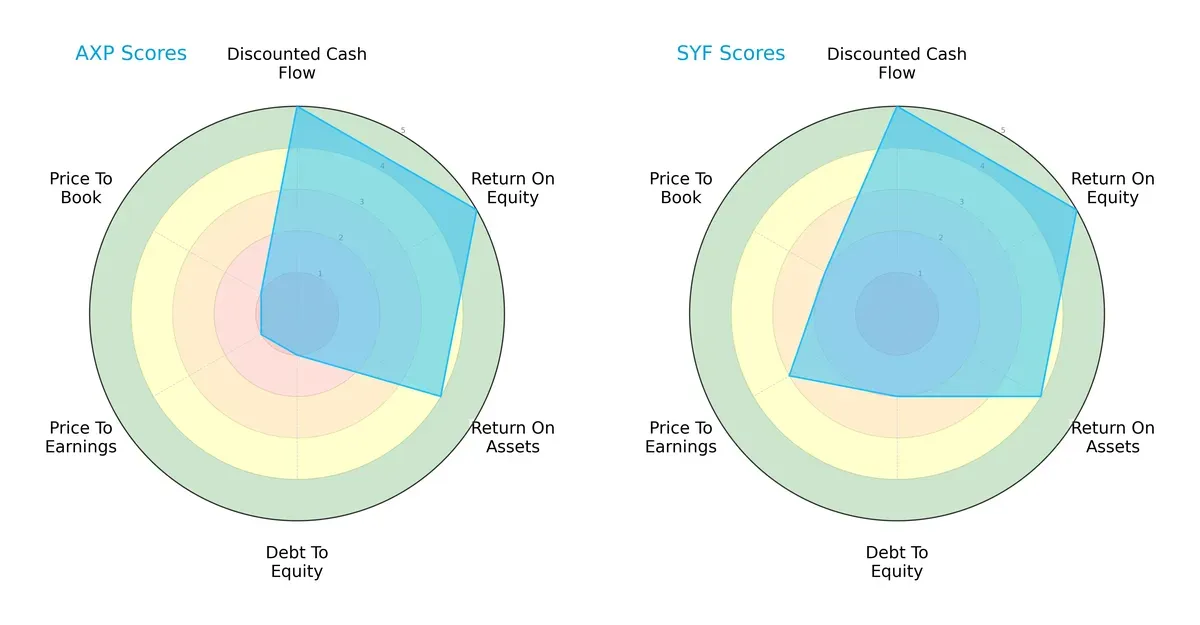
Both firms excel in discounted cash flow, return on equity, and return on assets, demonstrating strong profit generation and asset efficiency. Synchrony Financial holds a more balanced profile with moderate scores on debt-to-equity and valuation metrics. In contrast, American Express relies heavily on operational strength but shows significant weaknesses in leverage and valuation scores, indicating potential financial risk and possible overvaluation.
Bankruptcy Risk: Solvency Showdown
The Altman Z-Score comparison shows both companies reside in the distress zone, signaling elevated bankruptcy risk amid current market conditions:
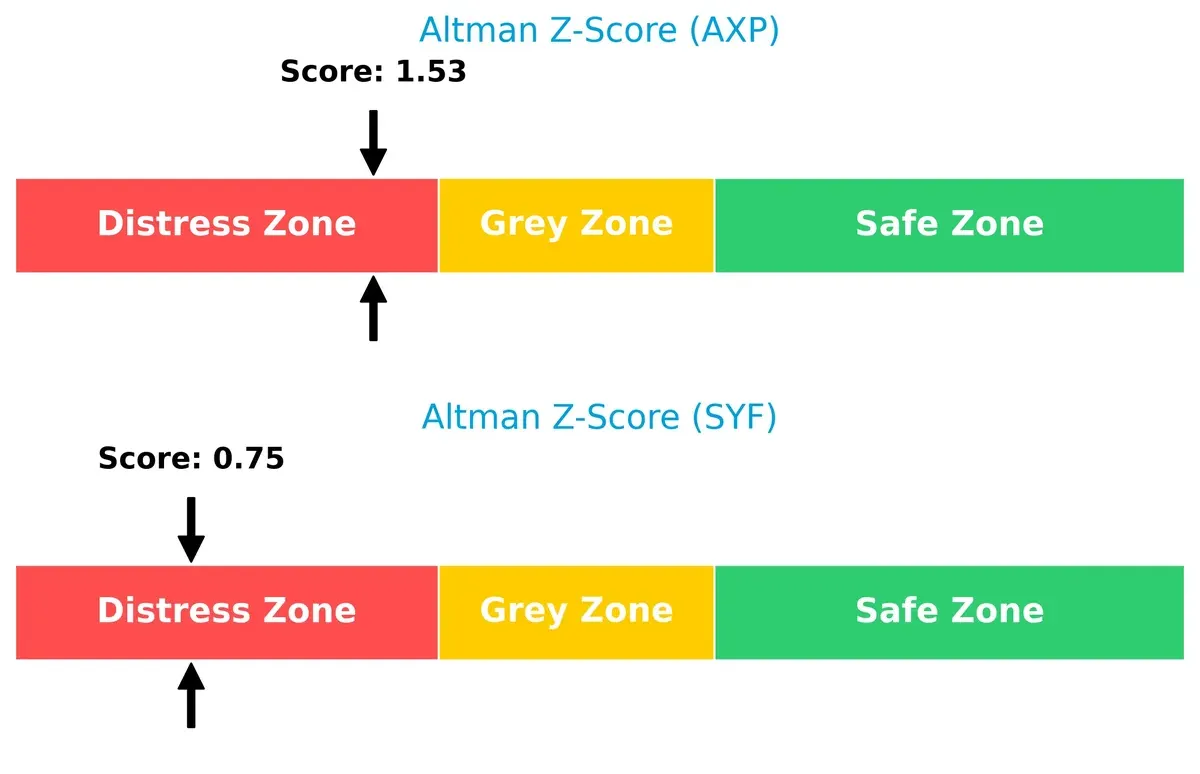
American Express posts a Z-Score of 1.53, slightly higher than Synchrony’s 0.75, but both are below the 1.8 safety threshold. This implies cautious monitoring is essential, as neither firm currently demonstrates strong solvency resilience through this cycle.
Financial Health: Quality of Operations
Synchrony Financial edges out with a Piotroski F-Score of 8, indicating very strong financial health, while American Express scores 7, still strong but slightly weaker:
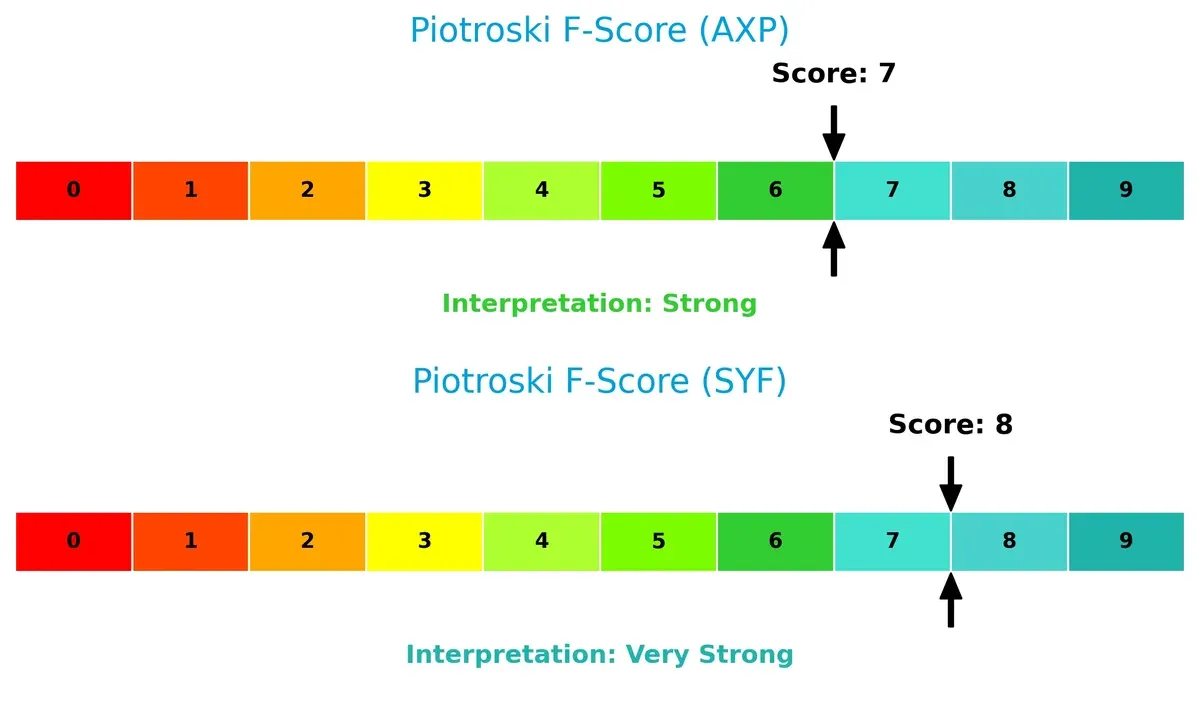
Both companies show robust internal metrics, yet American Express’s lower score suggests minor red flags in profitability or liquidity compared to Synchrony. Investors should weigh Synchrony’s superior operational quality as a potential advantage.
How are the two companies positioned?
This section dissects AXP and SYF’s operational DNA by comparing their revenue distribution and internal strengths and weaknesses. The goal is to confront their economic moats to determine which model offers the most resilient competitive advantage today.
Revenue Segmentation: The Strategic Mix
This visual comparison dissects how American Express Company and Synchrony Financial diversify their income streams and where their primary sector bets lie:
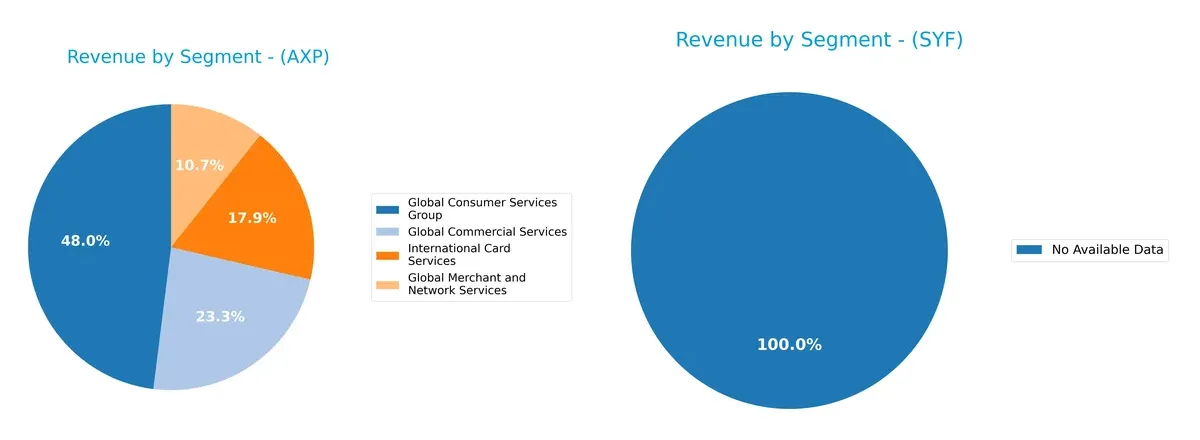
American Express anchors its revenue in four key segments, with Global Consumer Services Group leading at $34.8B in 2025, followed by Global Commercial Services at $16.9B. This mix shows a balanced approach across consumer, commercial, and merchant services, reducing concentration risk. Synchrony Financial lacks available segmentation data, preventing comparison. AmEx’s diversified portfolio supports ecosystem lock-in, leveraging multiple payment and service channels to sustain growth and competitive advantage.
Strengths and Weaknesses Comparison
This table compares the strengths and weaknesses of American Express Company and Synchrony Financial:
American Express Company Strengths
- Diversified revenue streams across consumer, commercial, international, and merchant services
- Strong profitability with 13.39% net margin and 32.19% ROE
- Favorable debt-to-assets ratio at 19.25%
- Solid interest coverage at 5.91 times
Synchrony Financial Strengths
- Higher net margin at 17.58% indicating operational efficiency
- Favorable P/E ratio of 8.41 suggesting attractive valuation
- Lower debt-to-assets ratio at 12.75%
- Positive return on equity at 21.19%
American Express Company Weaknesses
- Unfavorable ROIC of 4.35% below WACC of 8.09% indicating weak capital returns
- High price-to-book ratio of 7.68 suggesting premium valuation
- Very high current ratio at 79.97, unusual liquidity metric
- Elevated debt-to-equity at 1.73, increasing financial risk
- Low asset turnover of 0.27 reflecting asset inefficiency
Synchrony Financial Weaknesses
- Negative ROIC at -91.64% signaling capital destruction
- Unfavorable WACC at 14.17% indicating expensive capital costs
- Zero current and quick ratios raising liquidity concerns
- Interest coverage low at 1.73 times, risking solvency issues
- Low asset turnover of 0.17 showing poor asset use
Overall, both firms show slightly unfavorable financial ratios but differ in their operational strengths. American Express benefits from diverse global revenue and strong profitability metrics, while Synchrony Financial offers better valuation multiples but faces significant capital return and liquidity challenges. These factors frame their strategic priorities around improving asset efficiency and managing financial leverage.
The Moat Duel: Analyzing Competitive Defensibility
A structural moat is the only thing protecting long-term profits from the erosion of competition. Let’s examine how each company defends its turf:
American Express Company: Intangible Assets and Brand Strength
American Express leverages strong brand loyalty and premium customer relationships. Its high net margins and steady revenue growth reflect this intangible moat. Expansion into new markets in 2026 could deepen its advantage.
Synchrony Financial: Cost Advantage in Consumer Finance
Synchrony’s moat centers on cost-efficient credit services and niche private-label credit cards. Despite weaker ROIC trends, it sustains solid EBIT margins. Growth in healthcare and specialty financing may boost its competitive edge in 2026.
Brand Prestige vs. Cost Efficiency: Who Holds the Stronger Moat?
Both firms show declining ROIC below WACC, signaling value destruction, but American Express’s robust brand and margin stability offer a wider moat. It’s better positioned to defend market share against intensifying competition.
Which stock offers better returns?
The past year shows significant bullish momentum for both stocks, with American Express and Synchrony Financial experiencing strong gains amid decelerating trends.
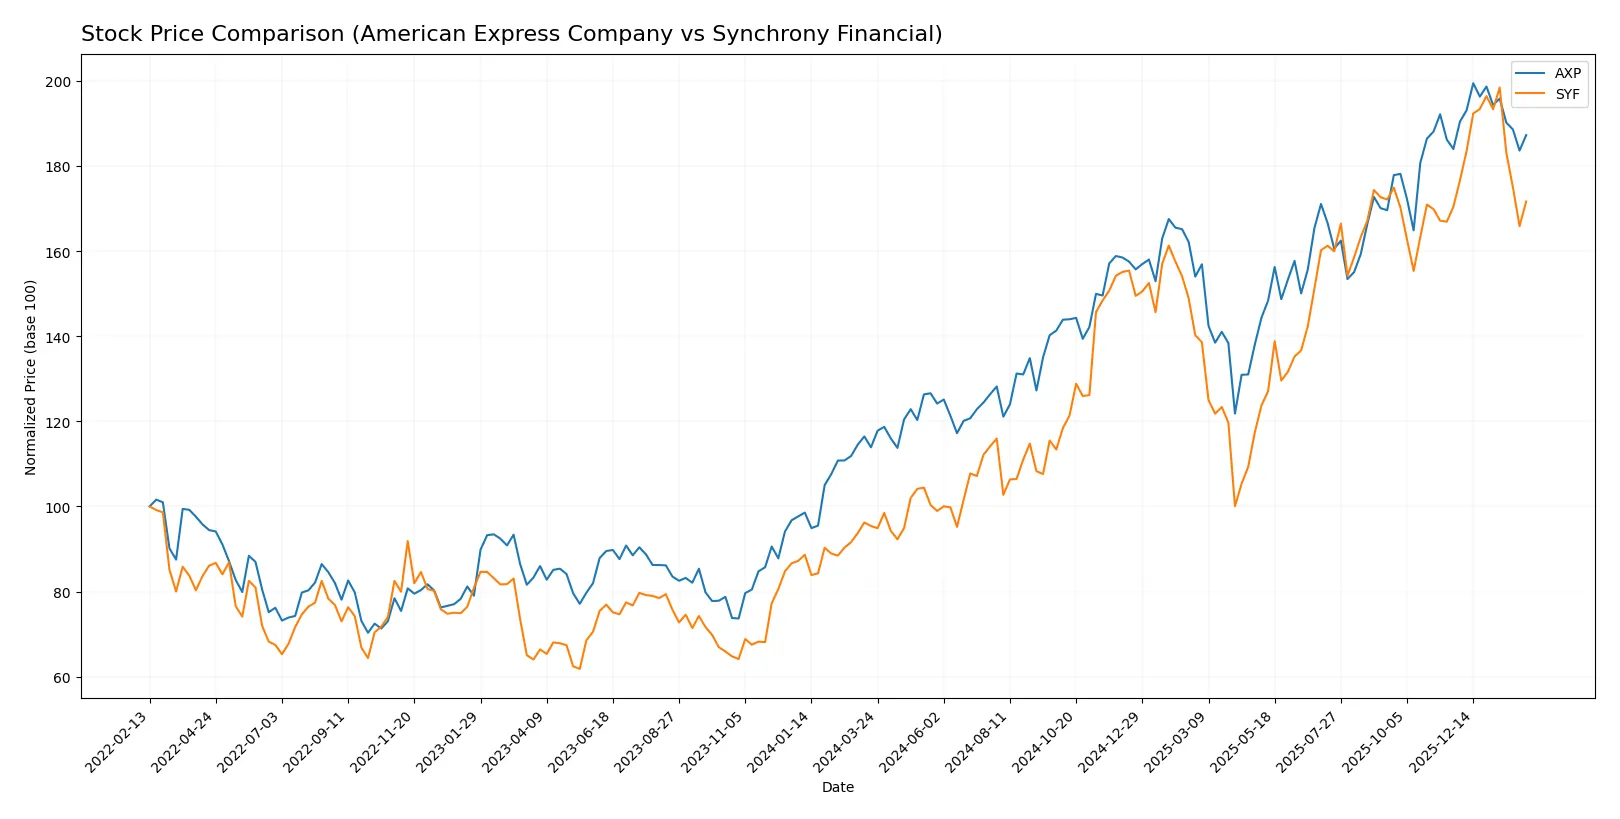
Trend Comparison
American Express stock rose 64.4% over the past year, marking a bullish trend with decelerating momentum. It hit a high of 382.56 and a low of 218.2, exhibiting high volatility (std dev 45.81).
Synchrony Financial gained 79.9% over the same period, also bullish but with slower acceleration. Its price ranged between 40.41 and 86.89, showing moderate volatility (std dev 12.88).
Synchrony Financial delivered stronger market performance than American Express, despite both showing deceleration in their upward trends.
Target Prices
Analysts project moderate upside for both American Express Company and Synchrony Financial based on current consensus targets.
| Company | Target Low | Target High | Consensus |
|---|---|---|---|
| American Express Company | 295 | 425 | 375.17 |
| Synchrony Financial | 81 | 100 | 90 |
The target consensus for American Express stands about 4.5% above the current price of 359.15, signaling cautious optimism. Synchrony’s consensus target at 90 suggests roughly 20% upside from its 75.16 price, indicating stronger growth expectations.

Don’t Let Luck Decide Your Entry Point
Optimize your entry points with our advanced ProRealTime indicators. You’ll get efficient buy signals with precise price targets for maximum performance. Start outperforming now!
How do institutions grade them?
American Express Company Grades
The following table summarizes recent grades from recognized financial institutions for American Express Company:
| Grading Company | Action | New Grade | Date |
|---|---|---|---|
| Truist Securities | Maintain | Buy | 2026-02-02 |
| JP Morgan | Maintain | Neutral | 2026-02-02 |
| BTIG | Maintain | Sell | 2026-02-02 |
| JP Morgan | Maintain | Neutral | 2026-01-12 |
| TD Cowen | Maintain | Hold | 2026-01-08 |
| Barclays | Maintain | Equal Weight | 2026-01-06 |
| Truist Securities | Maintain | Buy | 2025-12-22 |
| Wells Fargo | Maintain | Overweight | 2025-12-17 |
| Freedom Capital Markets | Upgrade | Hold | 2025-10-24 |
| Wells Fargo | Maintain | Overweight | 2025-10-20 |
Synchrony Financial Grades
Below is a summary of recent grades from reputable grading companies for Synchrony Financial:
| Grading Company | Action | New Grade | Date |
|---|---|---|---|
| Truist Securities | Maintain | Hold | 2026-01-29 |
| BTIG | Maintain | Buy | 2026-01-28 |
| Barclays | Maintain | Overweight | 2026-01-28 |
| RBC Capital | Maintain | Sector Perform | 2026-01-28 |
| JP Morgan | Maintain | Neutral | 2026-01-28 |
| JP Morgan | Maintain | Neutral | 2026-01-12 |
| TD Cowen | Maintain | Buy | 2026-01-08 |
| Barclays | Maintain | Overweight | 2026-01-06 |
| Wells Fargo | Maintain | Overweight | 2026-01-05 |
| Keefe, Bruyette & Woods | Maintain | Outperform | 2026-01-02 |
Which company has the best grades?
Synchrony Financial consistently receives Buy and Overweight ratings from multiple firms, indicating stronger institutional confidence. American Express shows a mixed rating profile with Buy, Neutral, and Sell grades, reflecting more cautious investor sentiment. This variation may influence risk assessments and portfolio positioning.
Risks specific to each company
The following categories identify critical pressure points and systemic threats facing American Express Company and Synchrony Financial in the 2026 market environment:
1. Market & Competition
American Express Company
- Strong brand with diversified global consumer and commercial services
- Faces intense competition from digital payment platforms and fintech disruptors
Synchrony Financial
- Focused on consumer credit products with niche retail partnerships
- Vulnerable to loss of retailer partnerships and rising competition in point-of-sale financing
2. Capital Structure & Debt
American Express Company
- Debt-to-equity ratio at 1.73 signals higher leverage risk
- Interest coverage of 5.91 indicates solid ability to service debt
Synchrony Financial
- Lower leverage at 0.91 offers more financial flexibility
- Interest coverage at 1.73 is a red flag for debt servicing capacity
3. Stock Volatility
American Express Company
- Beta of 1.13 suggests moderate volatility in line with sector
- Trading range wider but volume stable
Synchrony Financial
- Higher beta of 1.40 indicates greater stock price swings
- Larger volume swings increase investor risk exposure
4. Regulatory & Legal
American Express Company
- Operates globally, exposed to multi-jurisdictional regulatory risks
- Subject to evolving data privacy and anti-trust scrutiny
Synchrony Financial
- Primarily US-focused, regulatory changes in consumer credit impact heavily
- Faces regulatory pressure on credit underwriting and consumer protection laws
5. Supply Chain & Operations
American Express Company
- Relies on robust payment processing and merchant network infrastructure
- Operational risks mitigated by diversified service offerings
Synchrony Financial
- Dependent on retail partners and technology platforms for credit product distribution
- Concentration risk from key retail partnerships could disrupt operations
6. ESG & Climate Transition
American Express Company
- Initiatives in sustainable finance and reduced carbon footprint
- ESG integration supports brand reputation and regulatory compliance
Synchrony Financial
- ESG efforts less developed, facing pressure to improve climate risk disclosures
- Potential reputational risk if ESG standards lag peers
7. Geopolitical Exposure
American Express Company
- Global footprint exposes it to currency fluctuations and trade tensions
- Vulnerable to international sanctions and geopolitical instability
Synchrony Financial
- US-centric operations limit direct geopolitical exposure
- Lower geopolitical risk but sensitive to domestic policy shifts
Which company shows a better risk-adjusted profile?
Synchrony Financial’s lower leverage and stronger Piotroski score indicate better financial resilience. However, its weak Altman Z-score and interest coverage ratio raise bankruptcy concerns. American Express shows stronger operational diversity but carries higher leverage and a distress-level Altman Z-score. Both face significant risks, but Synchrony’s niche focus and lower debt slightly improve its risk-adjusted profile. The critical red flag is Synchrony’s poor debt servicing ability; American Express’s high leverage remains a vulnerability. I am particularly concerned about Synchrony’s Altman Z-score under 1 and interest coverage barely above 1.7, signaling financial distress risk despite its better Piotroski score.
Final Verdict: Which stock to choose?
American Express Company’s superpower lies in its robust brand and premium customer base, delivering consistent profitability and strong return on equity. However, its declining return on invested capital signals a value destruction risk, which is a point of vigilance for cautious investors. It fits well in an aggressive growth portfolio seeking market leadership.
Synchrony Financial’s strategic moat centers on its niche in consumer financing and recurring revenue streams, providing a steady cash flow profile. Compared to American Express, it offers a more attractive valuation but carries higher earnings volatility and financial risks. It suits investors favoring Growth at a Reasonable Price (GARP) strategies with a value tilt.
If you prioritize brand strength and long-term market dominance, American Express is the compelling choice due to its superior profitability and customer loyalty. However, if you seek better valuation entry points with steady cash flow, Synchrony Financial offers better stability and a more reasonable price despite its financial caution flags. Both require monitoring of declining capital returns as a key risk factor.
Disclaimer: Investment carries a risk of loss of initial capital. The past performance is not a reliable indicator of future results. Be sure to understand risks before making an investment decision.
Go Further
I encourage you to read the complete analyses of American Express Company and Synchrony Financial to enhance your investment decisions: