Home > Comparison > Financial Services > MA vs AXP
The strategic rivalry between Mastercard Incorporated and American Express Company shapes the financial credit services landscape. Mastercard operates as a technology-driven payment processor, focusing on scalable transaction services worldwide. In contrast, American Express combines payment products with travel and lifestyle services, leveraging a broader consumer and corporate base. This analysis evaluates which operational model delivers superior risk-adjusted returns, guiding investors seeking durable growth and competitive positioning in financial services.

Table of contents
Companies Overview
Mastercard and American Express dominate the global financial services landscape with distinctive business models and market roles.
Mastercard Incorporated: Payment Technology Powerhouse
Mastercard operates as a technology-driven payment processor facilitating authorization, clearing, and settlement of transactions worldwide. Its core revenue stems from transaction fees and value-added services like analytics, cyber solutions, and digital identity platforms. In 2026, Mastercard emphasizes expanding open banking and integrated payment solutions to capture evolving consumer and merchant needs.
American Express Company: Diversified Financial Services Leader
American Express combines charge and credit card products with travel and lifestyle services, generating revenue through fees, financing products, and merchant services. Its broad customer base spans consumers to large corporations. In 2026, the company focuses on enhancing loyalty programs and fraud prevention, leveraging its integrated service segments to deepen customer engagement.
Strategic Collision: Similarities & Divergences
Mastercard’s open infrastructure contrasts with American Express’s closed-loop network, reflecting divergent philosophies on control and ecosystem participation. They primarily clash over market share in premium cardholders and merchant acceptance. Mastercard appeals through scalable technology, while American Express offers a differentiated consumer experience—each presenting unique risk-reward profiles for investors.
Income Statement Comparison
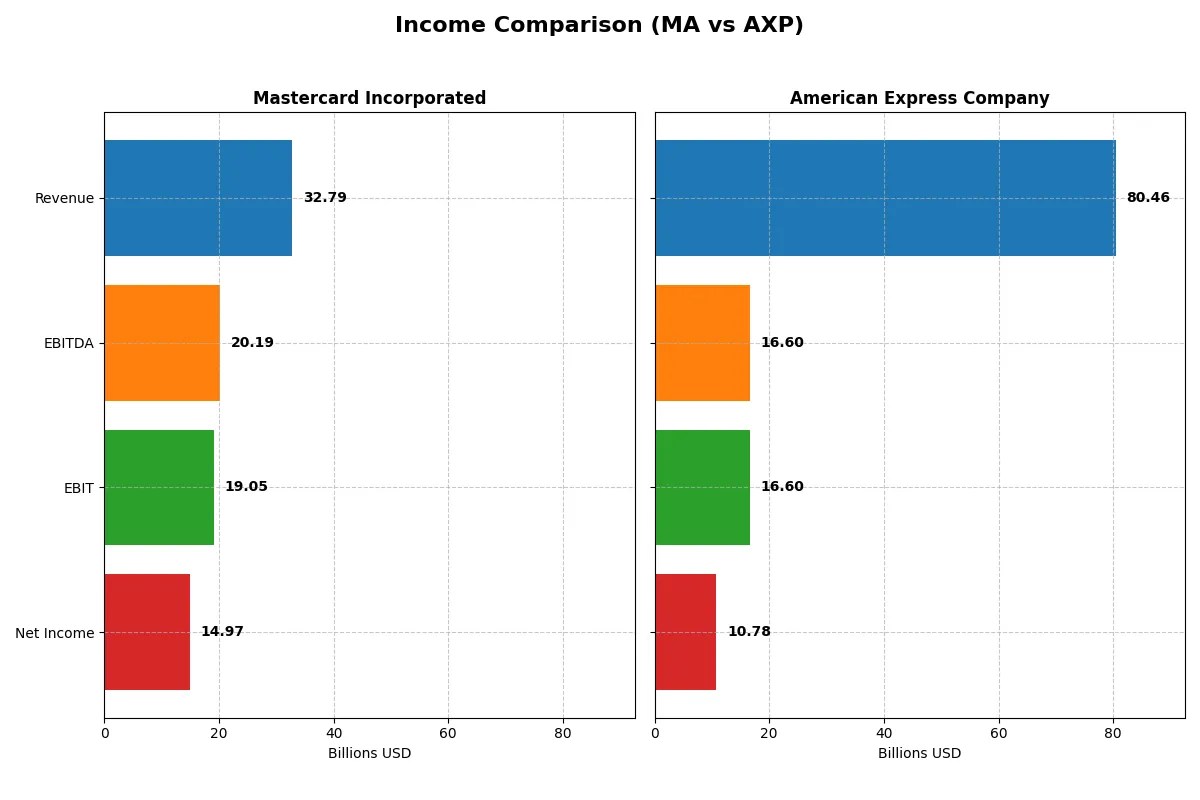
This data dissects the core profitability and scalability of both corporate engines to reveal who dominates the bottom line:
| Metric | Mastercard (MA) | American Express (AXP) |
|---|---|---|
| Revenue | 32.8B | 80.5B |
| Cost of Revenue | 5.4B | 29.9B |
| Operating Expenses | 7.96B | 34.0B |
| Gross Profit | 27.4B | 50.6B |
| EBITDA | 20.2B | 16.6B |
| EBIT | 19.1B | 16.6B |
| Interest Expense | 722M | 2.81B |
| Net Income | 14.97B | 10.78B |
| EPS | 16.55 | 15.40 |
| Fiscal Year | 2025 | 2025 |
Income Statement Analysis: The Bottom-Line Duel
This income statement comparison exposes the true efficiency and profitability of Mastercard and American Express’s corporate engines over recent years.
Mastercard Incorporated Analysis
Mastercard’s revenue surged from $18.9B in 2021 to $32.8B in 2025, with net income climbing from $8.7B to $14.97B. The company maintains robust gross and net margins at 83.4% and 45.7%, respectively, reflecting strong cost control. In 2025, Mastercard’s EBIT margin reached 58.1%, signaling exceptional operational efficiency and sustained momentum.
American Express Company Analysis
American Express grew revenue from $44.4B in 2021 to $80.5B in 2025, with net income rising from $8.1B to $10.8B. Despite solid revenue gains, its gross margin at 62.9% and net margin at 13.4% lag behind Mastercard’s. The 2025 EBIT margin of 20.6% highlights lower operating leverage, though recent 28.8% EBIT growth indicates improving profitability.
Margin Dominance vs. Revenue Scale
Mastercard excels with superior margins and efficiency, converting more revenue into profit. American Express boasts a larger top line but with thinner margins and slower net income growth. For investors prioritizing profitability and operational strength, Mastercard’s profile offers clearer fundamental advantages over American Express’s scale-driven but less efficient model.
Financial Ratios Comparison
These vital ratios act as a diagnostic tool to expose the underlying fiscal health, valuation premiums, and capital efficiency of the companies compared below:
| Ratios | Mastercard Incorporated (MA) | American Express Company (AXP) |
|---|---|---|
| ROE | 193.46% | 32.19% |
| ROIC | 48.63% | 4.35% |
| P/E | 34.21 | 23.86 |
| P/B | 66.19 | 7.68 |
| Current Ratio | 1.03 | 79.97 |
| Quick Ratio | 1.03 | 79.97 |
| D/E (Debt-to-Equity) | 2.46 | 1.73 |
| Debt-to-Assets | 35.08% | 19.25% |
| Interest Coverage | 26.87 | 5.91 |
| Asset Turnover | 0.61 | 0.27 |
| Fixed Asset Turnover | 14.24 | 0 |
| Payout ratio | 18.41% | 21.08% |
| Dividend yield | 0.54% | 0.88% |
| Fiscal Year | 2025 | 2025 |
Efficiency & Valuation Duel: The Vital Signs
Ratios act as a company’s financial DNA, exposing hidden risks and uncovering operational excellence beneath surface numbers.
Mastercard Incorporated
Mastercard delivers exceptional profitability, with a stellar 193% ROE and a robust 45.65% net margin. Its valuation, at a stretched 34.2 P/E and very high 66.2 P/B ratio, suggests the stock trades at a premium. Dividend yield is low at 0.54%, indicating a focus on reinvestment and shareholder value through operational efficiency and growth.
American Express Company
American Express shows solid profitability with a 32.2% ROE and a 13.4% net margin, reflecting steady earnings generation. Valuation appears reasonable with a 23.9 P/E and moderate 7.7 P/B, though some ratios flag risks. The 0.88% dividend yield offers modest shareholder returns, balancing income with ongoing capital allocation challenges.
Premium Valuation vs. Operational Safety
Mastercard’s ratios highlight superior profitability but come with a premium valuation and some leverage concerns. American Express offers a more conservative valuation but weaker returns on capital. Investors seeking growth and efficiency may lean Mastercard, while those favoring value and income might prefer American Express’s steadier profile.
Which one offers the Superior Shareholder Reward?
I compare Mastercard’s and American Express’s payout approaches, dividend yields, payout ratios, and buyback intensity. Mastercard yields 0.54% with an 18% payout ratio, supported by robust free cash flow coverage, and executes moderate buybacks. American Express yields 0.88%–1.4%, with a slightly higher 21% payout ratio and stronger buyback activity, enhancing total returns. Mastercard prioritizes sustainable growth and capital efficiency, using buybacks prudently, while American Express leans on higher yield plus buybacks for shareholder reward. I conclude American Express offers a superior total return profile in 2026, balancing yield and buybacks more aggressively amid moderate margin pressure risks.
Comparative Score Analysis: The Strategic Profile
The radar chart reveals the fundamental DNA and strategic trade-offs of Mastercard and American Express, highlighting their financial strengths and valuation dynamics:
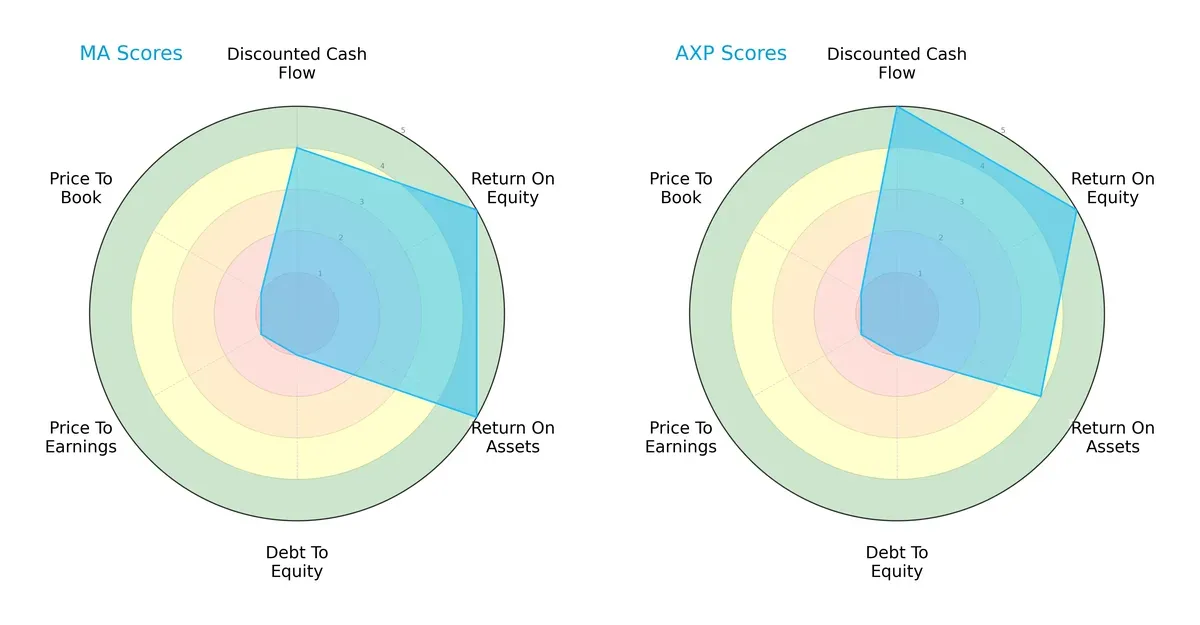
Mastercard shows a balanced profile with very favorable ROE and ROA, alongside a strong DCF score. American Express leverages a higher DCF score but slightly weaker ROA. Both firms suffer from very unfavorable debt-to-equity and valuation scores, signaling potential risk in leverage and market pricing. Mastercard relies more on operational efficiency, while American Express prioritizes cash flow projections.
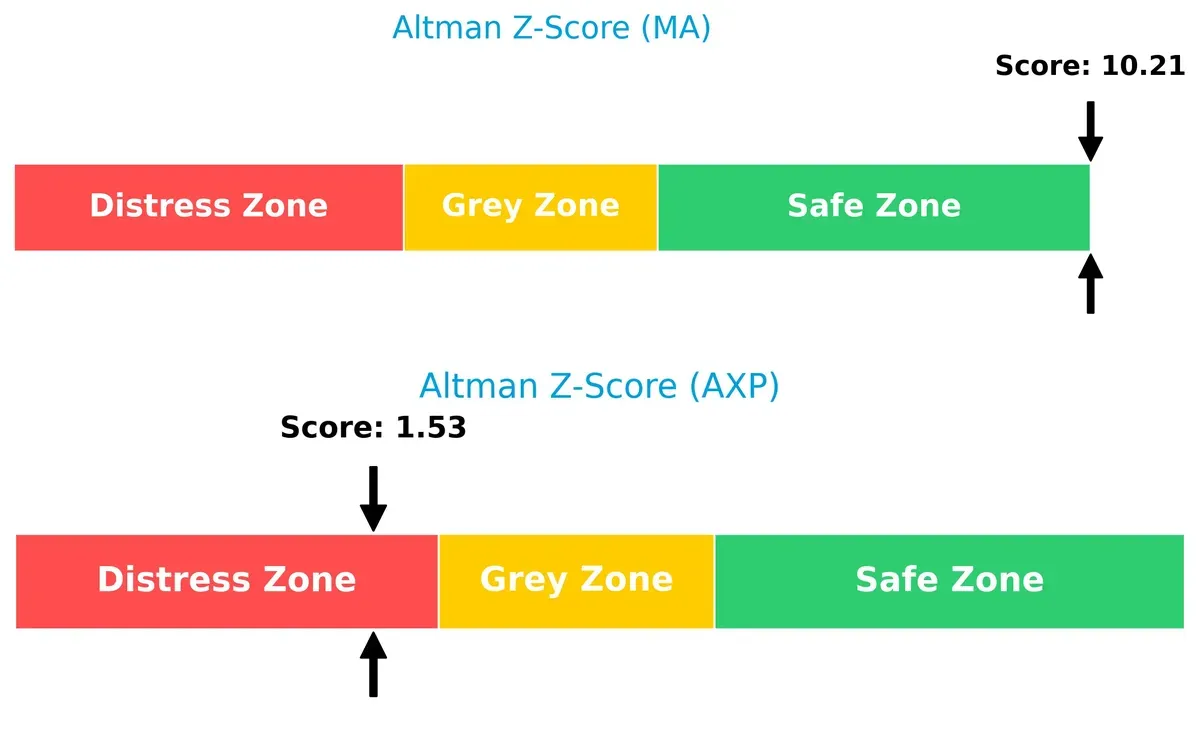
Bankruptcy Risk: Solvency Showdown
The Altman Z-Score gap signals sharply different bankruptcy risks: Mastercard’s score of 10.2 places it safely in the “safe zone,” while American Express’s 1.5 warns of financial distress and heightened bankruptcy risk in this cycle:
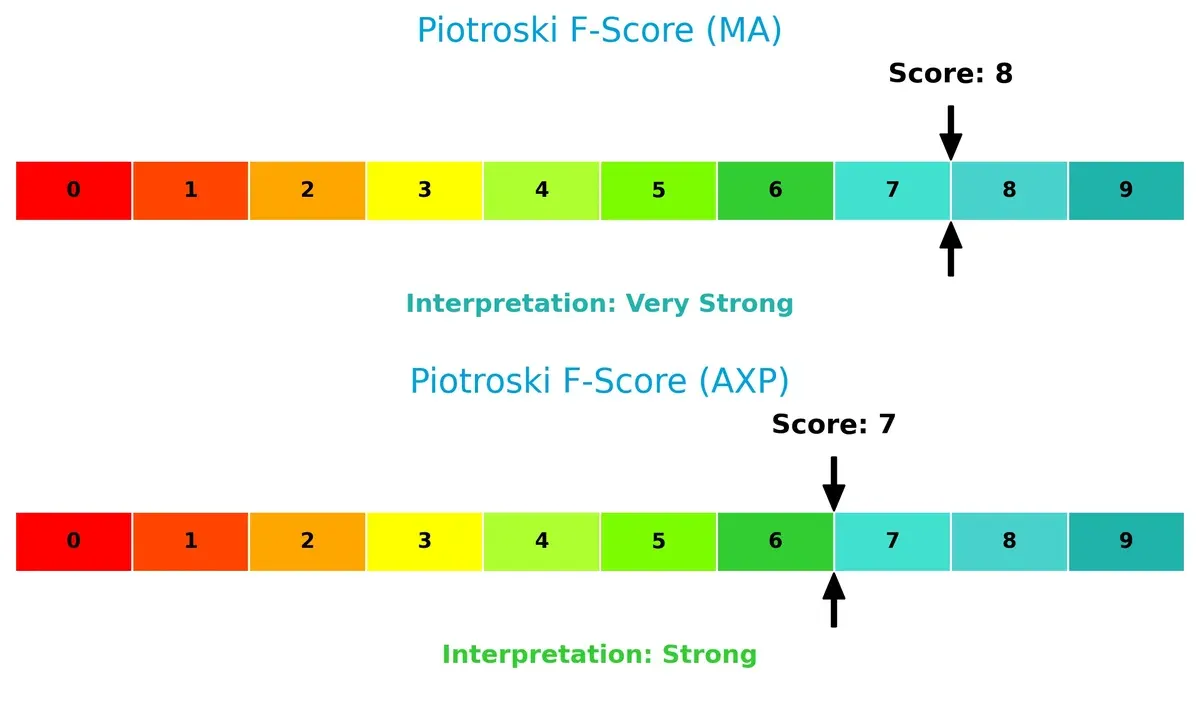
Financial Health: Quality of Operations
Mastercard’s Piotroski score of 8 suggests very strong internal financial health, outperforming American Express’s score of 7, which still indicates strength but with potential red flags in operational efficiency or liquidity:
How are the two companies positioned?
This section dissects the operational DNA of Mastercard and American Express by comparing their revenue distribution and internal dynamics. The goal is to confront their economic moats and reveal which business model delivers the most resilient competitive advantage today.
Revenue Segmentation: The Strategic Mix
The following visual comparison dissects how Mastercard Incorporated and American Express Company diversify their income streams and where their primary sector bets lie:
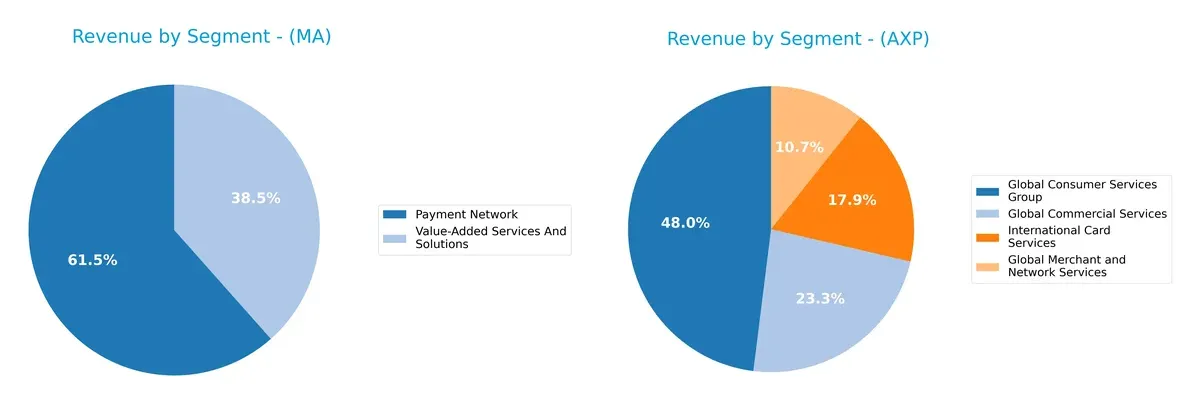
Mastercard anchors revenue in two key segments: Payment Network at $17.3B and Value-Added Services at $10.8B, showing moderate diversification. American Express pivots around Global Consumer Services, which dwarfs other segments at $31.4B, followed by Global Commercial Services at $15.9B. AmEx’s reliance on consumer services signals strong ecosystem lock-in but raises concentration risk. Mastercard’s balanced mix reflects stable infrastructure dominance with less segment risk.
Strengths and Weaknesses Comparison
This table compares the Strengths and Weaknesses of Mastercard and American Express based on diversification, profitability, financials, innovation, global reach, and market share:
Mastercard Strengths
- Strong profitability with 45.65% net margin and 193.46% ROE
- Favorable ROIC of 48.63% well above WACC
- Balanced revenue from Payment Network and Value-Added Services
- Significant international market revenue of $15.8B in 2024
- Solid quick ratio of 1.03 indicating liquidity
- High fixed asset turnover of 14.24
American Express Strengths
- Diverse business segments including Global Commercial and Consumer Services
- Favorable net margin of 13.39% and ROE of 32.19%
- Lower debt-to-assets at 19.25% reduces financial risk
- Favorable quick ratio despite weak current ratio
- Large U.S. geographic revenue concentration of $56B in 2025
- Consistent interest coverage of 5.91 supports debt service
Mastercard Weaknesses
- High debt-to-equity ratio of 2.46 signals leverage concerns
- Elevated P/B ratio of 66.19 shows potential overvaluation
- PE ratio of 34.21 considered high versus market benchmarks
- Modest dividend yield at 0.54% limits income appeal
- Neutral current ratio at 1.03 indicates tight working capital
- Moderate asset turnover of 0.61 could improve efficiency
American Express Weaknesses
- Unfavorable ROIC of 4.35% below WACC of 8.09% suggests poor capital returns
- Very high current and quick ratios at 79.97 point to asset inefficiency
- Fixed asset turnover at zero signals underutilization
- Elevated debt-to-equity of 1.73 raises leverage risk
- P/B ratio 7.68 and dividend yield 0.88% considered weak
- Lower asset turnover at 0.27 restricts revenue generation
Mastercard’s strengths center on superior profitability and global diversification, while its leverage and valuation metrics pose caution. American Express shows solid segment diversification and liquidity but struggles with capital efficiency and leverage. Each company’s financial profile suggests distinct strategic priorities to address.
The Moat Duel: Analyzing Competitive Defensibility
A structural moat is the only fortress protecting long-term profits from relentless competition erosion. Let’s dissect the moats of two financial giants:
Mastercard Incorporated: Network Effects Powerhouse
Mastercard’s moat stems from powerful network effects, reflected in a stellar 58% EBIT margin and rising ROIC. Expansion in digital identity and open banking promises to deepen this advantage in 2026.
American Express Company: Premium Brand & Customer Loyalty
American Express relies on brand prestige and customer loyalty, yielding solid but lower margins than Mastercard. However, its declining ROIC signals weakening capital efficiency, challenging its moat’s sustainability.
Network Effects vs. Brand Loyalty: The Competitive Moat Faceoff
Mastercard’s expanding network effects create a wider and more durable moat than American Express’s brand-driven advantage. Mastercard’s growing profitability positions it better to defend and grow market share in 2026.
Which stock offers better returns?
Mastercard Incorporated and American Express Company exhibited strong price gains over the past year, with distinct trading volume dynamics influencing their recent momentum.
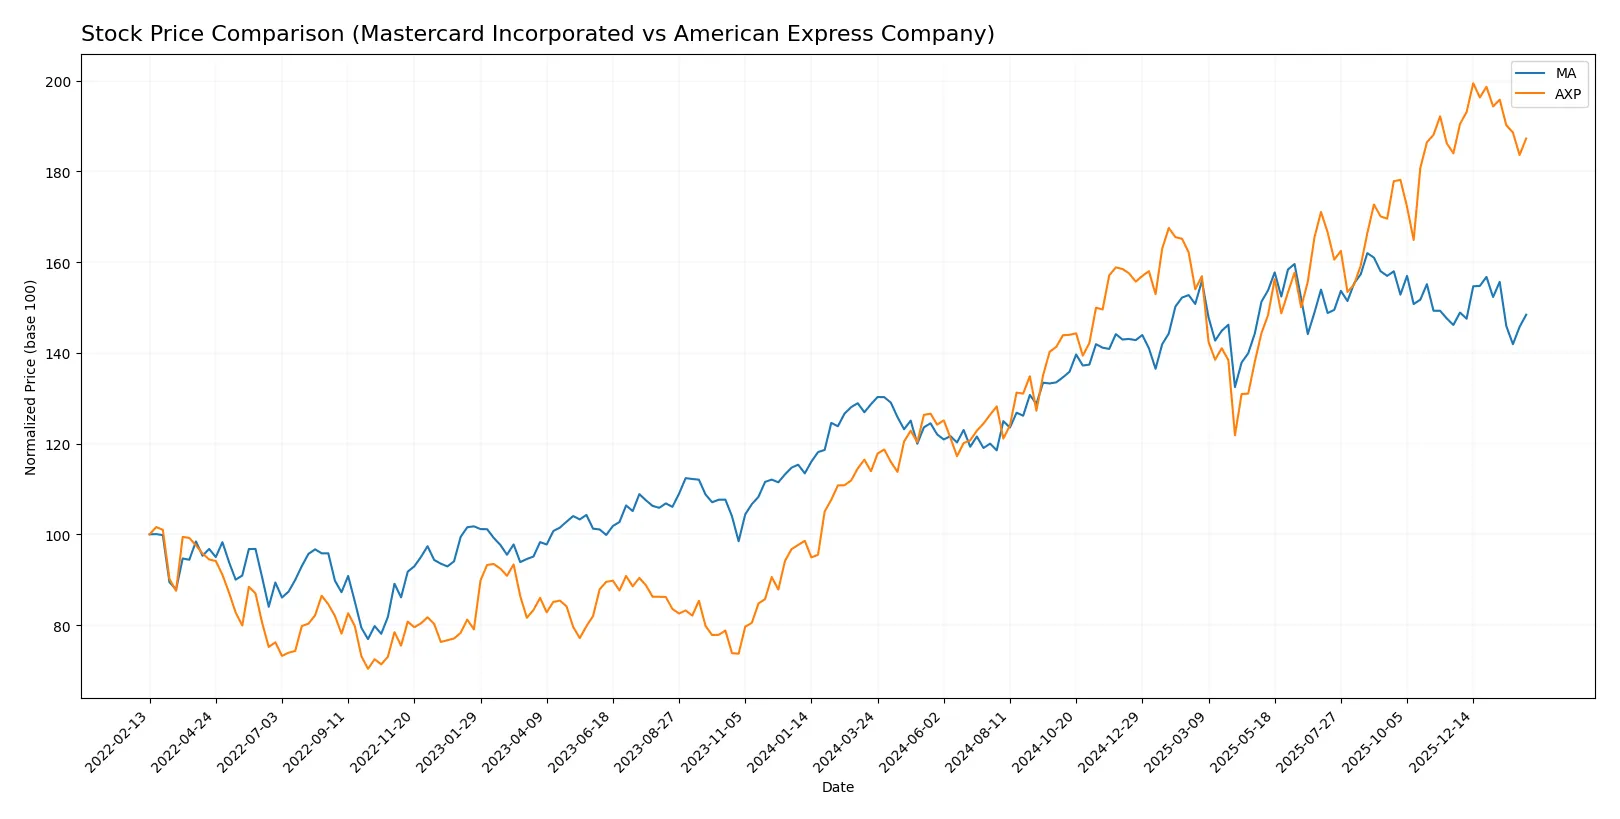
Trend Comparison
Mastercard’s stock shows a 15.32% rise over the past year, marking a bullish trend with decelerating momentum. The price ranged between 438.18 and 598.96, reflecting notable volatility.
American Express gained 64.4% over the same period, also bullish with deceleration. Its price fluctuated between 218.2 and 382.56, maintaining high volatility similar to Mastercard’s.
American Express outperformed Mastercard in market returns over the past year. Despite both showing decelerating bullish trends, Amex delivered the highest price appreciation.
Target Prices
Analysts present a bullish consensus for Mastercard Incorporated and American Express Company with notable upside potential.
| Company | Target Low | Target High | Consensus |
|---|---|---|---|
| Mastercard Incorporated | 609 | 739 | 666.87 |
| American Express Company | 295 | 425 | 375.17 |
Mastercard’s consensus target exceeds its current price of 549 by over 21%, signaling strong growth expectations. American Express shows a similar pattern, with a consensus target roughly 4.5% above today’s 359 price, indicating moderate upside.

Don’t Let Luck Decide Your Entry Point
Optimize your entry points with our advanced ProRealTime indicators. You’ll get efficient buy signals with precise price targets for maximum performance. Start outperforming now!
How do institutions grade them?
Here are the latest institutional grades for Mastercard Incorporated and American Express Company:
Mastercard Incorporated Grades
This table shows recent grades assigned by leading financial institutions:
| Grading Company | Action | New Grade | Date |
|---|---|---|---|
| RBC Capital | Maintain | Outperform | 2026-01-30 |
| Morgan Stanley | Maintain | Overweight | 2026-01-30 |
| JP Morgan | Maintain | Overweight | 2026-01-30 |
| TD Cowen | Maintain | Buy | 2026-01-30 |
| Wells Fargo | Maintain | Overweight | 2026-01-30 |
| Raymond James | Maintain | Outperform | 2026-01-30 |
| Macquarie | Maintain | Outperform | 2026-01-30 |
| Compass Point | Upgrade | Buy | 2026-01-13 |
| HSBC | Upgrade | Buy | 2025-12-08 |
| Tigress Financial | Maintain | Strong Buy | 2025-11-06 |
American Express Company Grades
This table summarizes recent grade actions from reputable firms:
| Grading Company | Action | New Grade | Date |
|---|---|---|---|
| Truist Securities | Maintain | Buy | 2026-02-02 |
| JP Morgan | Maintain | Neutral | 2026-02-02 |
| BTIG | Maintain | Sell | 2026-02-02 |
| JP Morgan | Maintain | Neutral | 2026-01-12 |
| TD Cowen | Maintain | Hold | 2026-01-08 |
| Barclays | Maintain | Equal Weight | 2026-01-06 |
| Truist Securities | Maintain | Buy | 2025-12-22 |
| Wells Fargo | Maintain | Overweight | 2025-12-17 |
| Freedom Capital Markets | Upgrade | Hold | 2025-10-24 |
| Wells Fargo | Maintain | Overweight | 2025-10-20 |
Which company has the best grades?
Mastercard consistently receives higher grades, including multiple “Outperform” and “Strong Buy” ratings. American Express holds more mixed grades, ranging from “Buy” to “Sell.” These differences may influence investor confidence and portfolio positioning.
Risks specific to each company
The following categories identify the critical pressure points and systemic threats facing both firms in the 2026 market environment:
1. Market & Competition
Mastercard Incorporated
- Dominates global payment processing with strong technology edge and extensive network.
American Express Company
- Competes with diversified payment and travel services, facing pressure from digital disruptors.
2. Capital Structure & Debt
Mastercard Incorporated
- Debt-to-equity ratio high at 2.46, signaling elevated leverage risk.
American Express Company
- More conservative leverage at 1.73, indicating better balance sheet resilience.
3. Stock Volatility
Mastercard Incorporated
- Beta at 0.82, showing lower volatility than market.
American Express Company
- Beta at 1.13, reflecting higher sensitivity to market swings.
4. Regulatory & Legal
Mastercard Incorporated
- Faces regulatory scrutiny on fees and data privacy globally.
American Express Company
- Subject to complex financial regulation and compliance risks internationally.
5. Supply Chain & Operations
Mastercard Incorporated
- Relies on robust digital infrastructure; cyber risks remain a concern.
American Express Company
- Operational complexity due to travel services; pandemic recovery impacts persist.
6. ESG & Climate Transition
Mastercard Incorporated
- Invests in digital identity and cyber solutions aligning with sustainability goals.
American Express Company
- ESG efforts ongoing but challenged by travel sector emissions and diversity targets.
7. Geopolitical Exposure
Mastercard Incorporated
- Global footprint subjects it to trade tensions and currency fluctuations.
American Express Company
- Exposure to US and international markets with risks from geopolitical instability.
Which company shows a better risk-adjusted profile?
Mastercard’s most impactful risk is its elevated debt-to-equity ratio, which exposes it to financial risk despite strong profitability. American Express faces operational risks from its travel services and higher stock volatility. Mastercard’s lower beta and robust Altman Z-score indicate a safer risk-adjusted profile, supported by its very strong Piotroski score and stable cash flows. The contrast between Mastercard’s heavily leveraged balance sheet and American Express’s operational exposure justifies my caution, favoring Mastercard for risk-conscious investors.
Final Verdict: Which stock to choose?
Mastercard’s superpower lies in its exceptional capital efficiency and an expanding economic moat, driving value creation with outstanding ROIC well above its cost of capital. Its point of vigilance is elevated valuation multiples, which might temper near-term gains. This stock suits portfolios targeting aggressive growth with a tolerance for premium pricing.
American Express boasts a strategic moat rooted in its strong brand and recurring revenue from membership fees, offering a safer profile compared to Mastercard’s high-flying growth. However, its declining ROIC and signs of value erosion suggest caution. It fits well in GARP portfolios seeking steady income with moderate growth potential.
If you prioritize capital efficiency and long-term value creation, Mastercard outshines due to its sustainable competitive advantage and robust profitability. However, if you seek income stability and brand-driven resilience, American Express offers better stability despite its challenges. Both present distinct analytical scenarios for investors balancing growth versus safety.
Disclaimer: Investment carries a risk of loss of initial capital. The past performance is not a reliable indicator of future results. Be sure to understand risks before making an investment decision.
Go Further
I encourage you to read the complete analyses of Mastercard Incorporated and American Express Company to enhance your investment decisions: