Home > Comparison > Financial Services > AXP vs COF
The strategic rivalry between American Express Company and Capital One Financial Corporation shapes the competitive landscape of financial credit services. American Express operates as a diversified, premium payment network and travel services provider, while Capital One focuses on a broad credit and banking platform emphasizing digital innovation. This analysis compares their distinct models and growth strategies to determine which offers a superior risk-adjusted return potential for a diversified financial portfolio.

Table of contents
Companies Overview
American Express Company and Capital One Financial Corporation stand as pivotal players in the U.S. financial credit services market.
American Express Company: Premium Payment Network Leader
American Express commands a premium brand in charge and credit card products worldwide. Its core revenue derives from payment and financing products, merchant acquisition, and loyalty programs. In 2026, it focuses strategically on expanding its Global Commercial Services and enhancing fraud prevention capabilities.
Capital One Financial Corporation: Diversified Lending Powerhouse
Capital One operates as a broad financial services holding company with a strong presence in credit cards, consumer, and commercial banking. It earns revenue through credit card loans, auto and retail banking loans, and treasury management services. The firm’s 2026 strategy emphasizes digital channels and branch expansion in key U.S. states.
Strategic Collision: Similarities & Divergences
Both companies target diverse customer segments in credit services but diverge in approach: American Express leans on a closed premium ecosystem, while Capital One embraces an open, multi-channel banking model. Their primary battleground is the credit card market. Investors face distinct profiles—American Express offers brand-driven stability; Capital One, growth through diversification and digital innovation.
Income Statement Comparison
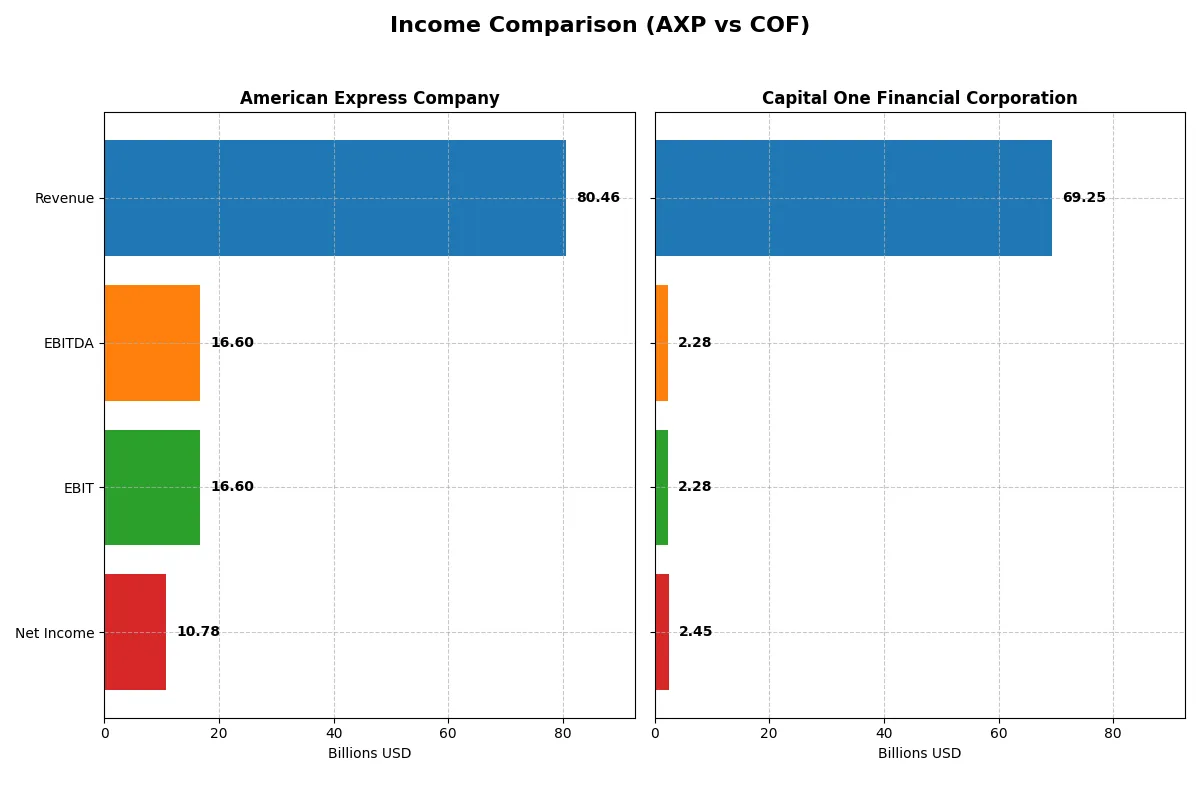
The following data dissects the core profitability and scalability of both corporate engines to reveal who dominates the bottom line:
| Metric | American Express Company (AXP) | Capital One Financial Corporation (COF) |
|---|---|---|
| Revenue | 80.5B | 69.3B |
| Cost of Revenue | 29.9B | 36.5B |
| Operating Expenses | 33.9B | 30.5B |
| Gross Profit | 50.6B | 32.8B |
| EBITDA | 16.6B | 2.3B |
| EBIT | 16.6B | 2.3B |
| Interest Expense | 2.8B | 30.5B |
| Net Income | 10.8B | 2.5B |
| EPS | 15.4 | 4.03 |
| Fiscal Year | 2025 | 2025 |
Income Statement Analysis: The Bottom-Line Duel
The upcoming income statement comparison will uncover which company runs a more efficient and profitable business engine through recent financial performance.
American Express Company Analysis
American Express demonstrates a steady revenue climb, reaching $80.5B in 2025 with net income of $10.8B. Its robust gross margin of 62.85% and net margin of 13.39% confirm strong profitability. Despite a slight gross profit dip last year, operating efficiency improved, with EBIT surging 28.8%, signaling healthy momentum.
Capital One Financial Corporation Analysis
Capital One’s revenue surged 28.4% to $69.3B in 2025, but net income plunged to $2.45B, reflecting margin pressures. Gross margin sits at a moderate 47.3%, while net margin is a thin 3.54%. EBIT dropped 61.4% last year, indicating operational challenges and reduced profitability despite top-line growth.
Margin Strength vs. Revenue Growth
American Express leads with superior margins and consistent net income growth, showcasing operational efficiency and resilience. Capital One excels in revenue expansion but struggles with profitability and margin erosion. For investors prioritizing sustainable earnings, American Express offers the more attractive financial profile.
Financial Ratios Comparison
These vital ratios act as a diagnostic tool to expose the underlying fiscal health, valuation premiums, and capital efficiency of the companies compared below:
| Ratios | American Express Company (AXP) | Capital One Financial Corporation (COF) |
|---|---|---|
| ROE | 32.19% | 0% |
| ROIC | 4.35% | 0% |
| P/E | 23.86 | 53.42 |
| P/B | 7.68 | 0 |
| Current Ratio | 79.97 | 0 |
| Quick Ratio | 79.97 | 0 |
| D/E | 1.73 | 0 |
| Debt-to-Assets | 19.25% | 0 |
| Interest Coverage | 5.91 | 0.07 |
| Asset Turnover | 0.27 | 0 |
| Fixed Asset Turnover | 0 | 0 |
| Payout ratio | 21.08% | 57.31% |
| Dividend yield | 0.88% | 1.07% |
| Fiscal Year | 2025 | 2025 |
Efficiency & Valuation Duel: The Vital Signs
Ratios act as the company’s DNA, revealing hidden risks and operational excellence that shape investor expectations and value perceptions.
American Express Company
American Express displays strong profitability with a 32.19% ROE and a solid 13.39% net margin, signaling operational efficiency. Its P/E of 23.86 suggests a fairly valued stock, though a high P/B of 7.68 signals potential overvaluation. The modest 0.88% dividend yield points to a conservative shareholder return strategy.
Capital One Financial Corporation
Capital One struggles with a weak 3.54% net margin and zero ROE, reflecting operational challenges. The stock trades at a stretched P/E of 53.42, indicating expensive valuation. Despite a low dividend yield of 1.07%, limited data on other ratios and financial metrics highlights notable risk and uncertainty in returns.
Balanced Profitability vs. Stretched Valuation
American Express offers better profitability and a more reasonable valuation than Capital One, which appears expensive with poor returns. Investors seeking a blend of operational strength and moderate valuation may find American Express’s profile more fitting, while Capital One presents higher risk and speculative potential.
Which one offers the Superior Shareholder Reward?
I compare American Express Company (AXP) and Capital One Financial Corporation (COF) in their distribution strategies. AXP offers a modest dividend yield near 0.9%, covered comfortably by free cash flow with a payout ratio around 21%. Their buyback program is steady, enhancing total return sustainably. COF yields slightly higher at 1.07%, but shows a payout ratio near 57%, signaling less free cash flow coverage and potential risk. COF’s buybacks are less consistent, while its higher leverage and weaker margins raise concerns. Historically, I’ve seen AXP’s balanced dividend and buyback approach better withstand market cycles. Thus, I find AXP offers a more attractive and sustainable shareholder reward profile in 2026.
Comparative Score Analysis: The Strategic Profile
The radar chart reveals the fundamental DNA and financial trade-offs of American Express Company and Capital One Financial Corporation:
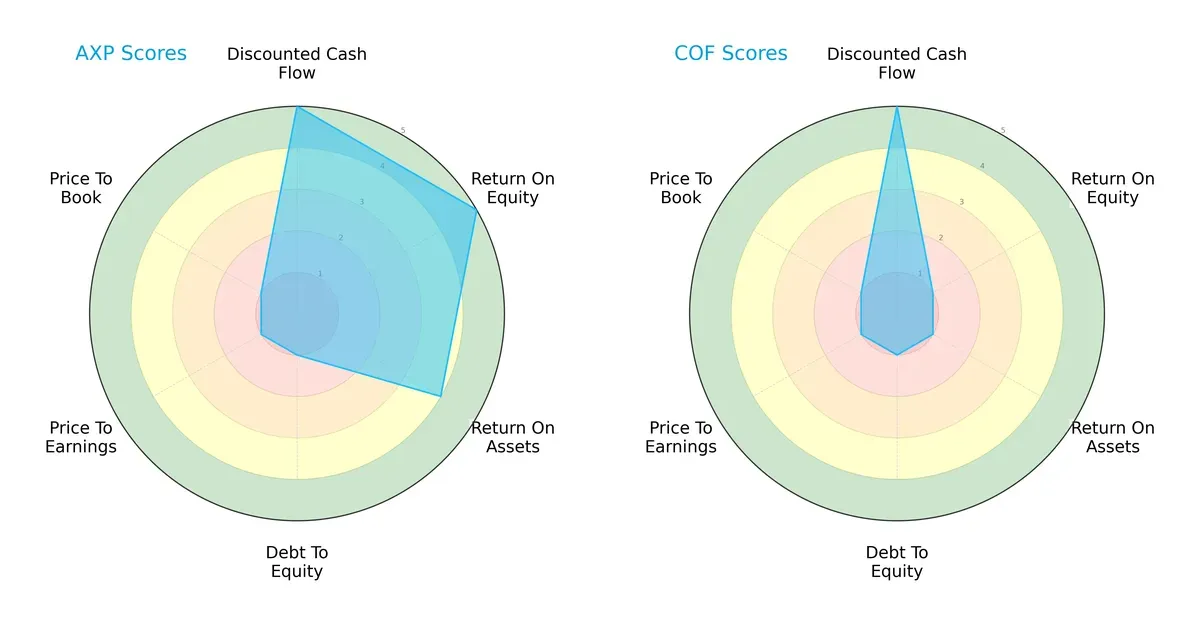
American Express exhibits strong profitability with high DCF, ROE, and ROA scores, yet struggles with leverage and valuation metrics. Capital One matches the DCF score but lags significantly in profitability and carries equally weak debt and valuation scores. I see American Express as having a more balanced profile, while Capital One relies heavily on discounted cash flow optimism despite operational weaknesses.
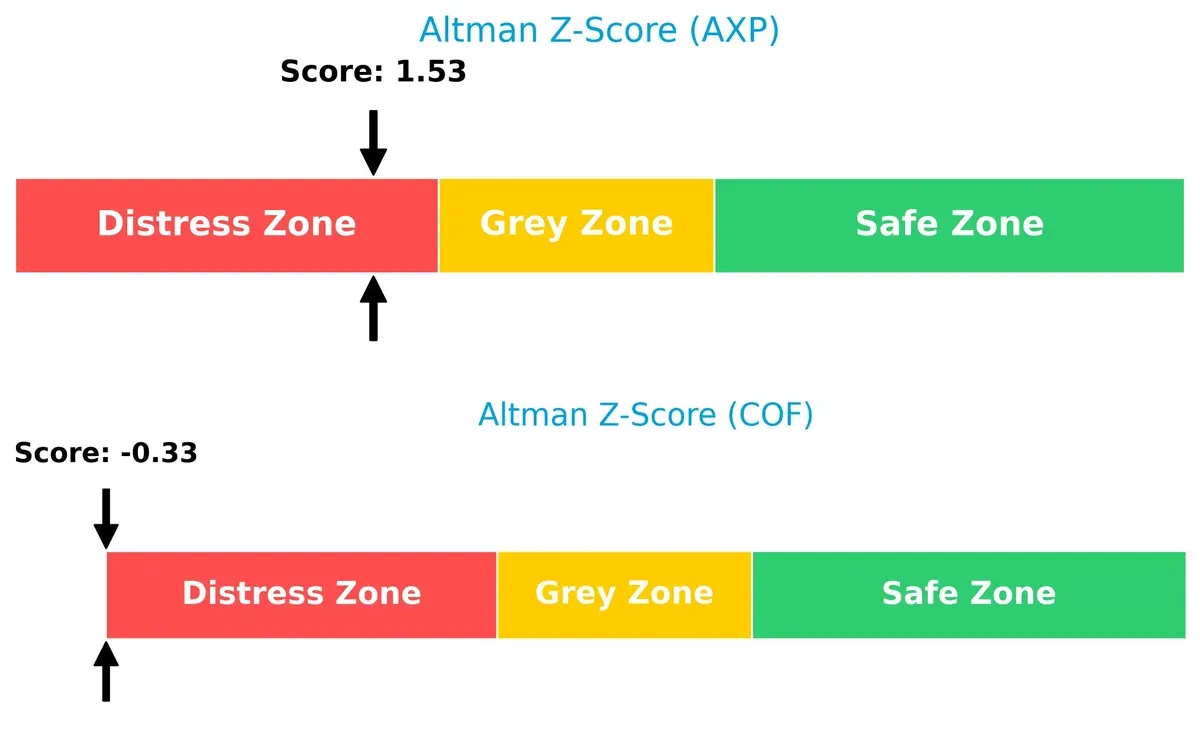
Bankruptcy Risk: Solvency Showdown
American Express’s Altman Z-Score of 1.53 surpasses Capital One’s -0.33, signaling relatively better long-term survival prospects despite both being in distress zones:
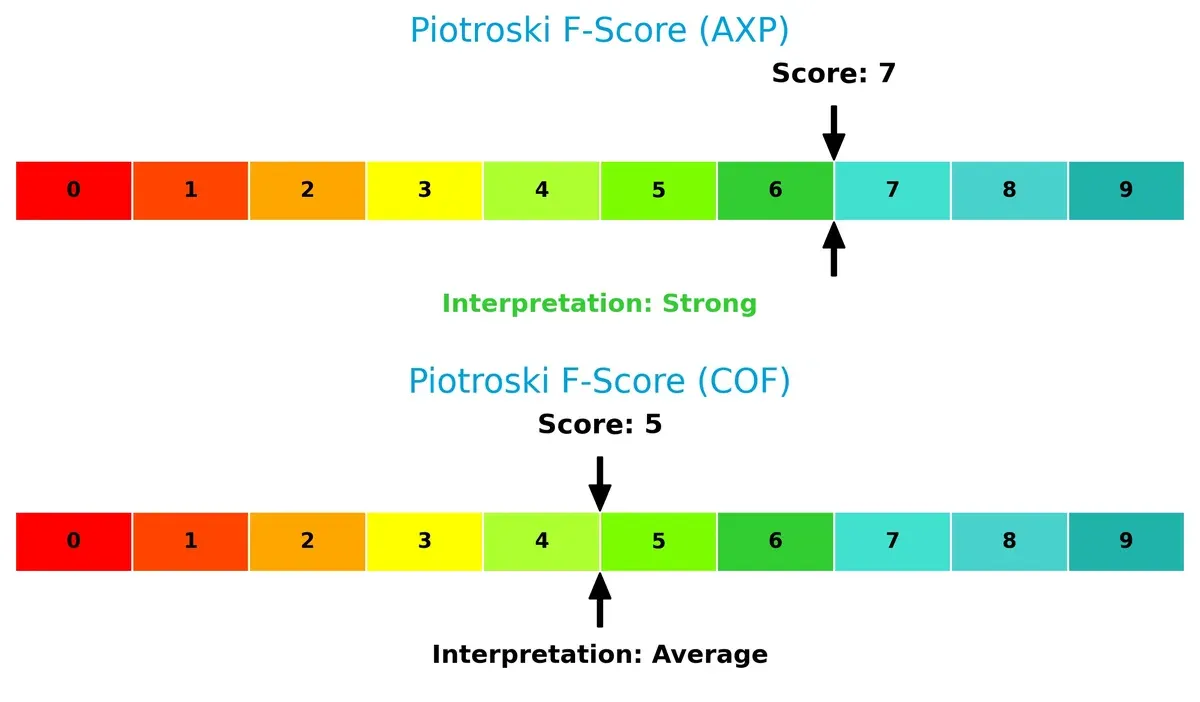
Financial Health: Quality of Operations
American Express scores a robust 7 on the Piotroski scale, indicating strong financial health. Capital One’s 5 suggests average operational quality with potential red flags:
How are the two companies positioned?
This section dissects the operational DNA of American Express and Capital One by comparing their revenue distribution and internal dynamics. The final objective is to confront their economic moats to identify which model offers the most resilient, sustainable competitive advantage today.
Revenue Segmentation: The Strategic Mix
This visual comparison dissects how American Express and Capital One diversify their income streams and where their primary sector bets lie:
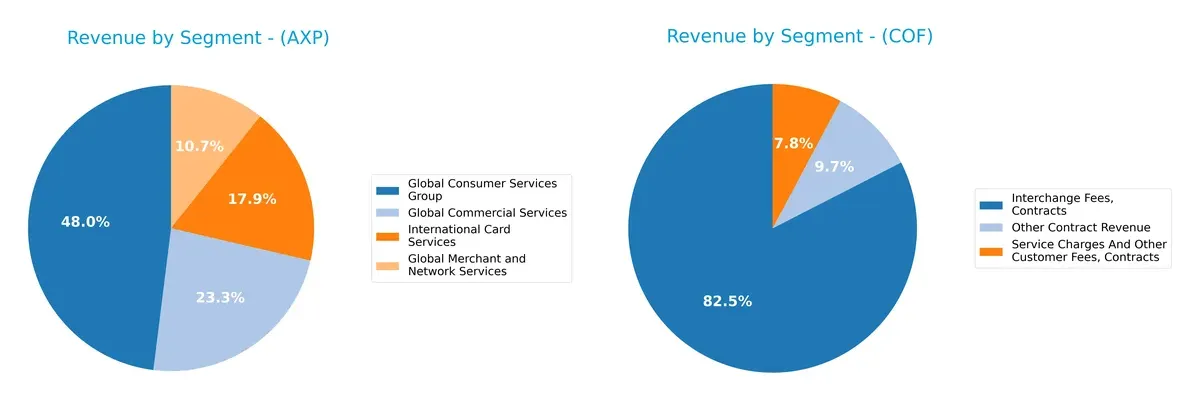
American Express anchors its revenue with a strong $34.8B Global Consumer Services Group, supported by $16.9B in Global Commercial Services and $13B in International Card Services, showing a well-distributed portfolio. In contrast, Capital One pivots heavily on its $25.7B Credit Card segment, with Consumer Banking at $9.3B and Commercial Banking at $3.5B, revealing higher concentration risk. American Express’s balanced mix supports ecosystem lock-in, while Capital One’s focus demands robust credit risk management.
Strengths and Weaknesses Comparison
This table compares the Strengths and Weaknesses of American Express Company and Capital One Financial Corporation:
American Express Company Strengths
- Diversified revenue streams across commercial, consumer, merchant, and international services
- Favorable net margin (13.39%) and high ROE (32.19%)
- Strong interest coverage ratio (5.91) indicates good debt serviceability
- Solid presence in the United States and international markets
Capital One Financial Corporation Strengths
- Favorable debt-to-equity ratio and debt-to-assets metrics
- Presence in multiple banking segments: credit card, consumer, and commercial banking
- Favorable price-to-book ratio suggests undervaluation
- Predominantly US-based revenue with modest international exposure
American Express Company Weaknesses
- Unfavorable ROIC (4.35%) below WACC (8.09%) signals weak capital efficiency
- High debt-to-equity ratio (1.73) raises leverage concerns
- Unfavorable current ratio (79.97) may indicate liquidity risks
- Low dividend yield (0.88%) might deter income-focused investors
- Asset turnover ratios are weak, suggesting inefficient asset use
Capital One Financial Corporation Weaknesses
- Unfavorable profitability metrics: net margin (3.54%), ROE, and ROIC both at zero
- Extremely weak liquidity ratios (current and quick ratios at 0)
- Very low interest coverage (0.07) signals potential solvency issues
- High P/E ratio (53.42) could imply overvaluation or poor earnings
- Limited international revenue and concentration in US market
Overall, American Express demonstrates stronger profitability and diversified revenue streams but faces challenges in capital efficiency and liquidity. Capital One struggles with profitability and liquidity, though it maintains favorable leverage metrics. These contrasts highlight differing strategic priorities and financial health between the two companies.
The Moat Duel: Analyzing Competitive Defensibility
A structural moat alone protects long-term profits from relentless competition and market pressures. Let’s dissect the competitive moats of two credit service giants:
American Express Company: Network Effects and Intangible Assets Moat
I see American Express’s moat rooted in its powerful network effects and brand loyalty. This fuels high margins and stable ROIC despite sector volatility. New premium card offerings and expanding global merchant services could deepen this moat in 2026.
Capital One Financial Corporation: Cost and Scale Advantage Moat
Capital One leverages scale and cost efficiency to compete, contrasting Amex’s brand moat. However, its declining ROIC and rising interest expenses signal weakening competitive strength. Expanding digital banking may offer growth but also exposes it to fintech disruption.
Moat Strength Battle: Network Effects vs. Cost Efficiency
American Express exhibits a deeper moat with strong brand and network advantages sustaining margins and profitability. Capital One’s moat is narrower, challenged by deteriorating returns and cost pressures. Amex is better positioned to defend market share long term.
Which stock offers better returns?
The past year shows strong price appreciation for both stocks, with American Express and Capital One experiencing notable gains and shifts in trading activity.
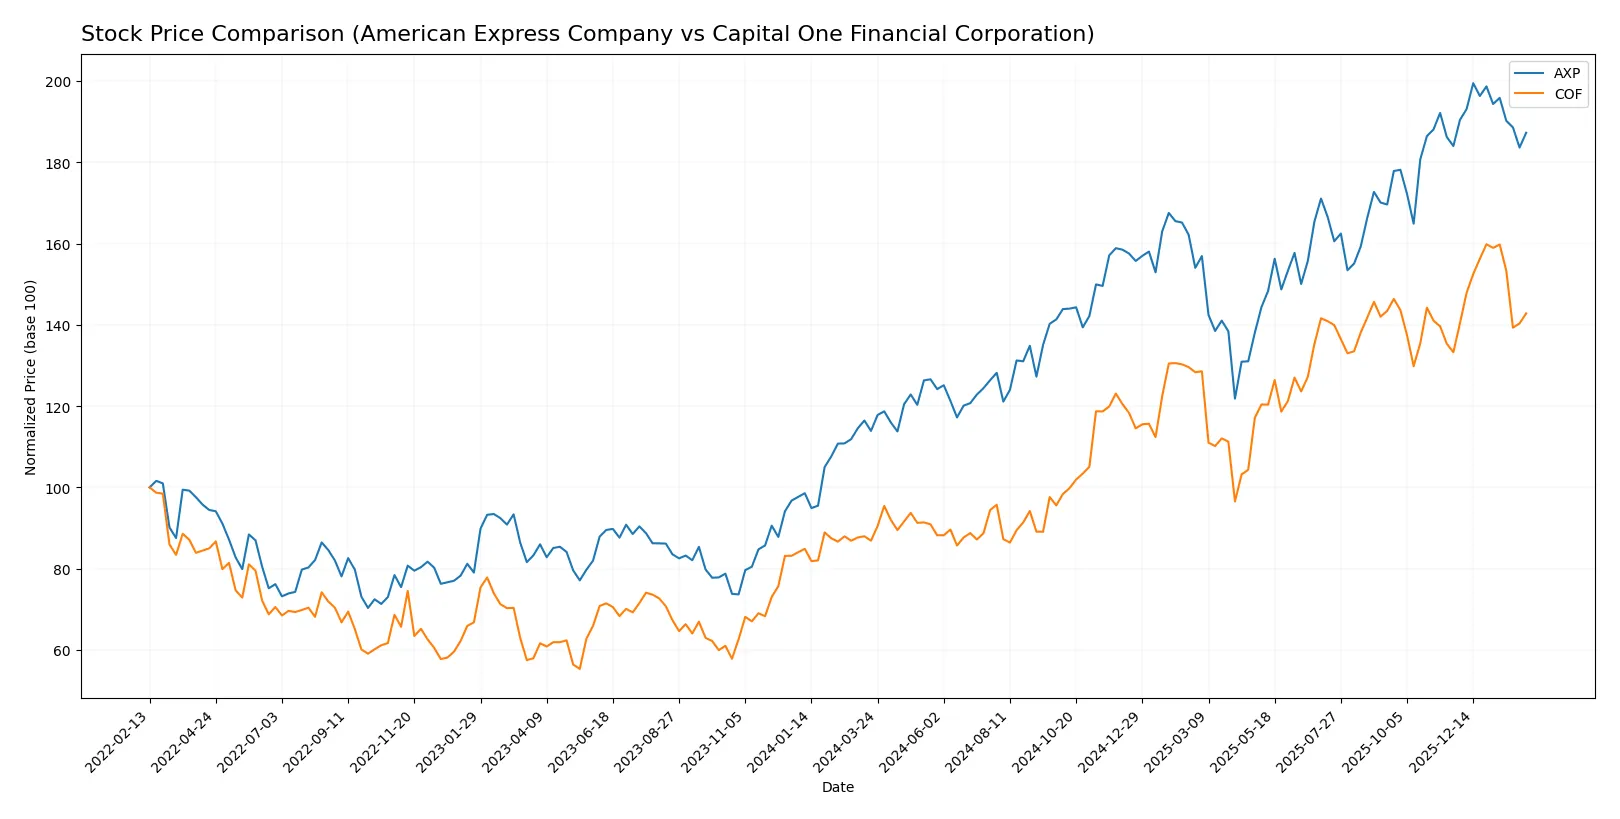
Trend Comparison
American Express’s stock rose 64.4% over the last 12 months, marking a clear bullish trend with decelerating momentum and a high volatility level of 45.81. The recent period shows a slight neutral trend.
Capital One’s stock increased 64.36% over the past year, also bullish but with decelerating momentum and lower volatility at 34.11. Its recent trend accelerated positively with a 7.18% gain.
Both stocks delivered nearly identical strong gains over 12 months; however, Capital One’s recent upward acceleration contrasts with American Express’s slight recent pullback.
Target Prices
Analysts present clear target price ranges for American Express Company and Capital One Financial Corporation, reflecting optimistic growth prospects.
| Company | Target Low | Target High | Consensus |
|---|---|---|---|
| American Express Company | 295 | 425 | 375.17 |
| Capital One Financial Corporation | 218 | 300 | 273.62 |
The consensus target prices for both companies exceed current market prices, suggesting analysts expect moderate to strong appreciation in the near term. American Express’s target consensus is about 4.5% above its current price of 359.15, while Capital One’s target is significantly higher than its current price of 222.79.

Don’t Let Luck Decide Your Entry Point
Optimize your entry points with our advanced ProRealTime indicators. You’ll get efficient buy signals with precise price targets for maximum performance. Start outperforming now!
How do institutions grade them?
Here is a summary of recent institutional grades for American Express Company and Capital One Financial Corporation:
American Express Company Grades
The following table lists recent official grades from established grading companies for American Express Company.
| Grading Company | Action | New Grade | Date |
|---|---|---|---|
| Truist Securities | Maintain | Buy | 2026-02-02 |
| JP Morgan | Maintain | Neutral | 2026-02-02 |
| BTIG | Maintain | Sell | 2026-02-02 |
| JP Morgan | Maintain | Neutral | 2026-01-12 |
| TD Cowen | Maintain | Hold | 2026-01-08 |
| Barclays | Maintain | Equal Weight | 2026-01-06 |
| Truist Securities | Maintain | Buy | 2025-12-22 |
| Wells Fargo | Maintain | Overweight | 2025-12-17 |
| Freedom Capital Markets | Upgrade | Hold | 2025-10-24 |
| Wells Fargo | Maintain | Overweight | 2025-10-20 |
Capital One Financial Corporation Grades
The following table lists recent official grades from established grading companies for Capital One Financial Corporation.
| Grading Company | Action | New Grade | Date |
|---|---|---|---|
| Truist Securities | Maintain | Buy | 2026-01-27 |
| Barclays | Maintain | Overweight | 2026-01-26 |
| BTIG | Maintain | Buy | 2026-01-23 |
| Morgan Stanley | Maintain | Overweight | 2026-01-20 |
| JP Morgan | Maintain | Neutral | 2026-01-12 |
| TD Cowen | Maintain | Buy | 2026-01-08 |
| Barclays | Maintain | Overweight | 2026-01-06 |
| Wells Fargo | Maintain | Overweight | 2026-01-05 |
| Keefe, Bruyette & Woods | Maintain | Outperform | 2026-01-02 |
| Citigroup | Maintain | Buy | 2025-12-31 |
Which company has the best grades?
Capital One Financial Corporation consistently receives stronger ratings, including multiple “Buy,” “Overweight,” and “Outperform” recommendations. American Express shows more mixed grades, ranging from “Buy” to “Sell.” This disparity may influence investor perception of relative strength.
Risks specific to each company
The following categories identify the critical pressure points and systemic threats facing both firms in the 2026 market environment:
1. Market & Competition
American Express Company
- Strong brand with diversified services but faces intense competition from fintech disruptors.
Capital One Financial Corporation
- Broad credit and banking services but lags in profitability amid competitive pressure.
2. Capital Structure & Debt
American Express Company
- Debt-to-equity ratio elevated at 1.73, signaling higher leverage risk.
Capital One Financial Corporation
- Debt metrics unavailable or zero, suggesting limited leverage but also possible data gaps.
3. Stock Volatility
American Express Company
- Beta of 1.13 indicates moderate sensitivity to market swings.
Capital One Financial Corporation
- Beta of 1.12 also signals moderate volatility, similar to sector peers.
4. Regulatory & Legal
American Express Company
- Global payment network exposed to evolving data protection and financial regulations.
Capital One Financial Corporation
- Multi-jurisdictional banking operations face complex regulatory compliance risks.
5. Supply Chain & Operations
American Express Company
- Relies on technological infrastructure for transaction processing; cyber risks present.
Capital One Financial Corporation
- Digital banking depends heavily on IT systems; operational disruptions could impact client services.
6. ESG & Climate Transition
American Express Company
- Increasing focus on sustainable finance but exposure to climate risk in travel sector.
Capital One Financial Corporation
- ESG initiatives underway but financial services sector faces scrutiny on social and governance fronts.
7. Geopolitical Exposure
American Express Company
- Global merchant network vulnerable to international trade tensions and currency fluctuations.
Capital One Financial Corporation
- Primarily US-focused but operations in Canada and UK expose it to geopolitical uncertainty.
Which company shows a better risk-adjusted profile?
American Express’s most impactful risk is its heavy leverage, raising solvency concerns despite strong profitability. Capital One struggles primarily with weak profitability and financial instability, reflected in distress signals from its Altman Z-Score and Piotroski Score. I see American Express as having a better risk-adjusted profile thanks to its robust operational metrics and stronger market positioning. However, its high debt-to-equity ratio warrants caution. Capital One’s financial distress indicators and poor return metrics highlight deeper structural risks, justifying investor wariness.
Final Verdict: Which stock to choose?
American Express’s superpower lies in its resilient brand and strong return on equity, signaling efficient profit generation. However, its declining ROIC and stretched valuation metrics are points of vigilance. This stock suits investors targeting Aggressive Growth with tolerance for margin pressure risks.
Capital One’s strategic moat is its ability to generate free cash flow, supported by improving revenue growth despite recent earnings volatility. It offers relatively better balance sheet safety but lacks the profitability scale of American Express. It fits a GARP (Growth at a Reasonable Price) profile for those seeking selective growth with moderate risk.
If you prioritize efficient capital allocation and strong earnings quality, American Express is the compelling choice due to its market leadership and robust profitability. However, if you seek better free cash flow yield and a more conservative valuation, Capital One offers superior cash flow generation and growth potential with more stability. Both come with risks, demanding careful portfolio fit assessment.
Disclaimer: Investment carries a risk of loss of initial capital. The past performance is not a reliable indicator of future results. Be sure to understand risks before making an investment decision.
Go Further
I encourage you to read the complete analyses of American Express Company and Capital One Financial Corporation to enhance your investment decisions: