Home > Comparison > Utilities > AEP vs XEL
The strategic rivalry between American Electric Power Company, Inc. and Xcel Energy Inc. shapes the utilities sector’s evolution. AEP operates as a vertically integrated electric utility, combining generation, transmission, and distribution. Xcel Energy blends regulated electric and natural gas utilities with renewable investments. This head-to-head contrasts scale and diversification against focused regional presence. This analysis will reveal which company offers a superior risk-adjusted profile for a diversified portfolio in 2026.
Table of contents
Companies Overview
American Electric Power and Xcel Energy stand as key players in the regulated electric market, shaping U.S. energy infrastructure.
American Electric Power Company, Inc.: Vertically Integrated Energy Giant
American Electric Power dominates as a vertically integrated utility, generating, transmitting, and distributing electricity across the U.S. Its revenue flows from multiple segments including Generation & Marketing and Transmission & Distribution. In 2026, AEP focuses on maintaining a balanced energy mix from coal to renewables, emphasizing reliability and scale in its core markets.
Xcel Energy Inc.: Diversified Regulated Utility Leader
Xcel Energy operates as a diversified regulated electric and natural gas utility, serving 3.7M electricity and 2.1M gas customers. It generates power from a broad portfolio including nuclear, solar, and biomass. Xcel’s 2026 strategy centers on expanding renewable infrastructure while integrating natural gas operations for steady growth across eight U.S. states.
Strategic Collision: Similarities & Divergences
Both companies emphasize regulated operations with a mix of fossil fuels and renewables. AEP pursues vertical integration, controlling generation through distribution. Xcel blends electric and natural gas utilities, leveraging cross-commodity synergies. Their battleground lies in renewable investment and regional dominance. AEP offers scale and integration, while Xcel presents a multi-commodity growth profile with diverse customer exposure.
Income Statement Comparison
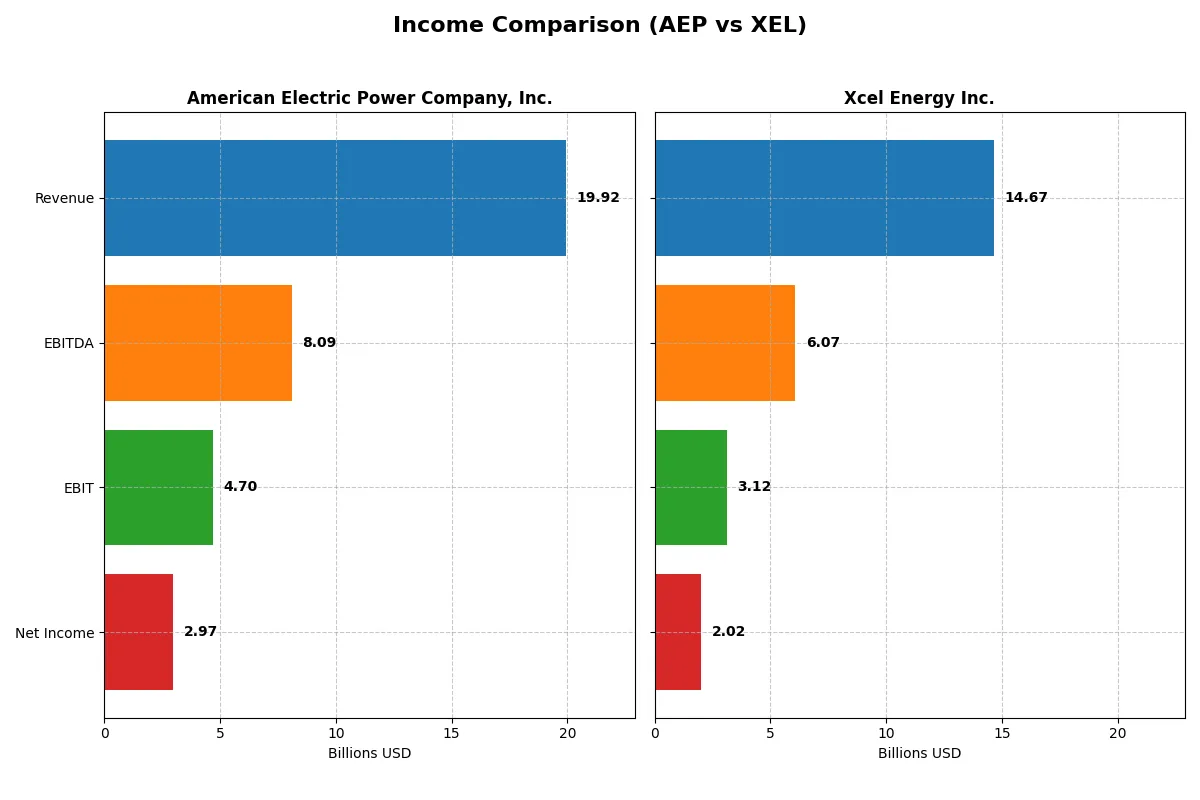
This data dissects the core profitability and scalability of both corporate engines to reveal who dominates the bottom line:
| Metric | American Electric Power Company, Inc. (AEP) | Xcel Energy Inc. (XEL) |
|---|---|---|
| Revenue | 19.9B | 13.4B |
| Cost of Revenue | 13.6B | 7.3B |
| Operating Expenses | 1.6B | 3.8B |
| Gross Profit | 6.4B | 6.1B |
| EBITDA | 8.1B | 5.6B |
| EBIT | 4.7B | 2.7B |
| Interest Expense | 1.9B | 1.2B |
| Net Income | 3.0B | 1.9B |
| EPS | 5.6 | 3.44 |
| Fiscal Year | 2024 | 2024 |
Income Statement Analysis: The Bottom-Line Duel
This income statement comparison uncovers the true operational efficiency and profitability momentum of two major utility companies.
American Electric Power Company, Inc. Analysis
American Electric Power (AEP) shows consistent revenue growth, reaching $19.9B in 2024, up 2.8% from 2023. Net income surged 34.9% over five years to $3B, supported by a strong gross margin near 32% and a robust net margin of 14.9%. Its EBIT margin of 23.6% signals operational strength, with recent years reflecting improved profitability and EPS growth exceeding 30%.
Xcel Energy Inc. Analysis
Xcel Energy (XEL) increased revenue 9.1% to $14.7B in 2025, outpacing AEP’s top-line growth rate in the latest year. Despite this, XEL’s gross margin contracted sharply from prior years, dipping to 24.3%, while net margin held at 13.8%. EBIT margin stands at 21.2%, slightly below AEP’s. Net income growth is healthy over the long term but showed a slight decline in margin and EPS last year, indicating margin pressure.
Margin Power vs. Revenue Scale
AEP leads with superior margin expansion and higher absolute net income, demonstrating greater profit efficiency. XEL delivers stronger recent revenue growth but struggles to maintain margin stability. Investors seeking reliable margin improvement and earnings momentum will favor AEP’s profile, while XEL appeals to those prioritizing top-line expansion despite margin volatility.
Financial Ratios Comparison
These vital ratios act as a diagnostic tool to expose the underlying fiscal health, valuation premiums, and capital efficiency of the companies compared:
| Ratios | American Electric Power Company, Inc. (AEP) | Xcel Energy Inc. (XEL) |
|---|---|---|
| ROE | 11.0% (2024) | 9.9% (2024) |
| ROIC | 4.96% (2024) | 3.64% (2024) |
| P/E | 16.5 (2024) | 19.6 (2024) |
| P/B | 1.81 (2024) | 1.95 (2024) |
| Current Ratio | 0.44 (2024) | 0.67 (2024) |
| Quick Ratio | 0.31 (2024) | 0.57 (2024) |
| D/E | 1.70 (2024) | 1.55 (2024) |
| Debt-to-Assets | 44.4% (2024) | 43.1% (2024) |
| Interest Coverage | 2.56 (2024) | 2.02 (2024) |
| Asset Turnover | 0.19 (2024) | 0.19 (2024) |
| Fixed Asset Turnover | 0.24 (2024) | 0.23 (2024) |
| Payout ratio | 64.2% (2024) | 60.7% (2024) |
| Dividend yield | 3.89% (2024) | 3.09% (2024) |
| Fiscal Year | 2024 | 2024 |
Efficiency & Valuation Duel: The Vital Signs
Financial ratios act as a company’s DNA, unveiling hidden risks and operational strengths that drive investment decisions.
American Electric Power Company, Inc.
American Electric Power posts a solid net margin of 14.9% and an ROE at 11%, signaling decent profitability. Its P/E of 16.5 marks the stock as fairly valued, neither cheap nor stretched. The firm supports shareholders with a 3.9% dividend yield, reflecting a steady income focus amid moderate reinvestment needs.
Xcel Energy Inc.
Xcel Energy shows a favorable net margin of 13.8%, but its ROE and ROIC are unavailable, clouding profitability insights. The P/E ratio stands at 21.5, suggesting a valuation premium versus peers. It offers a competitive 3.8% dividend yield, prioritizing shareholder returns despite limited data on operational efficiency.
Balanced Yield vs. Valuation Ambiguity
American Electric Power balances steady profitability with a reasonable valuation and strong dividend yield. Xcel Energy’s higher P/E and missing efficiency metrics raise questions despite a similar dividend payout. Investors seeking clearer operational visibility may favor AEP, while those tolerating valuation premiums might consider XEL’s yield profile.
Which one offers the Superior Shareholder Reward?
American Electric Power (AEP) offers a more compelling shareholder reward than Xcel Energy (XEL) in 2026. AEP yields 3.9% with a payout ratio near 64%, supported by strong free cash flow of $12.6/share, ensuring dividend sustainability. Its buybacks intensify returns, reflecting disciplined capital allocation. XEL pays a 3.1% dividend at a similar payout ratio but struggles with negative free cash flow, indicating weaker dividend coverage. XEL’s smaller buyback activity limits total return upside. Historically, AEP’s model balances income and capital return more sustainably, making it my preferred choice for total shareholder return.
Comparative Score Analysis: The Strategic Profile
The radar chart unveils the fundamental DNA and trade-offs of American Electric Power Company, Inc. and Xcel Energy Inc. across key financial dimensions:
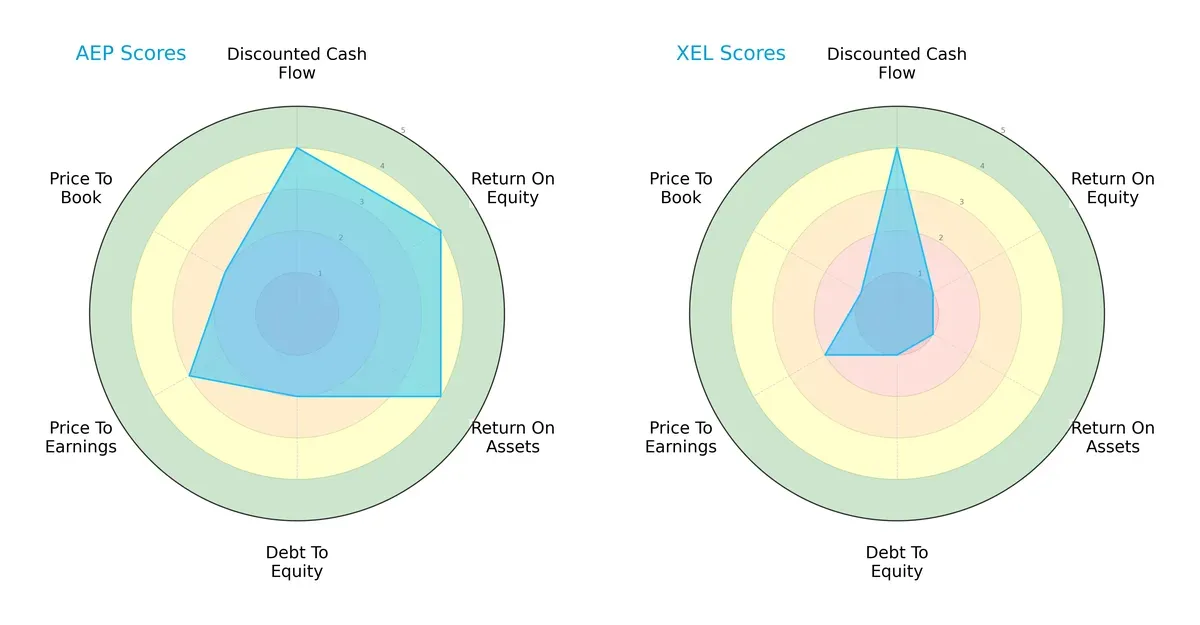
American Electric Power (AEP) shows a balanced profile with strong DCF, ROE, and ROA scores, signaling efficient capital use and profitability. However, its debt-to-equity and price-to-book scores indicate some leverage risks and valuation concerns. Xcel Energy (XEL) relies heavily on its DCF strength but suffers from weak profitability and high leverage, reflected in poor ROE, ROA, and debt-to-equity scores. AEP’s more diversified strengths make it the sturdier choice.
Bankruptcy Risk: Solvency Showdown
American Electric Power’s Altman Z-Score of 1.02 places it in the distress zone, signaling high bankruptcy risk in this cycle. Data for Xcel Energy’s Z-Score is unavailable, limiting direct solvency comparison:

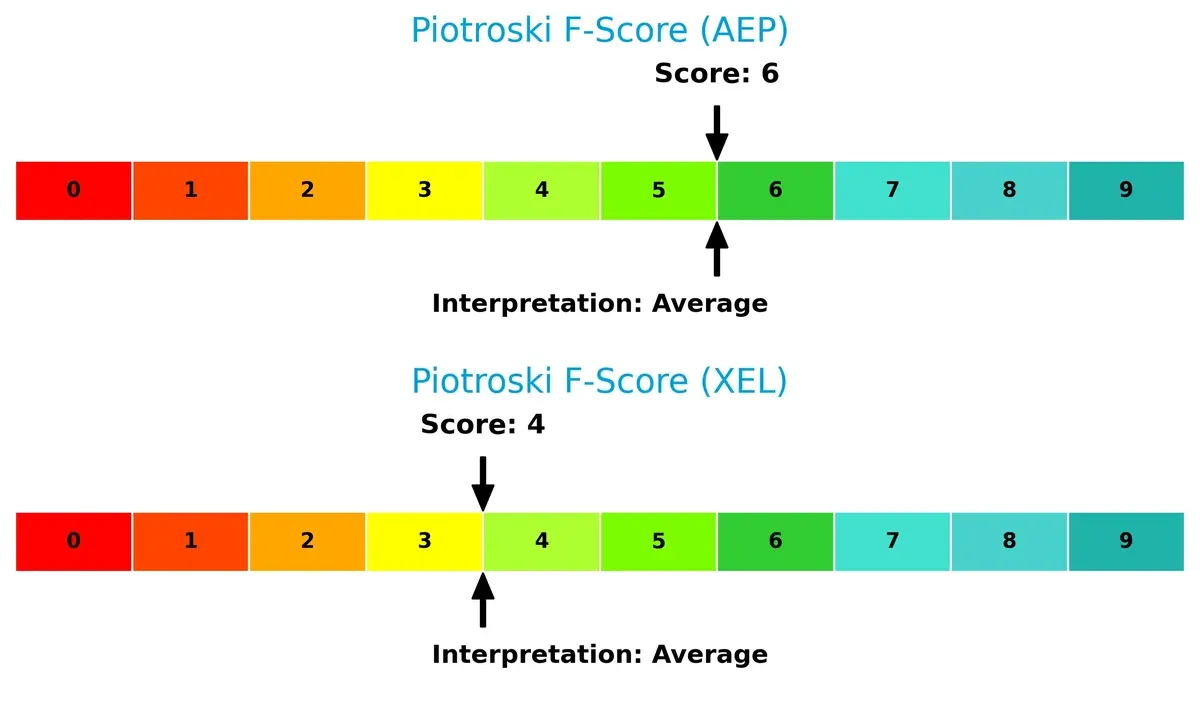
Financial Health: Quality of Operations
Both companies exhibit average Piotroski F-Scores, with AEP at 6 and XEL at 4. AEP’s higher score reflects stronger internal financial controls and operational quality, while Xcel’s lower score flags potential weaknesses:
How are the two companies positioned?
This section dissects the operational DNA of AEP and XEL by comparing their revenue mix and internal strengths and weaknesses. The goal is to confront their economic moats and identify which model offers the most resilient, sustainable competitive advantage today.
Revenue Segmentation: The Strategic Mix
The following visual comparison dissects how American Electric Power Company, Inc. and Xcel Energy Inc. diversify their income streams and where their primary sector bets lie:
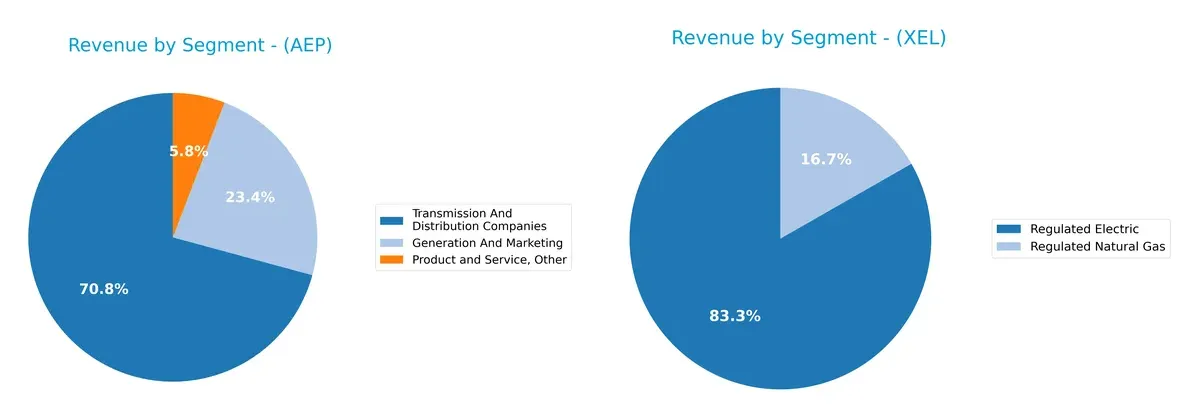
American Electric Power leans heavily on Transmission And Distribution Companies, generating $5.88B in 2024, dwarfing its Generation And Marketing segment at $1.94B. This concentration anchors AEP’s infrastructure dominance but exposes it to regulatory risks. Xcel Energy, by contrast, pivots on Regulated Electric at $22.3B and Regulated Natural Gas at $4.48B, showing a more balanced spread. Xcel’s diversification reduces concentration risk while leveraging regulated market stability.
Strengths and Weaknesses Comparison
This table compares the Strengths and Weaknesses of American Electric Power Company, Inc. (AEP) and Xcel Energy Inc. (XEL):
AEP Strengths
- Favorable net margin at 14.9%
- WACC at 5.57% below ROIC
- Dividend yield at 3.89% supports income investors
- Diverse revenue streams including generation, marketing, transmission
- Neutral ROE indicates steady profitability
- Neutral debt to assets at 44.4%
XEL Strengths
- Favorable net margin at 13.76%
- Favorable debt-to-equity and debt-to-assets ratios indicate financial conservatism
- Dividend yield at 3.83% supports shareholder returns
- Favorable price-to-book ratio improves valuation appeal
- Neutral interest coverage ratio
AEP Weaknesses
- Low current and quick ratios signal liquidity risks
- High debt-to-equity at 1.7 raises leverage concerns
- ROIC below WACC at 4.96% implies weak capital efficiency
- Unfavorable asset turnover ratios suggest inefficient asset use
- Neutral interest coverage at 2.53 limits debt service margin
XEL Weaknesses
- Zero or unavailable ROE and ROIC indicate profitability challenges
- Unavailable WACC limits cost of capital assessment
- Zero current and quick ratios pose liquidity red flags
- Zero asset turnover ratios highlight operational inefficiencies
- Neutral interest coverage at 2.32 shows modest debt service ability
Both companies show slightly unfavorable overall ratio profiles, with AEP demonstrating better profitability and capital structure but weaker liquidity. XEL exhibits stronger leverage metrics but significant profitability and liquidity concerns. These factors suggest differing strategic priorities in financial management and operational efficiency.
The Moat Duel: Analyzing Competitive Defensibility
A structural moat alone shields long-term profits from relentless competitive pressure and market erosion. Let’s dissect how these two utilities defend their turf:
American Electric Power Company, Inc. (AEP): Resilient Asset Base and Operational Efficiency
AEP’s moat stems from its vertical integration and regulated asset base, driving stable margins and improving ROIC despite current value destruction. Its growing profitability signals potential moat strengthening through renewable investments in 2026.
Xcel Energy Inc. (XEL): Diversified Energy Mix and Customer Reach
Xcel counters with a broad fuel portfolio and multi-state regulated presence, supporting solid EBIT margins. However, declining ROIC trend signals emerging efficiency challenges, though expansion in renewables offers upside disruption potential.
Regulated Asset Stability vs. Operational Efficiency Trends
AEP’s slightly unfavorable moat shows value erosion but improving returns, while XEL’s declining ROIC trend clouds its moat strength. I see AEP holding a deeper moat, better positioned to defend and grow market share in 2026.
Which stock offers better returns?
The stock price trends of American Electric Power Company, Inc. and Xcel Energy Inc. reveal significant yearly gains followed by contrasting recent momentum shifts.
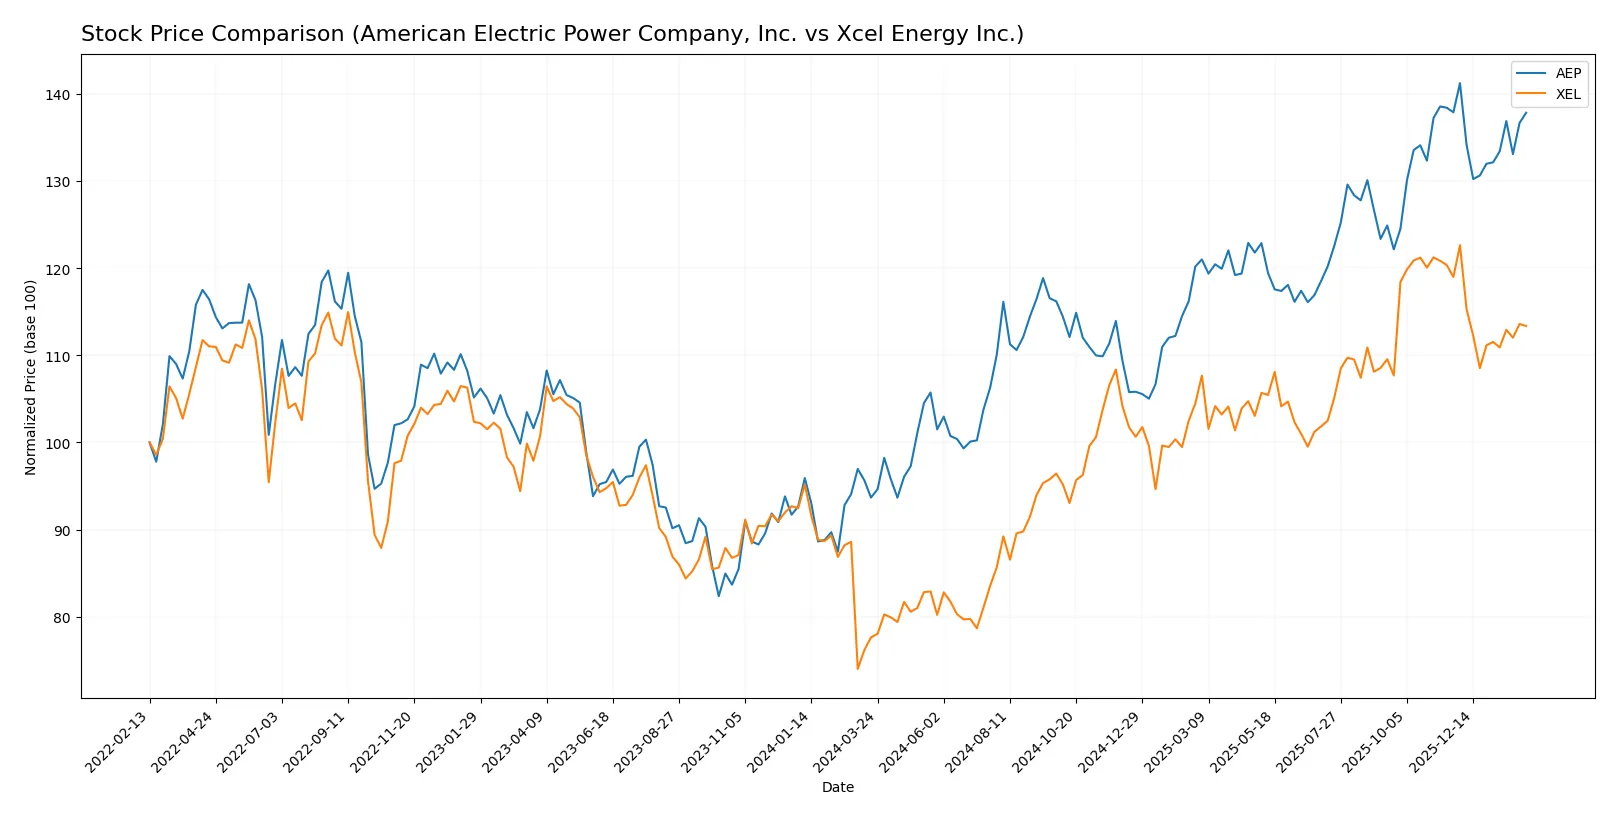
Trend Comparison
American Electric Power Company, Inc. shows a strong 47.12% price increase over the past year, indicating a bullish trend with decelerating momentum and a high volatility of 10.52%.
Xcel Energy Inc. also posts a bullish trend with a 45.99% gain over the year but faces a sharper recent decline of 4.73%, signaling deceleration and volatility at 8.24%.
Comparing both, American Electric Power delivered the highest yearly returns with stronger buyer dominance recently, while Xcel Energy exhibits weaker short-term performance and seller dominance.
Target Prices
Analysts show a constructive outlook for both American Electric Power Company and Xcel Energy.
| Company | Target Low | Target High | Consensus |
|---|---|---|---|
| American Electric Power Company, Inc. | 107 | 140 | 128.36 |
| Xcel Energy Inc. | 81 | 95 | 88 |
The consensus target for AEP stands about 6% above its current price of 120.8, signaling moderate upside potential. XEL’s consensus target at 88 suggests a roughly 16% premium to its current 75.9 price, reflecting stronger expected appreciation.

Don’t Let Luck Decide Your Entry Point
Optimize your entry points with our advanced ProRealTime indicators. You’ll get efficient buy signals with precise price targets for maximum performance. Start outperforming now!
How do institutions grade them?
Here is a comparison of recent institutional grades for American Electric Power Company, Inc. and Xcel Energy Inc.:
American Electric Power Company, Inc. Grades
The table below shows recent grades assigned to American Electric Power by major institutions.
| Grading Company | Action | New Grade | Date |
|---|---|---|---|
| Barclays | Maintain | Equal Weight | 2026-01-22 |
| Wells Fargo | Maintain | Overweight | 2026-01-20 |
| B of A Securities | Downgrade | Neutral | 2026-01-12 |
| UBS | Maintain | Sell | 2025-12-17 |
| JP Morgan | Maintain | Neutral | 2025-12-12 |
| Jefferies | Upgrade | Buy | 2025-11-17 |
| Citigroup | Maintain | Neutral | 2025-10-31 |
| BMO Capital | Downgrade | Market Perform | 2025-10-30 |
| Scotiabank | Maintain | Sector Perform | 2025-10-30 |
| Wells Fargo | Maintain | Overweight | 2025-10-30 |
Xcel Energy Inc. Grades
Below are recent institutional grades for Xcel Energy from key grading firms.
| Grading Company | Action | New Grade | Date |
|---|---|---|---|
| Barclays | Maintain | Overweight | 2026-01-15 |
| UBS | Maintain | Neutral | 2025-12-17 |
| Keybanc | Maintain | Overweight | 2025-12-12 |
| JP Morgan | Maintain | Overweight | 2025-12-11 |
| Barclays | Maintain | Overweight | 2025-11-05 |
| Citigroup | Maintain | Buy | 2025-11-03 |
| UBS | Maintain | Neutral | 2025-10-31 |
| Mizuho | Maintain | Outperform | 2025-10-27 |
| Jefferies | Maintain | Buy | 2025-10-16 |
| Keybanc | Maintain | Overweight | 2025-10-15 |
Which company has the best grades?
Xcel Energy consistently receives more overweight and buy ratings than American Electric Power. This suggests stronger institutional confidence, which may attract more investors.
Risks specific to each company
The following categories identify the critical pressure points and systemic threats facing both firms in the 2026 market environment:
1. Market & Competition
American Electric Power Company, Inc. (AEP)
- Faces pressure from shifting energy mix and regulatory demands on coal and gas use.
Xcel Energy Inc. (XEL)
- Competes in diverse regional markets with increasing renewable energy penetration.
2. Capital Structure & Debt
AEP
- High debt-to-equity (1.7) and weak liquidity ratios raise concerns over financial flexibility.
XEL
- Debt metrics unavailable but rated favorable; however, low coverage ratio (2.32) signals moderate risk.
3. Stock Volatility
AEP
- Beta of 0.623 implies moderate stock volatility, below utility sector average.
XEL
- Lower beta at 0.476 reflects more stable stock behavior amid market swings.
4. Regulatory & Legal
AEP
- Subject to stringent U.S. environmental regulations impacting coal usage and emissions.
XEL
- Faces similar regulatory pressures plus natural gas pipeline regulations adding complexity.
5. Supply Chain & Operations
AEP
- Vertically integrated operations offer control but expose to operational inefficiencies (low asset turnover).
XEL
- Operations spread over multiple states, increasing supply chain complexity and execution risk.
6. ESG & Climate Transition
AEP
- Transitioning energy portfolio; coal reliance is a climate risk amid accelerating ESG pressures.
XEL
- More diversified renewables portfolio positions XEL better for clean energy transition.
7. Geopolitical Exposure
AEP
- Primarily U.S. focused, limiting direct geopolitical risk but sensitive to federal energy policies.
XEL
- U.S. regional exposure reduces geopolitical risk but state-level policy shifts remain a factor.
Which company shows a better risk-adjusted profile?
AEP’s greatest risk lies in its stretched capital structure and liquidity constraints. For XEL, poor profitability metrics and unclear debt data raise red flags. Despite this, XEL’s lower stock volatility and stronger ESG positioning offer a more balanced risk profile. Notably, AEP’s Altman Z-Score in the distress zone underscores urgent financial stability concerns.
Final Verdict: Which stock to choose?
American Electric Power Company, Inc. (AEP) stands out as a reliable cash engine with steadily improving profitability despite its challenge of operating with tight liquidity. This efficiency makes it suitable for investors seeking steady income and moderate growth within a diversified portfolio. Its slight value destruction signals caution but not alarm.
Xcel Energy Inc. (XEL) boasts a strategic moat grounded in its consistent revenue base and prudent capital structure, offering a comparatively safer profile than AEP. Its stability and reasonable valuation appeal to investors favoring measured growth and income stability, fitting well into a GARP (Growth at a Reasonable Price) strategy.
If you prioritize consistent cash generation and improving profitability, AEP is the compelling choice due to its operational efficiencies and favorable income trends. However, if you seek better financial stability with a defensive tilt, XEL offers superior capital structure and a steadier safety profile. Both present analytical scenarios for distinct investor profiles rather than definitive selections.
Disclaimer: Investment carries a risk of loss of initial capital. The past performance is not a reliable indicator of future results. Be sure to understand risks before making an investment decision.
Go Further
I encourage you to read the complete analyses of American Electric Power Company, Inc. and Xcel Energy Inc. to enhance your investment decisions: