In the evolving utilities sector, American Electric Power Company, Inc. (AEP) and WEC Energy Group, Inc. (WEC) stand out as key players in regulated electric services. Both companies serve overlapping markets with diversified energy sources and emphasize innovation in clean and reliable power generation. This comparison explores their strengths and strategies to help you decide which stock aligns best with your investment goals in 2026. Let’s uncover which company offers the most compelling opportunity.
Table of contents
Companies Overview
I will begin the comparison between American Electric Power Company, Inc. and WEC Energy Group, Inc. by providing an overview of these two companies and their main differences.
American Electric Power Company, Inc. Overview
American Electric Power Company, Inc. is a regulated electric utility holding company engaged in the generation, transmission, and distribution of electricity in the US. It operates through multiple segments including vertically integrated utilities and transmission, using diverse energy sources such as coal, natural gas, nuclear, hydro, solar, and wind. Founded in 1906 and headquartered in Columbus, Ohio, AEP is a major player in the US utilities sector.
WEC Energy Group, Inc. Overview
WEC Energy Group, Inc. provides regulated natural gas, electricity, and renewable energy services through six operating segments across multiple states. It generates electricity from coal, natural gas, oil, hydro, wind, solar, and biomass, and operates extensive electric and natural gas infrastructure. Incorporated in 1981 and based in Milwaukee, Wisconsin, WEC focuses on delivering reliable energy services while managing significant transmission and distribution assets.
Key similarities and differences
Both AEP and WEC operate in the regulated electric utilities industry in the US, generating electricity from a mix of traditional and renewable sources. AEP is larger by market cap and employee count, with a vertically integrated business model, while WEC emphasizes a diversified portfolio across electricity, natural gas, and renewable segments. WEC operates more extensive natural gas infrastructure, whereas AEP has a broader generation and transmission footprint.
Income Statement Comparison
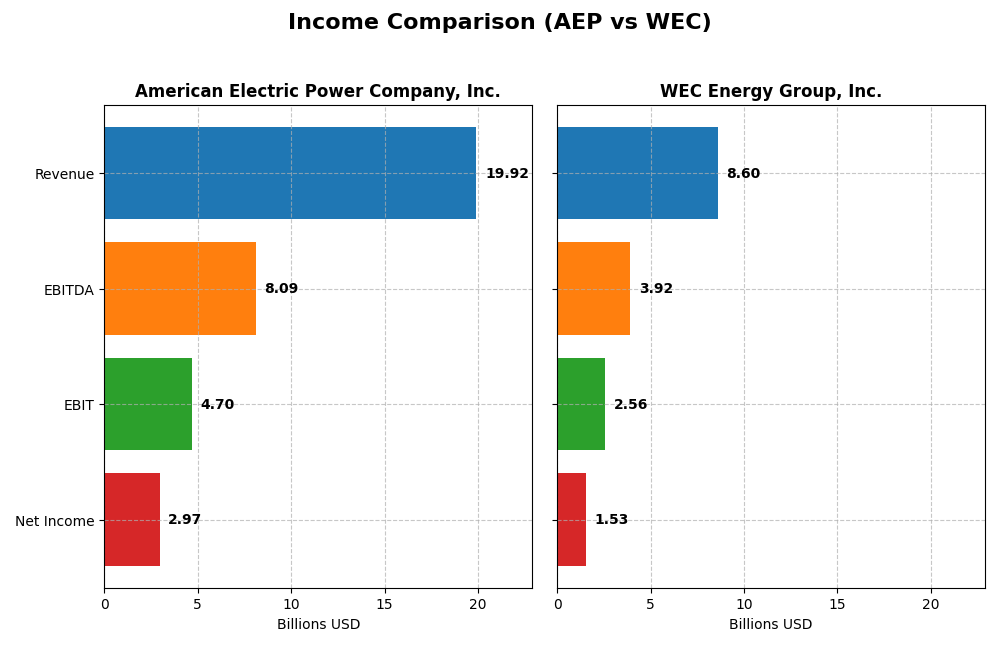
The table below presents a side-by-side comparison of the key income statement metrics for American Electric Power Company, Inc. (AEP) and WEC Energy Group, Inc. (WEC) for the fiscal year 2024.
| Metric | American Electric Power Company, Inc. (AEP) | WEC Energy Group, Inc. (WEC) |
|---|---|---|
| Market Cap | 62.6B | 33.5B |
| Revenue | 19.9B | 8.6B |
| EBITDA | 8.1B | 3.9B |
| EBIT | 4.7B | 2.6B |
| Net Income | 3.0B | 1.5B |
| EPS | 5.60 | 4.81 |
| Fiscal Year | 2024 | 2024 |
Income Statement Interpretations
American Electric Power Company, Inc.
From 2020 to 2024, AEP’s revenue increased steadily by 33.6%, with net income growing by 34.9%, indicating consistent profitability. Gross and EBIT margins remain favorable at 31.9% and 23.6%, respectively, with net margin near 14.9%. In 2024, revenue growth slowed to 2.8%, yet gross profit and EBIT expanded, and net margin improved significantly, reflecting operational efficiency.
WEC Energy Group, Inc.
WEC showed an overall revenue growth of 18.8% and net income growth of 27.3% from 2020 to 2024. Margins are strong, with gross margin at 44.0%, EBIT margin at 29.8%, and net margin at 17.8%, all favorable. Although revenue declined 3.3% in 2024, gross profit, EBIT, net margin, and EPS all increased, suggesting improved cost management and profitability despite top-line pressures.
Which one has the stronger fundamentals?
Both companies exhibit favorable income statement fundamentals, with WEC leading in margin levels and a higher proportion of favorable growth metrics. AEP shows stronger revenue growth but experienced a recent slowdown. WEC’s ability to increase profitability amid declining revenue in 2024 highlights resilience. Overall, WEC presents slightly stronger margin profiles and consistent earnings improvement.
Financial Ratios Comparison
The table below presents the most recent financial ratios for American Electric Power Company, Inc. (AEP) and WEC Energy Group, Inc. (WEC) based on their 2024 fiscal year data, providing a snapshot of their performance and financial health.
| Ratios | American Electric Power Company, Inc. (AEP) | WEC Energy Group, Inc. (WEC) |
|---|---|---|
| ROE | 11.0% | 12.3% |
| ROIC | 4.96% | 4.14% |
| P/E | 16.48 | 19.46 |
| P/B | 1.81 | 2.39 |
| Current Ratio | 0.44 | 0.60 |
| Quick Ratio | 0.31 | 0.43 |
| D/E | 1.70 | 1.64 |
| Debt-to-Assets | 44.4% | 42.9% |
| Interest Coverage | 2.56 | 2.64 |
| Asset Turnover | 0.19 | 0.18 |
| Fixed Asset Turnover | 0.24 | 0.25 |
| Payout ratio | 64.2% | 69.1% |
| Dividend yield | 3.89% | 3.55% |
Interpretation of the Ratios
American Electric Power Company, Inc.
American Electric Power shows a mixed ratio profile with a favorable net margin of 14.9% but an unfavorable return on invested capital at 4.96%. Its liquidity ratios are weak, with a current ratio of 0.44 and quick ratio of 0.31, and leverage remains a concern with a debt-to-equity ratio of 1.7. The dividend yield stands at a favorable 3.89%, supported by consistent payouts, but coverage by free cash flow is tight, signaling caution on sustainability.
WEC Energy Group, Inc.
WEC Energy Group presents a slightly better net margin of 17.77% and similar challenges with an unfavorable ROIC of 4.14%. Liquidity ratios remain below 1, with a current ratio of 0.6 and quick ratio of 0.43, while debt levels are comparable to its peer. The dividend yield is 3.55%, also favorable, supported by steady dividends and moderate payout risk. Interest coverage is slightly higher than AEP, indicating marginally better debt serviceability.
Which one has the best ratios?
Both American Electric Power and WEC Energy Group share a slightly unfavorable overall ratio profile, each facing liquidity and asset turnover weaknesses. While WEC has a marginally higher net margin and interest coverage, AEP’s dividend yield is slightly superior. Neither company demonstrates a clear advantage, reflecting balanced strengths and risks in their financial ratios.
Strategic Positioning
This section compares the strategic positioning of American Electric Power Company, Inc. (AEP) and WEC Energy Group, Inc. (WEC) regarding market position, key segments, and exposure to technological disruption:
American Electric Power Company, Inc. (AEP)
- Large market cap near 63B, operating across generation, transmission, distribution with moderate beta
- Key segments include vertically integrated utilities, transmission & distribution, and generation & marketing
- Uses a diverse mix of energy sources including coal, gas, nuclear, hydro, solar, and wind
WEC Energy Group, Inc. (WEC)
- Smaller market cap about 33B, focused on regulated electric and gas utilities with low beta
- Key segments cover regional utility operations in Wisconsin, Illinois, other states, plus non-utility energy infrastructure
- Generates and distributes electricity and gas from coal, gas, oil, hydro, wind, solar, biomass with regulated transmission
AEP vs WEC Positioning
AEP adopts a diversified strategy spanning vertically integrated utilities and various energy sources, offering broad market coverage but facing complex operational demands. WEC concentrates regionally on regulated electric and gas services, with less scale but focused infrastructure, balancing diversification with specialization.
Which has the best competitive advantage?
Both companies show slightly unfavorable MOAT status, shedding value but with growing ROIC trends. AEP’s larger scale and diversified segments contrast with WEC’s regional focus and infrastructure strength, reflecting differing but similarly challenged competitive advantages.
Stock Comparison
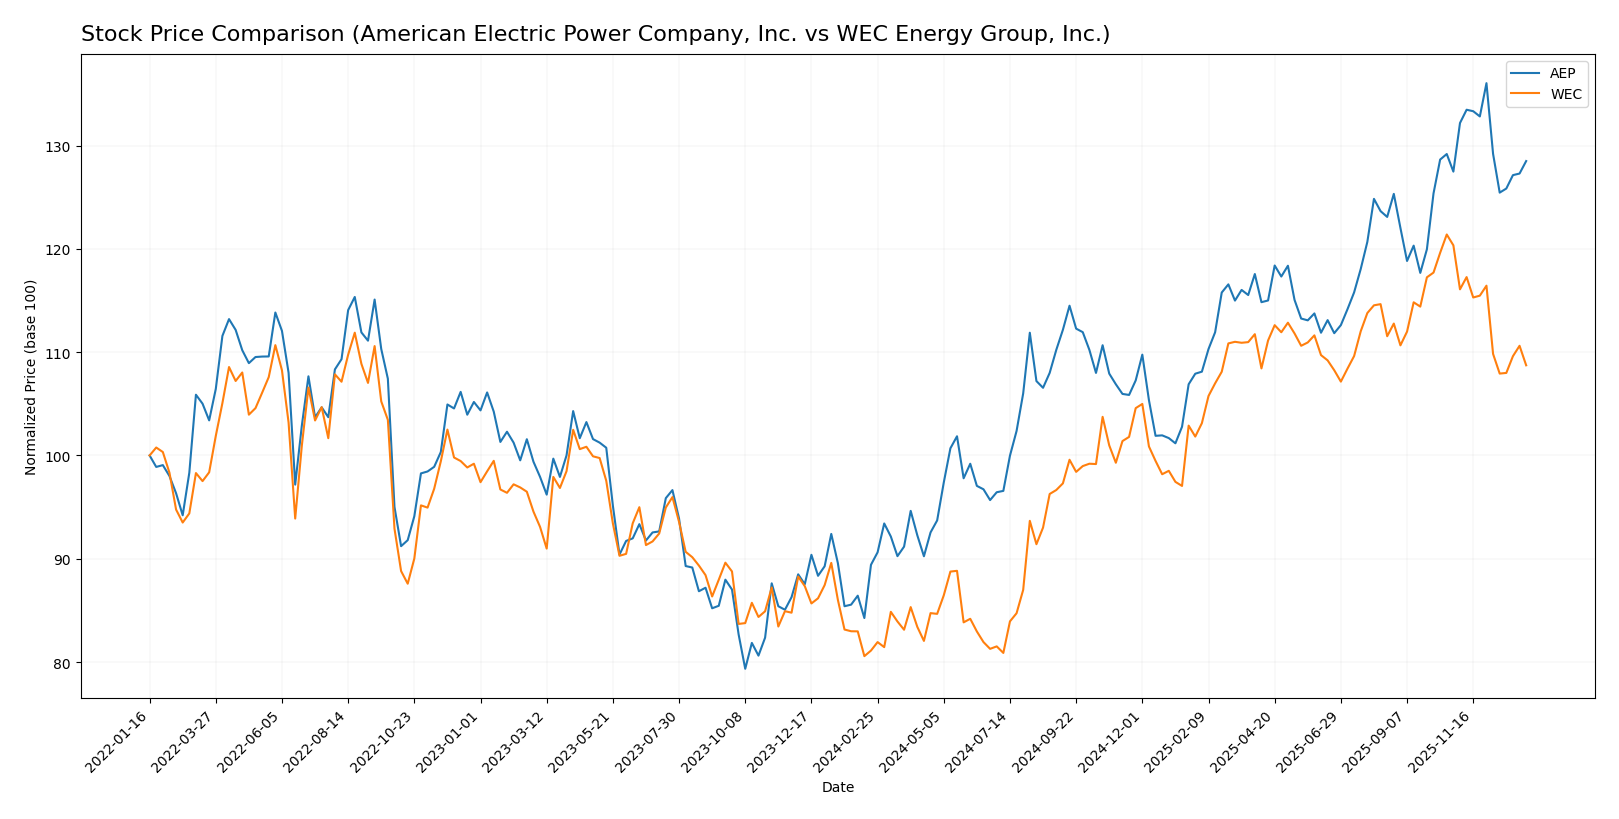
The stock price dynamics over the past 12 months reveal a strong bullish trend for both American Electric Power Company, Inc. and WEC Energy Group, Inc., with notable deceleration in price gains and contrasting recent short-term momentum.
Trend Analysis
American Electric Power Company, Inc. (AEP) shows a 43.71% price increase over the past year, confirming a bullish trend with decelerating growth. The stock ranged between 81.35 and 123.77, exhibiting moderate volatility (std. dev. 10.6).
WEC Energy Group, Inc. (WEC) recorded a 34.05% gain over the same period, also bullish but with deceleration and a higher volatility level (std. dev. 11.44). Prices fluctuated from 77.85 to 116.84.
Comparing the two, AEP outperformed WEC in market performance over the last 12 months, delivering the highest return despite both stocks showing a decelerating bullish trend.
Target Prices
Analysts provide a generally optimistic consensus on target prices for these utilities stocks.
| Company | Target High | Target Low | Consensus |
|---|---|---|---|
| American Electric Power Company, Inc. | 138 | 107 | 126.82 |
| WEC Energy Group, Inc. | 136 | 105 | 122.67 |
The consensus target prices suggest upside potential from current prices of $116.91 for American Electric Power and $104.65 for WEC Energy Group, indicating expected moderate appreciation in the near to mid-term.
Analyst Opinions Comparison
This section compares analysts’ ratings and grades for American Electric Power Company, Inc. (AEP) and WEC Energy Group, Inc. (WEC):
Rating Comparison
AEP Rating
- Rating: B+ reflecting a very favorable view.
- Discounted Cash Flow Score: 4, indicating a favorable valuation.
- ROE Score: 4, showing strong efficiency in generating profit from equity.
- ROA Score: 4, demonstrating effective asset utilization.
- Debt To Equity Score: 2, moderate financial risk level.
- Overall Score: 3, a moderate overall financial standing.
WEC Rating
- Rating: B- also with a very favorable status.
- Discounted Cash Flow Score: 1, considered very unfavorable.
- ROE Score: 4, equally strong in profitability from equity.
- ROA Score: 4, similarly effective in using assets.
- Debt To Equity Score: 2, moderate, matching AEP’s risk profile.
- Overall Score: 3, also moderate, equal to AEP’s overall score.
Which one is the best rated?
Based strictly on the data, AEP holds a higher overall rating (B+ vs. B-) and a significantly stronger discounted cash flow score (4 vs. 1), while both share equal ROE, ROA, debt to equity, and overall scores.
Scores Comparison
The scores comparison between American Electric Power Company, Inc. (AEP) and WEC Energy Group, Inc. (WEC) is as follows:
AEP Scores
- Altman Z-Score: 1.00, in the distress zone indicating high bankruptcy risk.
- Piotroski Score: 6, reflecting average financial strength.
WEC Scores
- Altman Z-Score: 1.14, also in the distress zone with elevated bankruptcy risk.
- Piotroski Score: 6, reflecting average financial strength.
Which company has the best scores?
Both AEP and WEC have Altman Z-Scores in the distress zone, signaling financial risk. Their Piotroski Scores are identical at 6, indicating average financial strength. Neither company shows a clear advantage based on these scores.
Grades Comparison
Here is the comparison of recent grades and ratings from established grading companies for the two utilities:
American Electric Power Company, Inc. Grades
The following table summarizes the latest grades issued by well-known financial institutions for American Electric Power Company, Inc.:
| Grading Company | Action | New Grade | Date |
|---|---|---|---|
| UBS | Maintain | Sell | 2025-12-17 |
| JP Morgan | Maintain | Neutral | 2025-12-12 |
| Jefferies | Upgrade | Buy | 2025-11-17 |
| Citigroup | Maintain | Neutral | 2025-10-31 |
| Wells Fargo | Maintain | Overweight | 2025-10-30 |
| Evercore ISI Group | Maintain | Outperform | 2025-10-30 |
| Morgan Stanley | Maintain | Overweight | 2025-10-30 |
| Mizuho | Maintain | Neutral | 2025-10-30 |
| BMO Capital | Downgrade | Market Perform | 2025-10-30 |
| Scotiabank | Maintain | Sector Perform | 2025-10-30 |
Overall, the grades for American Electric Power Company, Inc. display a mixed trend with several stable “Neutral” and “Overweight” ratings, one upgrade to “Buy,” but also a notable “Sell” rating and a downgrade to “Market Perform.”
WEC Energy Group, Inc. Grades
The table below presents the recent grades from reputable grading firms for WEC Energy Group, Inc.:
| Grading Company | Action | New Grade | Date |
|---|---|---|---|
| B of A Securities | Maintain | Neutral | 2025-12-31 |
| UBS | Maintain | Neutral | 2025-12-17 |
| Barclays | Maintain | Underweight | 2025-12-16 |
| Keybanc | Maintain | Overweight | 2025-12-12 |
| JP Morgan | Maintain | Neutral | 2025-12-11 |
| Scotiabank | Maintain | Sector Outperform | 2025-10-31 |
| BMO Capital | Maintain | Market Perform | 2025-10-21 |
| Barclays | Maintain | Equal Weight | 2025-10-21 |
| Keybanc | Maintain | Overweight | 2025-10-15 |
| UBS | Maintain | Neutral | 2025-10-10 |
WEC Energy Group’s ratings reveal a generally stable outlook, with multiple “Neutral” and “Overweight” grades, but some caution is expressed via “Underweight” and “Equal Weight” ratings.
Which company has the best grades?
American Electric Power Company, Inc. holds a more positive consensus with 19 buys versus WEC Energy Group’s 10 buys, while WEC has more holds and sells. This suggests AEP is viewed with slightly higher confidence, potentially impacting investor sentiment toward greater growth expectations or risk appetite.
Strengths and Weaknesses
Below is a comparison table highlighting key strengths and weaknesses for American Electric Power Company, Inc. (AEP) and WEC Energy Group, Inc. (WEC) based on the most recent financial and operational data.
| Criterion | American Electric Power Company, Inc. (AEP) | WEC Energy Group, Inc. (WEC) |
|---|---|---|
| Diversification | High diversification with strong segments in Transmission & Distribution (5.88B in 2024) and Generation & Marketing (1.94B) | Moderate diversification, heavy reliance on Wisconsin (6.33B in 2024) and Illinois (1.60B) markets |
| Profitability | Net margin 14.9% (favorable), ROIC 4.96% (unfavorable vs WACC 5.52%) | Net margin 17.77% (favorable), ROIC 4.14% (unfavorable vs WACC 5.3%) |
| Innovation | Incremental ROIC growth (+28.1% trend), signaling improving operational efficiency | Slight ROIC growth (+2.36% trend), indicating modest improvements |
| Global presence | Primarily U.S.-focused with vertically integrated utilities | Regional focus mainly in Midwest U.S. states |
| Market Share | Large market share in transmission and distribution utilities | Strong market share in Wisconsin and Illinois utility sectors |
In summary, both AEP and WEC show slightly unfavorable economic moats with ROIC below WACC, indicating current value destruction despite upward ROIC trends. AEP benefits from broader diversification and higher absolute revenues, while WEC maintains stronger profitability margins. Investors should weigh these factors carefully, considering the improving but still challenged profitability profiles.
Risk Analysis
Below is a table summarizing key risks for American Electric Power Company, Inc. (AEP) and WEC Energy Group, Inc. (WEC) based on their 2024 financial and operational profiles:
| Metric | American Electric Power (AEP) | WEC Energy Group (WEC) |
|---|---|---|
| Market Risk | Beta 0.615 (moderate volatility) | Beta 0.573 (moderate volatility) |
| Debt level | Debt-to-Equity 1.7 (unfavorable) | Debt-to-Equity 1.64 (unfavorable) |
| Regulatory Risk | High, due to regulated electric utility nature | High, similarly regulated electric utility |
| Operational Risk | Moderate, asset turnover low (0.19) and fixed asset turnover low (0.24) | Moderate, asset turnover 0.18, fixed asset turnover 0.25 |
| Environmental Risk | Exposure to coal and natural gas assets; transition risks | Exposure to coal, natural gas, and renewable assets; transition risks |
| Geopolitical Risk | Moderate, US-focused with infrastructure exposure | Moderate, US-focused, regional utility risks |
Both companies face significant regulatory risk inherent to the utility sector, alongside operational risks linked to asset efficiency. Debt levels are elevated, increasing financial risk, and both fall in the distress zone by Altman Z-Score, signaling potential solvency concerns. Environmental transition poses ongoing challenges, though both are diversifying energy sources. Market volatility is moderate but manageable.
The most impactful risks currently are regulatory shifts affecting pricing and operations, and financial leverage that may constrain flexibility amid evolving energy markets. Investors should closely monitor regulatory developments and debt management strategies.
Which Stock to Choose?
American Electric Power Company, Inc. (AEP) shows a favorable income statement with growing revenue and net income over 2020-2024, moderate profitability, though its ROIC is below WACC indicating value destruction. Financial ratios are slightly unfavorable, with a B+ rating reflecting moderate overall strength but some financial constraints.
WEC Energy Group, Inc. (WEC) also presents a favorable income trend, with solid margins and improving net income growth. Its financial ratios mirror AEP’s slightly unfavorable profile, and it holds a B- rating. WEC’s ROIC remains below WACC, signaling value erosion despite a steady profitability increase.
For investors, AEP’s slightly higher rating and stronger income growth could appeal to those seeking growth potential, while WEC’s stable profitability and modest valuation might be more suitable for risk-tolerant profiles favoring consistent returns. Both companies show profitability improvement but face challenges in capital efficiency.
Disclaimer: Investment carries a risk of loss of initial capital. The past performance is not a reliable indicator of future results. Be sure to understand risks before making an investment decision.
Go Further
I encourage you to read the complete analyses of American Electric Power Company, Inc. and WEC Energy Group, Inc. to enhance your investment decisions: