The Southern Company (SO) and American Electric Power Company, Inc. (AEP) are two major players in the regulated electric utilities sector, each serving millions of customers across the United States. Both companies focus on power generation, transmission, and distribution, with growing investments in renewable energy and infrastructure innovation. This comparison explores their market positions and strategies to help you identify which could be the more compelling investment opportunity in 2026.
Table of contents
Companies Overview
I will begin the comparison between The Southern Company and American Electric Power Company, Inc. by providing an overview of these two companies and their main differences.
The Southern Company Overview
The Southern Company, headquartered in Atlanta, GA, operates in the regulated electric industry. It focuses on the generation, transmission, and distribution of electricity, serving approximately 8.7M electric and gas utility customers. Its diversified operations include gas distribution, pipeline investments, and renewable energy projects, supported by a large infrastructure of power generation and natural gas pipelines.
American Electric Power Company, Inc. Overview
Based in Columbus, OH, American Electric Power Company, Inc. is a public utility holding company in the regulated electric sector. It generates, transmits, and distributes electricity through various segments, including vertically integrated utilities and transmission. The company uses diverse energy sources such as coal, natural gas, nuclear, hydro, solar, and wind, supplying power to retail and wholesale customers across the U.S.
Key similarities and differences
Both companies operate in the regulated electric industry with business models centered on electricity generation, transmission, and distribution. They serve large customer bases and utilize a mix of energy sources, including renewables. However, Southern Company has broader involvement in natural gas operations and a larger workforce, while American Electric Power focuses on vertically integrated utilities and transmission segments with a somewhat smaller market capitalization.
Income Statement Comparison
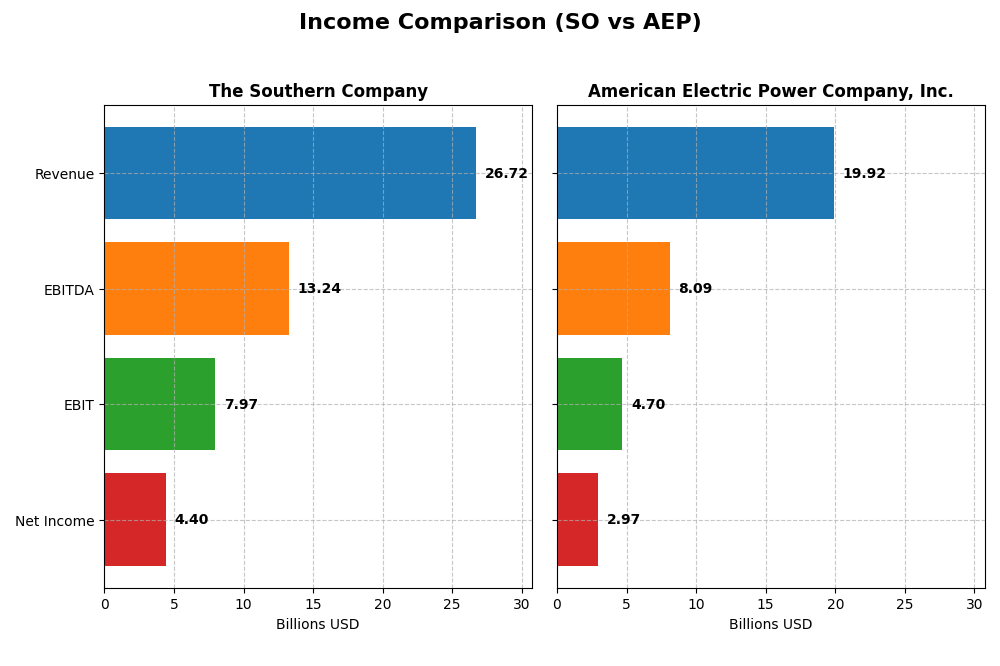
The table below compares key income statement metrics for The Southern Company and American Electric Power Company, Inc. for the fiscal year 2024, providing a clear overview of their recent financial performance.
| Metric | The Southern Company | American Electric Power Company, Inc. |
|---|---|---|
| Market Cap | 95.7B | 62.6B |
| Revenue | 26.7B | 19.9B |
| EBITDA | 13.2B | 8.1B |
| EBIT | 7.97B | 4.70B |
| Net Income | 4.40B | 2.97B |
| EPS | 4.02 | 5.60 |
| Fiscal Year | 2024 | 2024 |
Income Statement Interpretations
The Southern Company
The Southern Company has shown a generally favorable trend with revenue rising by 31.16% and net income increasing 40.43% over 2020-2024. Gross margin remains strong at 49.93%, while net margin is stable around 16.47%. In 2024, revenue growth slowed to 5.83%, but gross profit and EBIT margins improved, reflecting better operational efficiency despite an unfavorable rise in operating expenses.
American Electric Power Company, Inc.
American Electric Power experienced a revenue growth of 33.59% and net income growth of 34.86% over the five years. Gross margin holds at 31.92%, and net margin is favorable at 14.9%. The latest year showed slower revenue growth at 2.76%, but marked improvements in net margin growth (30.76%) and EPS growth (31.6%) indicate enhanced profitability and operational gains despite slightly unfavorable cost control.
Which one has the stronger fundamentals?
Both companies demonstrate favorable income statement fundamentals with strong revenue and net income growth over the period. Southern Company shows higher gross and EBIT margins but faces slightly unfavorable interest expenses and operating expense growth. American Electric Power presents solid margin improvements and earnings growth recently, with more neutral interest expense impact. Overall, each displays solid fundamentals with distinct margin and expense dynamics.
Financial Ratios Comparison
The table below presents a side-by-side comparison of key financial ratios for The Southern Company (SO) and American Electric Power Company, Inc. (AEP) based on their most recent fiscal year 2024 data.
| Ratios | The Southern Company (SO) | American Electric Power (AEP) |
|---|---|---|
| ROE | 13.3% | 11.0% |
| ROIC | 4.3% | 5.0% |
| P/E | 20.5 | 16.5 |
| P/B | 2.72 | 1.81 |
| Current Ratio | 0.67 | 0.44 |
| Quick Ratio | 0.46 | 0.31 |
| D/E (Debt-to-Equity) | 2.00 | 1.70 |
| Debt-to-Assets | 45.7% | 44.4% |
| Interest Coverage | 2.58 | 2.56 |
| Asset Turnover | 0.18 | 0.19 |
| Fixed Asset Turnover | 0.25 | 0.24 |
| Payout Ratio | 67.1% | 64.2% |
| Dividend Yield | 3.27% | 3.89% |
Interpretation of the Ratios
The Southern Company
The Southern Company displays a mixed ratio profile with favorable net margin (16.47%) and WACC (4.96%), but unfavorable returns on invested capital (4.25%) and weak liquidity indicated by a current ratio of 0.67. Debt levels and asset turnover ratios raise some concerns about efficiency. Its dividend yield is a solid 3.27%, supported by consistent payouts, though free cash flow coverage appears limited, signaling caution.
American Electric Power Company, Inc.
American Electric Power shows favorable net margin (14.9%) and WACC (5.52%), with a neutral return on equity (11.01%) but an unfavorable ROIC (4.96%). Liquidity ratios are weak, with a current ratio at 0.44. Debt is moderately high, and asset turnover remains low. The company offers a higher dividend yield of 3.89%, backed by stable distributions, though free cash flow constraints may challenge sustainability.
Which one has the best ratios?
Both companies share a similar ratio distribution, with roughly 21% favorable and 43% unfavorable metrics, resulting in a slightly unfavorable overall assessment. Southern Company has a marginally stronger net margin and dividend yield, while American Electric Power trades at a lower price-to-earnings ratio and offers a higher dividend yield. Neither stands out decisively in this ratio comparison.
Strategic Positioning
This section compares the strategic positioning of The Southern Company and American Electric Power Company, Inc., including market position, key segments, and exposure to technological disruption:
The Southern Company
- Market leader with $96B market cap in regulated electric utilities, facing moderate competitive pressure.
- Diverse segments: gas distribution, pipeline investments, wholesale gas, electric utilities, and renewables.
- Operates multiple renewable and traditional power stations, plus natural gas pipelines; limited explicit disruption exposure stated.
American Electric Power Company, Inc.
- $63B market cap in regulated electric sector, contending with moderate competition.
- Focused on generation, transmission, distribution, and marketing within vertically integrated utilities.
- Uses varied energy sources including coal, gas, nuclear, hydro, solar, wind; no direct disruption exposure detailed.
The Southern Company vs American Electric Power Company, Inc. Positioning
The Southern Company shows a more diversified business model spanning gas and electric utilities with renewable assets, while American Electric Power concentrates on vertically integrated utilities with diverse generation sources. Diversification offers broader market coverage but may dilute focus; concentration can enhance operational efficiency but increase segment risk.
Which has the best competitive advantage?
Both companies show slightly unfavorable MOAT evaluations with ROIC below WACC, indicating value destruction. However, both report growing ROIC trends, suggesting improving profitability. Neither holds a strong competitive advantage based on current capital efficiency metrics.
Stock Comparison
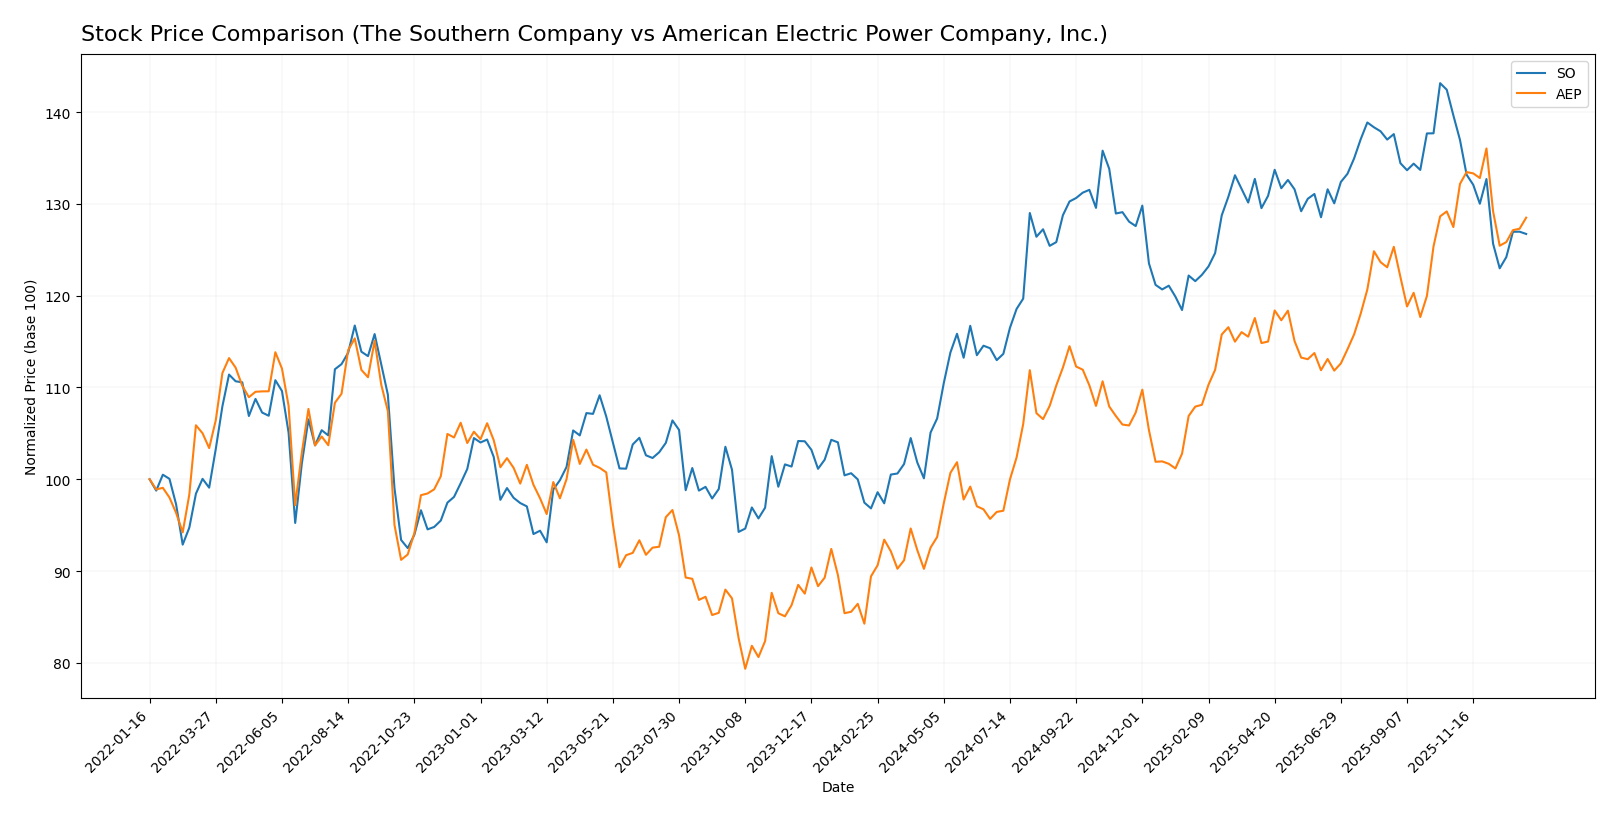
The stock price movements of The Southern Company and American Electric Power Company, Inc. over the past 12 months reveal significant bullish trends with decelerating momentum and distinct trading volume dynamics.
Trend Analysis
The Southern Company (SO) experienced a 30.88% price increase over the past year, indicating a bullish trend with decelerating acceleration. The stock ranged between 66.48 and 98.29, showing moderate volatility (7.54 std deviation). Recent months reflect a -9.25% decline.
American Electric Power Company, Inc. (AEP) posted a 43.71% price gain over the same period, also bullish but with deceleration. Its price varied from 81.35 to 123.77 and exhibited higher volatility (10.6 std deviation). The recent trend is nearly neutral with a 0.8% rise.
Comparing the two, AEP demonstrated stronger market performance with a higher overall price increase and volatility, while SO showed a notable recent pullback.
Target Prices
Analysts present a solid target price consensus for these regulated electric utilities.
| Company | Target High | Target Low | Consensus |
|---|---|---|---|
| The Southern Company | 103 | 76 | 93.1 |
| American Electric Power Company, Inc. | 138 | 107 | 126.82 |
The Southern Company’s consensus target price of 93.1 suggests moderate upside from the current price of 87.01. American Electric Power’s consensus target of 126.82 indicates a significant potential appreciation versus its present 116.91 share price.
Analyst Opinions Comparison
This section compares analysts’ ratings and grades for The Southern Company and American Electric Power Company, Inc.:
Rating Comparison
The Southern Company Rating
- Rating: B-, considered very favorable by analysts.
- Discounted Cash Flow Score: 3, moderate valuation signal.
- ROE Score: 4, indicates efficient profit generation.
- ROA Score: 3, moderate asset utilization.
- Debt To Equity Score: 1, very unfavorable financial risk.
- Overall Score: 3, moderate overall financial standing.
American Electric Power Company, Inc. Rating
- Rating: B+, also considered very favorable.
- Discounted Cash Flow Score: 4, favorable valuation.
- ROE Score: 4, equally efficient in profit generation.
- ROA Score: 4, favorable asset utilization.
- Debt To Equity Score: 2, moderate financial risk.
- Overall Score: 3, moderate overall financial standing.
Which one is the best rated?
Based strictly on the provided data, American Electric Power Company, Inc. holds a higher rating (B+) and scores better on discounted cash flow, return on assets, and debt-to-equity metrics, indicating a relatively stronger financial profile than The Southern Company.
Scores Comparison
Here is a comparison of key financial scores for The Southern Company and American Electric Power Company, Inc.:
SO Scores
- Altman Z-Score: 0.98, indicating financial distress zone with high bankruptcy risk.
- Piotroski Score: 6, categorized as average financial strength.
AEP Scores
- Altman Z-Score: 1.00, also in distress zone signaling high bankruptcy risk.
- Piotroski Score: 6, similarly rated as average financial strength.
Which company has the best scores?
Both SO and AEP have Altman Z-Scores in the distress zone, indicating high bankruptcy risk, and identical average Piotroski Scores of 6. Based solely on these scores, neither company shows a clear advantage over the other.
Grades Comparison
Here is a comparison of the latest available grades from leading grading companies for The Southern Company and American Electric Power Company, Inc.:
The Southern Company Grades
The table below summarizes recent grades assigned to The Southern Company by major financial institutions.
| Grading Company | Action | New Grade | Date |
|---|---|---|---|
| UBS | Maintain | Neutral | 2025-12-17 |
| JP Morgan | Maintain | Neutral | 2025-12-15 |
| Jefferies | Maintain | Neutral | 2025-12-15 |
| RBC Capital | Maintain | Sector Perform | 2025-12-12 |
| Keybanc | Maintain | Underweight | 2025-12-12 |
| Mizuho | Maintain | Neutral | 2025-12-11 |
| Barclays | Maintain | Equal Weight | 2025-11-20 |
| Jefferies | Downgrade | Neutral | 2025-11-05 |
| Ladenburg Thalmann | Downgrade | Neutral | 2025-10-17 |
| Keybanc | Maintain | Underweight | 2025-10-15 |
Overall, The Southern Company’s grades mostly reflect a neutral or hold position, with a few underweight assessments, indicating a cautious outlook.
American Electric Power Company, Inc. Grades
The following table details recent grades for American Electric Power Company, Inc. from recognized grading firms.
| Grading Company | Action | New Grade | Date |
|---|---|---|---|
| UBS | Maintain | Sell | 2025-12-17 |
| JP Morgan | Maintain | Neutral | 2025-12-12 |
| Jefferies | Upgrade | Buy | 2025-11-17 |
| Citigroup | Maintain | Neutral | 2025-10-31 |
| Wells Fargo | Maintain | Overweight | 2025-10-30 |
| Evercore ISI Group | Maintain | Outperform | 2025-10-30 |
| Morgan Stanley | Maintain | Overweight | 2025-10-30 |
| Mizuho | Maintain | Neutral | 2025-10-30 |
| BMO Capital | Downgrade | Market Perform | 2025-10-30 |
| Scotiabank | Maintain | Sector Perform | 2025-10-30 |
American Electric Power displays a broader range of opinions, with a consensus leaning towards buy and outperform grades, balanced by a few neutral and sell recommendations.
Which company has the best grades?
American Electric Power Company, Inc. has generally received more favorable grades, including buy and outperform ratings, compared to The Southern Company’s predominantly neutral and underweight assessments. This divergence suggests differing market sentiment and potential variations in investor expectations for growth and risk.
Strengths and Weaknesses
Below is a comparison table outlining key strengths and weaknesses of The Southern Company (SO) and American Electric Power Company, Inc. (AEP) based on the latest financial and operational data.
| Criterion | The Southern Company (SO) | American Electric Power (AEP) |
|---|---|---|
| Diversification | Moderate, with focus on gas distribution and electric utilities; Southern Company Gas contributes $4.46B in 2024 revenue | Balanced with generation, marketing, and transmission segments; Transmission & Distribution $5.88B in 2024 revenue |
| Profitability | Net margin 16.47% (favorable); ROIC 4.25% (unfavorable) below WACC 4.96% | Net margin 14.9% (favorable); ROIC 4.96% (unfavorable) below WACC 5.52% |
| Innovation | Limited data; slight improvement in ROIC trend (+13%) suggests operational improvements | Similar slight ROIC growth (+28%) indicating efficiency gains; innovation details limited |
| Global presence | Primarily US-focused utilities, limited global footprint | Primarily US operations, no significant global presence |
| Market Share | Strong in traditional electric utilities and gas distribution, but value destruction indicated by ROIC < WACC | Significant presence in transmission and distribution; also shedding value but improving ROIC trend |
Key takeaways: Both SO and AEP currently face challenges with returns on invested capital below their costs of capital, signaling value erosion. However, both companies show improving profitability trends. Their strong US utility market positions and steady dividend yields provide some stability, but investors should monitor operational efficiencies and capital utilization carefully.
Risk Analysis
Below is a comparative overview of key risks affecting The Southern Company (SO) and American Electric Power Company, Inc. (AEP) as of 2024:
| Metric | The Southern Company (SO) | American Electric Power (AEP) |
|---|---|---|
| Market Risk | Moderate (Beta 0.45) | Moderate (Beta 0.62) |
| Debt Level | High (Debt/Equity 2.0) | High (Debt/Equity 1.7) |
| Regulatory Risk | Elevated (Utilities sector) | Elevated (Utilities sector) |
| Operational Risk | Moderate (Aging assets) | Moderate (Diverse generation mix) |
| Environmental Risk | Significant (Coal, gas assets) | Significant (Coal, gas, nuclear) |
| Geopolitical Risk | Low (US focus) | Low (US focus) |
Both companies face similar sector-specific regulatory and environmental risks due to reliance on fossil fuels and nuclear power. High debt levels and moderate operational risks are notable, raising caution. Market volatility is contained given their low to moderate beta. The most impactful risk remains environmental regulation tightening, potentially increasing compliance costs.
Which Stock to Choose?
The Southern Company (SO) shows a favorable income statement with strong revenue and net income growth, a slightly unfavorable overall financial ratio profile, moderate profitability, high debt levels, and a very favorable B- rating. Its economic moat is slightly unfavorable as ROIC remains below WACC despite a growing trend.
American Electric Power Company, Inc. (AEP) also presents a favorable income statement with solid long-term growth, a similarly slightly unfavorable financial ratios profile, moderate profitability, manageable debt, and a very favorable B+ rating. Its economic moat status is slightly unfavorable due to ROIC below WACC but with improving profitability.
Considering ratings and financials, SO’s higher profitability contrasts with AEP’s stronger rating and marginally better debt metrics. Investors prioritizing growth potential and income expansion might find SO’s profile more appealing, while those focused on balanced financial health and moderate risk could interpret AEP as more suitable given its slightly stronger rating and financial stability.
Disclaimer: Investment carries a risk of loss of initial capital. The past performance is not a reliable indicator of future results. Be sure to understand risks before making an investment decision.
Go Further
I encourage you to read the complete analyses of The Southern Company and American Electric Power Company, Inc. to enhance your investment decisions: