In the evolving landscape of regulated electric utilities, American Electric Power Company, Inc. (AEP) and Public Service Enterprise Group Incorporated (PEG) stand out as prominent players. Both companies operate extensive transmission and distribution networks while investing in renewable energy and innovation to meet future demands. This comparison explores their market positions, strategies, and growth potential to help you decide which utility stock might best enhance your investment portfolio. Let’s uncover which company presents the most compelling opportunity for investors today.
Table of contents
Companies Overview
I will begin the comparison between American Electric Power Company, Inc. and Public Service Enterprise Group Incorporated by providing an overview of these two companies and their main differences.
American Electric Power Company, Inc. Overview
American Electric Power Company, Inc. is a leading electric public utility holding company based in Columbus, Ohio. Founded in 1906, it operates through vertically integrated utilities and transmission segments, generating electricity from diverse sources including coal, natural gas, nuclear, hydro, solar, and wind. AEP serves retail and wholesale customers across the United States, emphasizing a broad energy mix and extensive transmission and distribution capabilities.
Public Service Enterprise Group Incorporated Overview
Public Service Enterprise Group Incorporated, headquartered in Newark, New Jersey, primarily serves the Northeastern and Mid-Atlantic U.S. markets. Established in 1985, it operates through its PSE&G and PSEG Power segments, focusing on electricity transmission, distribution of electricity and gas, and solar generation projects. PSEG also provides appliance services and invests in energy efficiency programs, maintaining a significant infrastructure of transmission lines, substations, and gas mains.
Key similarities and differences
Both companies operate in the regulated electric utilities industry within the United States, focusing on transmission and distribution of electricity. AEP has a broader national footprint with a diverse energy generation portfolio, while PSEG concentrates on the Northeastern and Mid-Atlantic regions with additional emphasis on gas distribution and appliance services. Both companies have relatively low beta values, indicating moderate stock volatility within the utilities sector.
Income Statement Comparison
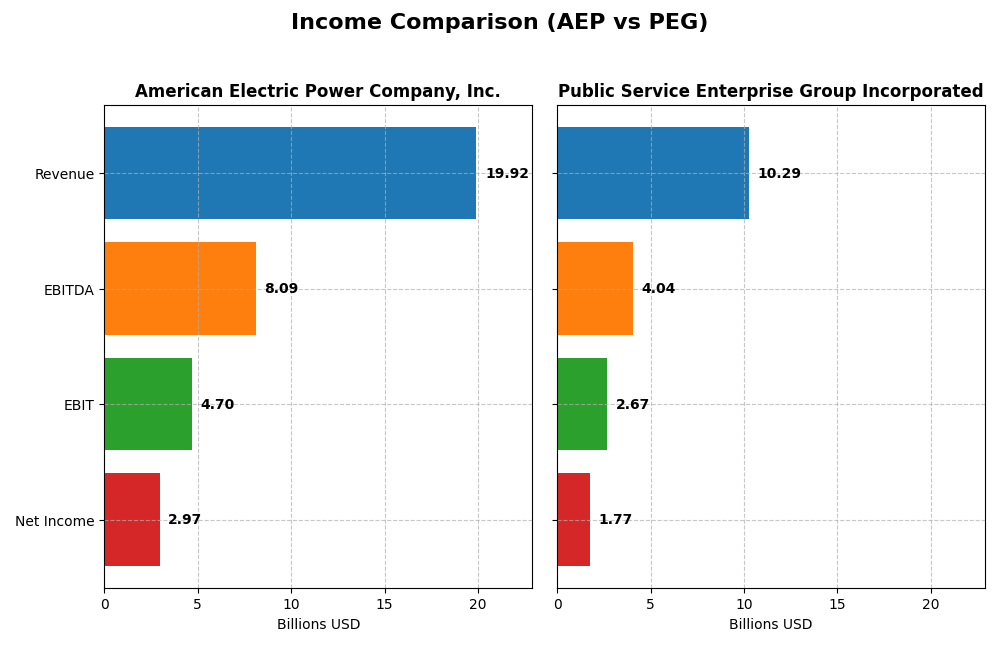
The table below compares key income statement metrics for American Electric Power Company, Inc. (AEP) and Public Service Enterprise Group Incorporated (PEG) for the fiscal year 2024.
| Metric | American Electric Power Company, Inc. (AEP) | Public Service Enterprise Group Incorporated (PEG) |
|---|---|---|
| Market Cap | 62.6B | 39.3B |
| Revenue | 19.9B | 10.3B |
| EBITDA | 8.1B | 4.0B |
| EBIT | 4.7B | 2.7B |
| Net Income | 3.0B | 1.8B |
| EPS | 5.60 | 3.56 |
| Fiscal Year | 2024 | 2024 |
Income Statement Interpretations
American Electric Power Company, Inc.
American Electric Power (AEP) showed steady revenue growth from $14.9B in 2020 to $19.9B in 2024, with net income rising from $2.2B to $3.0B over the same period. Margins remained largely stable, with a favorable gross margin at 31.9% and net margin improving to 14.9% in 2024. The latest year saw slower revenue growth at 2.8% but strong improvements in EBIT and net income margins.
Public Service Enterprise Group Incorporated
Public Service Enterprise Group (PEG) experienced mixed results, with revenue increasing modestly from $9.6B in 2020 to $10.3B in 2024 but net income declining from $1.9B to $1.8B. Margins deteriorated, with gross margin at 34.4% but net margin falling to 17.2%, accompanied by unfavorable trends in EBIT and EPS growth in 2024. The latest year marked a notable decline in profitability and margin contraction.
Which one has the stronger fundamentals?
AEP demonstrates stronger fundamentals with consistent revenue and net income growth, favorable margin trends, and positive earnings momentum. In contrast, PEG faces challenges with declining net income, shrinking margins, and negative profitability growth over recent years. The contrasting financial trajectories suggest AEP currently holds a more robust income statement profile.
Financial Ratios Comparison
The table below presents a side-by-side comparison of key financial ratios for American Electric Power Company, Inc. (AEP) and Public Service Enterprise Group Incorporated (PEG) based on their most recent fiscal year 2024 data.
| Ratios | American Electric Power Company, Inc. (AEP) | Public Service Enterprise Group Incorporated (PEG) |
|---|---|---|
| ROE | 11.0% | 11.0% |
| ROIC | 5.0% | 4.4% |
| P/E | 16.5 | 23.7 |
| P/B | 1.81 | 2.61 |
| Current Ratio | 0.44 | 0.65 |
| Quick Ratio | 0.31 | 0.48 |
| D/E (Debt-to-Equity) | 1.70 | 1.42 |
| Debt-to-Assets | 44.4% | 41.9% |
| Interest Coverage | 2.56 | 2.80 |
| Asset Turnover | 0.19 | 0.19 |
| Fixed Asset Turnover | 0.24 | 0.26 |
| Payout ratio | 64.2% | 67.5% |
| Dividend yield | 3.89% | 2.84% |
Interpretation of the Ratios
American Electric Power Company, Inc.
American Electric Power shows a mixed ratio profile with favorable net margin (14.9%) and dividend yield (3.89%), but weak liquidity (current ratio 0.44) and leverage (debt-to-equity 1.7) ratios. The return on invested capital (4.96%) is below its weighted average cost of capital (5.52%), raising concerns about capital efficiency. The company maintains a steady dividend supported by moderate payout ratios, but risks include high leverage and low liquidity.
Public Service Enterprise Group Incorporated
Public Service Enterprise Group presents a similarly mixed picture, with a strong net margin (17.22%) and dividend yield (2.84%), but unfavorable liquidity ratios (current ratio 0.65) and leverage (debt-to-equity 1.42). Its return on invested capital (4.4%) is also below the WACC (5.37%), suggesting limited capital returns. PSEG pays dividends with stable yields, though liquidity and leverage metrics indicate potential risk factors for investors.
Which one has the best ratios?
Both companies share a slightly unfavorable overall ratio assessment, with equal proportions of favorable (21.43%) and unfavorable (42.86%) ratios. AEP offers a higher dividend yield but weaker liquidity and leverage metrics. PSEG’s profitability is slightly better, but liquidity and leverage remain concerns. Neither company distinctly outperforms the other across all key financial ratios.
Strategic Positioning
This section compares the strategic positioning of American Electric Power Company, Inc. (AEP) and Public Service Enterprise Group Incorporated (PEG), focusing on market position, key segments, and exposure to technological disruption:
American Electric Power Company, Inc. (AEP)
- Large regulated electric utility with diverse geographic presence, facing moderate competitive pressure in US markets.
- Key segments include vertically integrated utilities, transmission and distribution, and generation and marketing.
- Uses a mix of coal, natural gas, nuclear, hydro, solar, and wind, indicating moderate exposure to energy transition disruptions.
Public Service Enterprise Group Incorporated (PEG)
- Mid-sized regulated electric and gas utility focused on Northeastern and Mid-Atlantic US, with steady competition.
- Key segments cover electric and gas distribution, transmission, and solar generation investments.
- Invests in solar generation and energy efficiency, showing proactive adaptation to technological changes.
American Electric Power Company, Inc. vs Public Service Enterprise Group Incorporated Positioning
AEP operates a diversified portfolio across generation, transmission, and distribution, offering broad exposure but also complexity. PEG concentrates on electric and gas distribution with investments in solar, balancing traditional utility services and innovation. Each approach presents distinct operational scopes and market focuses.
Which has the best competitive advantage?
Both companies are currently shedding value as ROIC falls below WACC, but each shows growing ROIC trends. Neither has a strong moat; however, AEP’s higher ROIC growth suggests slightly better value creation potential relative to PEG.
Stock Comparison
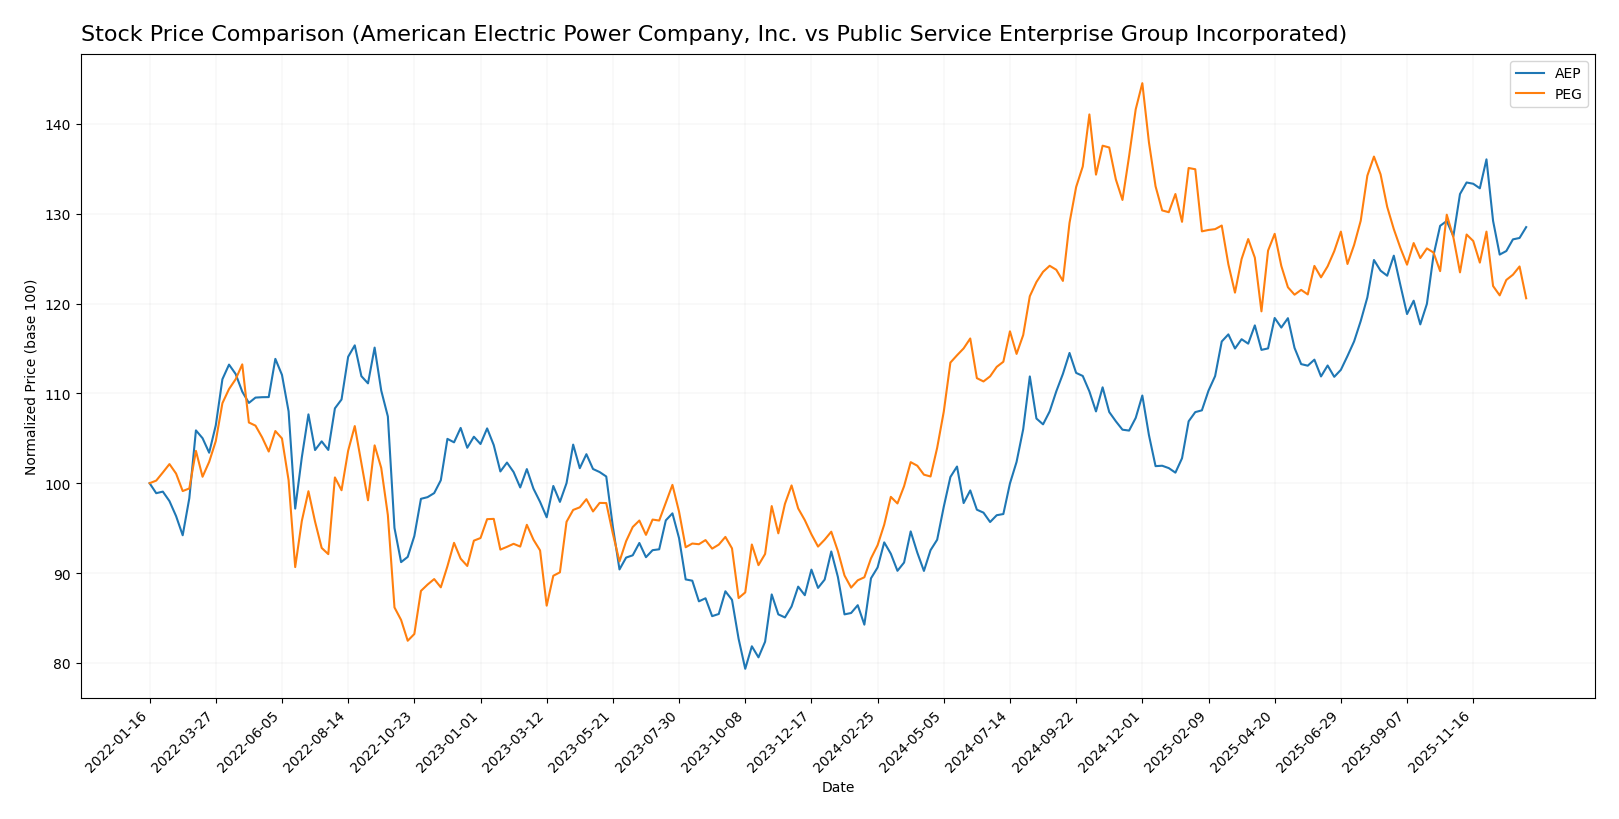
Over the past year, American Electric Power Company, Inc. (AEP) and Public Service Enterprise Group Incorporated (PEG) both displayed bullish trends with notable price appreciation, though recent trading indicates a divergence in momentum and buyer dominance.
Trend Analysis
American Electric Power Company, Inc. (AEP) showed a strong bullish trend with a 43.71% price increase over the past 12 months, accompanied by decelerating momentum and a high volatility of 10.6. Recent weeks reveal a neutral trend with a slight 0.8% gain and buyer dominance at 60.38%.
Public Service Enterprise Group Incorporated (PEG) experienced a 31.59% bullish gain over the past year with decelerating acceleration and lower volatility at 7.17. However, recent data indicate a bearish trend with a -5.33% decline and seller dominance at 61.31%.
Comparing the two, AEP delivered the highest market performance over the last 12 months with stronger overall gains and recent buyer dominance, while PEG showed weaker recent momentum despite positive annual returns.
Target Prices
Here is the current analyst consensus on target prices for these utility companies:
| Company | Target High | Target Low | Consensus |
|---|---|---|---|
| American Electric Power Company, Inc. | 138 | 107 | 126.82 |
| Public Service Enterprise Group Incorporated | 98 | 83 | 89 |
Analysts expect American Electric Power’s stock to appreciate moderately above its current price of 116.91 USD, while Public Service Enterprise Group shows a consensus target notably higher than its current price of 78.68 USD.
Analyst Opinions Comparison
This section compares analysts’ ratings and grades for American Electric Power Company, Inc. (AEP) and Public Service Enterprise Group Incorporated (PEG):
Rating Comparison
AEP Rating
- Rating: B+, rated Very Favorable overall.
- Discounted Cash Flow Score: 4, indicating a favorable valuation based on future cash flow projections.
- ROE Score: 4, favorable efficiency in generating profit from shareholders’ equity.
- ROA Score: 4, favorable asset utilization to generate earnings.
- Debt To Equity Score: 2, a moderate indication of financial risk with some reliance on debt.
- Overall Score: 3, moderate overall financial standing.
PEG Rating
- Rating: B-, rated Very Favorable overall.
- Discounted Cash Flow Score: 1, considered very unfavorable, suggesting less attractive cash flow valuation.
- ROE Score: 4, also favorable for profit generation efficiency.
- ROA Score: 4, similarly favorable asset utilization.
- Debt To Equity Score: 2, also moderate financial risk with similar debt reliance.
- Overall Score: 3, matching moderate overall financial standing.
Which one is the best rated?
Based strictly on the provided data, AEP holds a higher rating (B+) compared to PEG’s B-, with a notably stronger Discounted Cash Flow Score. Both companies share similar ROE, ROA, Debt to Equity, and Overall Scores, but AEP’s valuation outlook is more favorable.
Scores Comparison
The scores comparison between American Electric Power (AEP) and Public Service Enterprise Group (PEG) is as follows:
AEP Scores
- Altman Z-Score: 0.998 in distress zone, indicating high bankruptcy risk.
- Piotroski Score: 6, classified as average financial strength.
PEG Scores
- Altman Z-Score: 1.322 in distress zone, also indicating high bankruptcy risk.
- Piotroski Score: 7, classified as strong financial strength.
Which company has the best scores?
PEG shows a higher Piotroski Score of 7 compared to AEP’s 6, suggesting stronger financial health. Both companies have Altman Z-Scores in the distress zone, with PEG slightly higher but still indicating elevated bankruptcy risk.
Grades Comparison
The following presents a comparison of recent grades assigned to American Electric Power Company, Inc. and Public Service Enterprise Group Incorporated:
American Electric Power Company, Inc. Grades
This table summarizes the grading actions from recognized financial institutions for AEP:
| Grading Company | Action | New Grade | Date |
|---|---|---|---|
| UBS | Maintain | Sell | 2025-12-17 |
| JP Morgan | Maintain | Neutral | 2025-12-12 |
| Jefferies | Upgrade | Buy | 2025-11-17 |
| Citigroup | Maintain | Neutral | 2025-10-31 |
| Wells Fargo | Maintain | Overweight | 2025-10-30 |
| Evercore ISI Group | Maintain | Outperform | 2025-10-30 |
| Morgan Stanley | Maintain | Overweight | 2025-10-30 |
| Mizuho | Maintain | Neutral | 2025-10-30 |
| BMO Capital | Downgrade | Market Perform | 2025-10-30 |
| Scotiabank | Maintain | Sector Perform | 2025-10-30 |
The overall grading trend for AEP shows a mixture of neutral to positive ratings, with some downgrades and a sell rating from UBS, suggesting a cautious outlook.
Public Service Enterprise Group Incorporated Grades
This table summarizes the grading actions from recognized financial institutions for PEG:
| Grading Company | Action | New Grade | Date |
|---|---|---|---|
| Ladenburg Thalmann | Upgrade | Buy | 2026-01-07 |
| UBS | Maintain | Buy | 2025-12-17 |
| JP Morgan | Maintain | Overweight | 2025-12-12 |
| Jefferies | Upgrade | Buy | 2025-11-06 |
| TD Cowen | Maintain | Buy | 2025-11-05 |
| BMO Capital | Maintain | Market Perform | 2025-11-04 |
| Barclays | Maintain | Equal Weight | 2025-10-21 |
| BMO Capital | Maintain | Market Perform | 2025-10-20 |
| Morgan Stanley | Maintain | Overweight | 2025-09-25 |
| BMO Capital | Maintain | Market Perform | 2025-08-06 |
PEG’s grades indicate a consistent positive consensus with multiple buy ratings and a recent upgrade, reflecting a generally favorable market view.
Which company has the best grades?
Both companies have a consensus “Buy” rating, but PEG shows more consistent upgrades to buy and overweight ratings, while AEP presents a more mixed picture with some neutral and even sell ratings. This suggests PEG may be viewed more favorably by analysts, potentially impacting investor confidence and portfolio decisions accordingly.
Strengths and Weaknesses
Below is a comparative overview of key strengths and weaknesses for American Electric Power Company, Inc. (AEP) and Public Service Enterprise Group Incorporated (PEG) based on their latest financial and operational data.
| Criterion | American Electric Power Company, Inc. (AEP) | Public Service Enterprise Group Incorporated (PEG) |
|---|---|---|
| Diversification | Strong focus on Transmission and Distribution (5.88B in 2024), with smaller segments in Generation and Marketing (1.94B) and Other services (483M). | Diversified with significant revenues from Public Service Electric and Gas (3.98B), Gas Distribution Contracts (2.06B), and Transmission (1.75B). |
| Profitability | Net margin at 14.9% (favorable), ROIC at 4.96% (unfavorable, below WACC 5.52%), indicating value shedding but improving ROIC trend (+28%). | Higher net margin of 17.22% (favorable), ROIC at 4.4% (unfavorable, below WACC 5.37%), also shedding value but with a positive ROIC trend (+10.7%). |
| Innovation | Limited visibility on innovation; core in stable utility sectors with slow change; modest asset turnover (0.19) and fixed asset turnover (0.24) reflect capital intensity. | Similar capital intensity with asset turnover at 0.19 and fixed asset turnover at 0.26; innovation likely incremental within regulated utilities. |
| Global presence | Primarily U.S.-focused utility operations; no significant international exposure noted. | Also U.S.-focused, mainly in New Jersey and surrounding regions; minimal global footprint. |
| Market Share | Large vertically integrated utility presence with revenues exceeding 11B in 2023, strong foothold in transmission and distribution. | Strong regional market share in gas and electric utilities with consolidated revenue around 10.5B; solid position in Northeast U.S. markets. |
In summary, both AEP and PEG show stable profitability with favorable net margins but face challenges in generating returns above their cost of capital, indicating some value erosion despite improving efficiency. Their diversification and market positions are strong regionally, though innovation and global exposure remain limited, typical of regulated utility sectors. Investors should weigh stable cash flows against moderate growth and capital efficiency concerns.
Risk Analysis
Below is a comparison of key risks for American Electric Power Company, Inc. (AEP) and Public Service Enterprise Group Incorporated (PEG) based on the most recent data from 2024.
| Metric | American Electric Power Company, Inc. (AEP) | Public Service Enterprise Group Incorporated (PEG) |
|---|---|---|
| Market Risk | Moderate, beta 0.615 indicates lower volatility | Moderate, beta 0.613 similar low volatility |
| Debt level | High leverage, Debt/Equity 1.7 (unfavorable) | High leverage, Debt/Equity 1.42 (unfavorable) |
| Regulatory Risk | Significant, due to regulated electric utilities sector | Significant, operates in regulated Northeast and Mid-Atlantic markets |
| Operational Risk | Moderate, diverse generation sources but low asset turnover | Moderate, extensive infrastructure with low asset turnover |
| Environmental Risk | Medium, reliance on coal and natural gas alongside renewables | Medium, invests in solar but still dependent on fossil fuels |
| Geopolitical Risk | Low, US domestic operations | Low, US domestic operations |
The most likely and impactful risks for both companies center on their high debt levels and regulatory environments. Both firms show financial distress signals with Altman Z-scores below 1.8, indicating heightened bankruptcy risk. Operational efficiency is also a concern given unfavorable asset turnover ratios. Investors should weigh these risks against their dividend yields and stable market positions in regulated utilities.
Which Stock to Choose?
American Electric Power Company, Inc. (AEP) shows a favorable income statement with a 14.9% net margin and positive growth in revenue and earnings over 2020-2024. Its financial ratios reveal a slightly unfavorable profile with 43% debt-to-assets and weak liquidity, yet it holds a very favorable B+ rating. The company is shedding value with ROIC below WACC but improving profitability.
Public Service Enterprise Group Incorporated (PEG) has a 17.22% net margin but an unfavorable income growth trend, including a 6.98% decline in net income over five years. Financial ratios are slightly unfavorable with moderate debt and liquidity concerns, and PEG holds a very favorable B- rating. Like AEP, it is destroying value with ROIC under WACC but shows growing profitability.
For investors focused on growth, AEP may appear more attractive given its stronger income growth and higher rating, while those prioritizing dividend yield or stability might see PEG’s current profile as more fitting. Both firms show slight value erosion despite improving profitability, suggesting caution in interpreting their potential.
Disclaimer: Investment carries a risk of loss of initial capital. The past performance is not a reliable indicator of future results. Be sure to understand risks before making an investment decision.
Go Further
I encourage you to read the complete analyses of American Electric Power Company, Inc. and Public Service Enterprise Group Incorporated to enhance your investment decisions: