In the evolving landscape of regulated electric utilities, American Electric Power Company, Inc. (AEP) and PPL Corporation (PPL) stand out as major players with significant market presence and innovation efforts. Both companies operate in the U.S. electric sector, focusing on generation, transmission, and distribution, with growing investments in renewable energy. This article will explore their strengths and risks to help you decide which company might be the most compelling addition to your investment portfolio.
Table of contents
Companies Overview
I will begin the comparison between American Electric Power Company, Inc. and PPL Corporation by providing an overview of these two companies and their main differences.
American Electric Power Company, Inc. Overview
American Electric Power Company, Inc. is a major electric public utility holding company that generates, transmits, and distributes electricity across the United States. Founded in 1906 and headquartered in Columbus, Ohio, AEP operates through multiple segments including Vertically Integrated Utilities and Transmission & Distribution Utilities. It uses diverse energy sources such as coal, natural gas, nuclear, hydro, solar, and wind to supply retail and wholesale customers.
PPL Corporation Overview
PPL Corporation is a utility holding company serving electric and natural gas customers primarily in the United States and the United Kingdom. Founded in 1920 and based in Allentown, Pennsylvania, it operates through regulated segments in Kentucky and Pennsylvania. PPL generates electricity from coal, gas, hydro, and solar sources and provides services to over two million customers, including wholesale electricity sales to municipalities in Kentucky.
Key similarities and differences
Both companies operate in the regulated electric utility sector and generate electricity from a mix of traditional and renewable energy sources. AEP has a broader national footprint and larger market capitalization at $62.6B compared to PPL’s $25.6B, reflecting its more extensive operations. PPL uniquely serves both electric and natural gas customers in distinct regional markets, while AEP focuses primarily on electricity generation and distribution.
Income Statement Comparison
The table below compares key income statement metrics for American Electric Power Company, Inc. (AEP) and PPL Corporation for the fiscal year 2024, providing a snapshot of their financial performance.
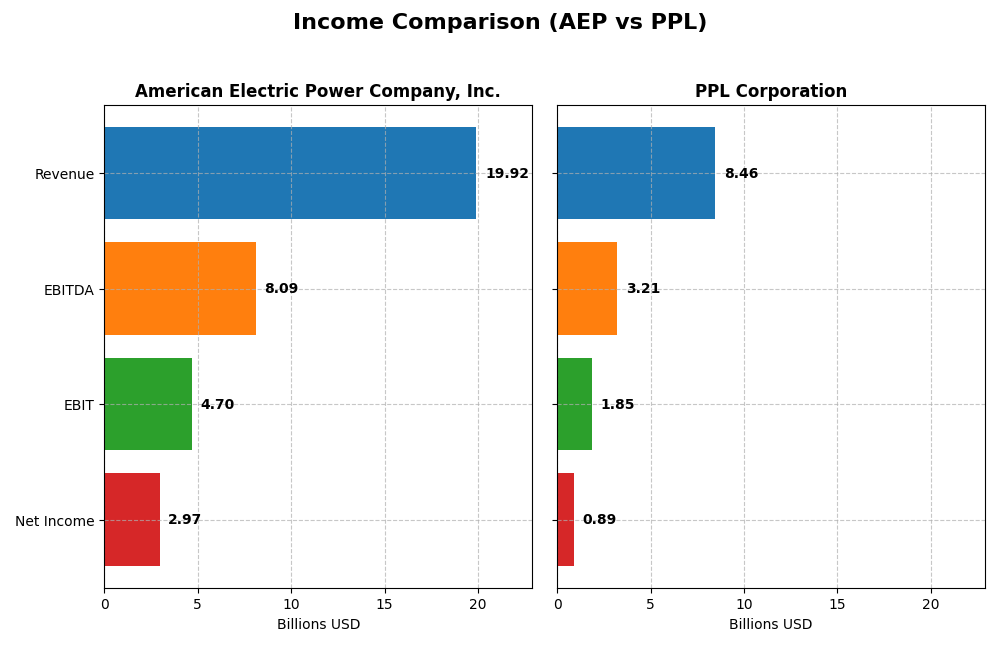
| Metric | American Electric Power Company, Inc. (AEP) | PPL Corporation (PPL) |
|---|---|---|
| Market Cap | 62.6B | 25.6B |
| Revenue | 19.9B | 8.5B |
| EBITDA | 8.1B | 3.2B |
| EBIT | 4.7B | 1.9B |
| Net Income | 3.0B | 0.9B |
| EPS | 5.60 | 1.20 |
| Fiscal Year | 2024 | 2024 |
Income Statement Interpretations
American Electric Power Company, Inc.
From 2020 to 2024, American Electric Power Company, Inc. showed steady revenue growth of 33.6% and net income growth of 34.9%, with gross and net margins remaining favorable and stable. In 2024, revenue growth slowed to 2.8%, but gross profit and EBIT margins improved significantly, reflecting enhanced operational efficiency and a 30.8% increase in net margin.
PPL Corporation
PPL Corporation experienced a 54.6% increase in revenue over 2020-2024, but net income declined by 39.6%, and net margin dropped by 60.9%. Margins were generally favorable but exhibited more volatility. In 2024, revenue growth slowed to 1.8%, with moderate gross profit improvement and a 17.9% rise in net margin, signaling some recovery in profitability.
Which one has the stronger fundamentals?
American Electric Power Company, Inc. demonstrates stronger fundamentals with consistent revenue and net income growth, stable and improving margins, and favorable earnings per share growth. PPL’s revenue growth is robust, yet its sharp net income and margin declines over the period mark a less stable financial profile despite recent improvements. Overall, AEP’s income statement shows more sustained financial health.
Financial Ratios Comparison
The table below presents a side-by-side comparison of key financial ratios for American Electric Power Company, Inc. (AEP) and PPL Corporation based on their most recent fiscal year data ending December 31, 2024.
| Ratios | American Electric Power Company, Inc. (AEP) | PPL Corporation (PPL) |
|---|---|---|
| ROE | 11.0% | 6.3% |
| ROIC | 4.96% | 3.59% |
| P/E | 16.48 | 26.97 |
| P/B | 1.81 | 1.70 |
| Current Ratio | 0.44 | 0.86 |
| Quick Ratio | 0.31 | 0.71 |
| D/E (Debt-to-Equity) | 1.70 | 1.19 |
| Debt-to-Assets | 44.4% | 40.9% |
| Interest Coverage | 2.56 | 2.36 |
| Asset Turnover | 0.19 | 0.21 |
| Fixed Asset Turnover | 0.24 | 0.26 |
| Payout Ratio | 64.2% | 84.1% |
| Dividend Yield | 3.9% | 3.1% |
Interpretation of the Ratios
American Electric Power Company, Inc.
American Electric Power exhibits a mixed ratio profile with favorable net margin (14.9%) and dividend yield (3.89%), but several weak points including low current (0.44) and quick ratios (0.31), high debt-to-equity (1.7), and poor asset turnover. Return on equity is neutral at 11.01%, while return on invested capital is unfavorable at 4.96%. The company pays dividends with a solid yield, but some liquidity and efficiency concerns remain.
PPL Corporation
PPL shows a somewhat weaker overall ratio set, with a favorable net margin of 10.49% and dividend yield of 3.12%. However, its return on equity is low at 6.31%, return on invested capital is also unfavorable at 3.59%, and its price-to-earnings ratio is relatively high at 26.97, indicating potential overvaluation. Liquidity ratios are better than AEP but still below ideal levels, and debt levels remain a concern. The company maintains dividend payments despite these pressures.
Which one has the best ratios?
American Electric Power has a slightly unfavorable overall ratio profile but outperforms PPL with stronger profitability margins and a better dividend yield. PPL’s ratios are more unfavorable, particularly in profitability and valuation metrics. Both face challenges in liquidity and asset efficiency, but AEP’s more balanced ratios suggest relatively better financial health.
Strategic Positioning
This section compares the strategic positioning of American Electric Power Company, Inc. (AEP) and PPL Corporation (PPL) regarding market position, key segments, and exposure to technological disruption:
American Electric Power Company, Inc. (AEP)
- Large market cap at 62.6B, operating in regulated electric with moderate beta
- Diversified segments including generation, transmission, distribution, and marketing
- Uses multiple energy sources including coal, gas, nuclear, hydro, solar, and wind
PPL Corporation (PPL)
- Smaller market cap at 25.6B, also regulated electric with slightly higher beta
- Focused on regulated electricity and natural gas in Kentucky, Pennsylvania, and UK
- Generates electricity from coal, gas, hydro, solar, with regional focus limiting disruption exposure
American Electric Power Company, Inc. vs PPL Corporation Positioning
AEP shows a diversified business model across multiple segments and broad energy sources, offering balanced exposure. PPL concentrates on regulated regional markets and fewer segments, which may limit scale but focus operations. Both face regulated industry dynamics.
Which has the best competitive advantage?
Both companies exhibit slightly unfavorable MOAT evaluations, shedding value despite growing ROIC trends. AEP’s larger scale and segment diversity contrast with PPL’s regional specialization, but neither currently demonstrates a strong sustainable competitive advantage.
Stock Comparison
The stock prices of American Electric Power Company, Inc. (AEP) and PPL Corporation (PPL) have shown significant upward movements over the past 12 months, with notable deceleration in trend momentum and distinct recent trading behaviors.
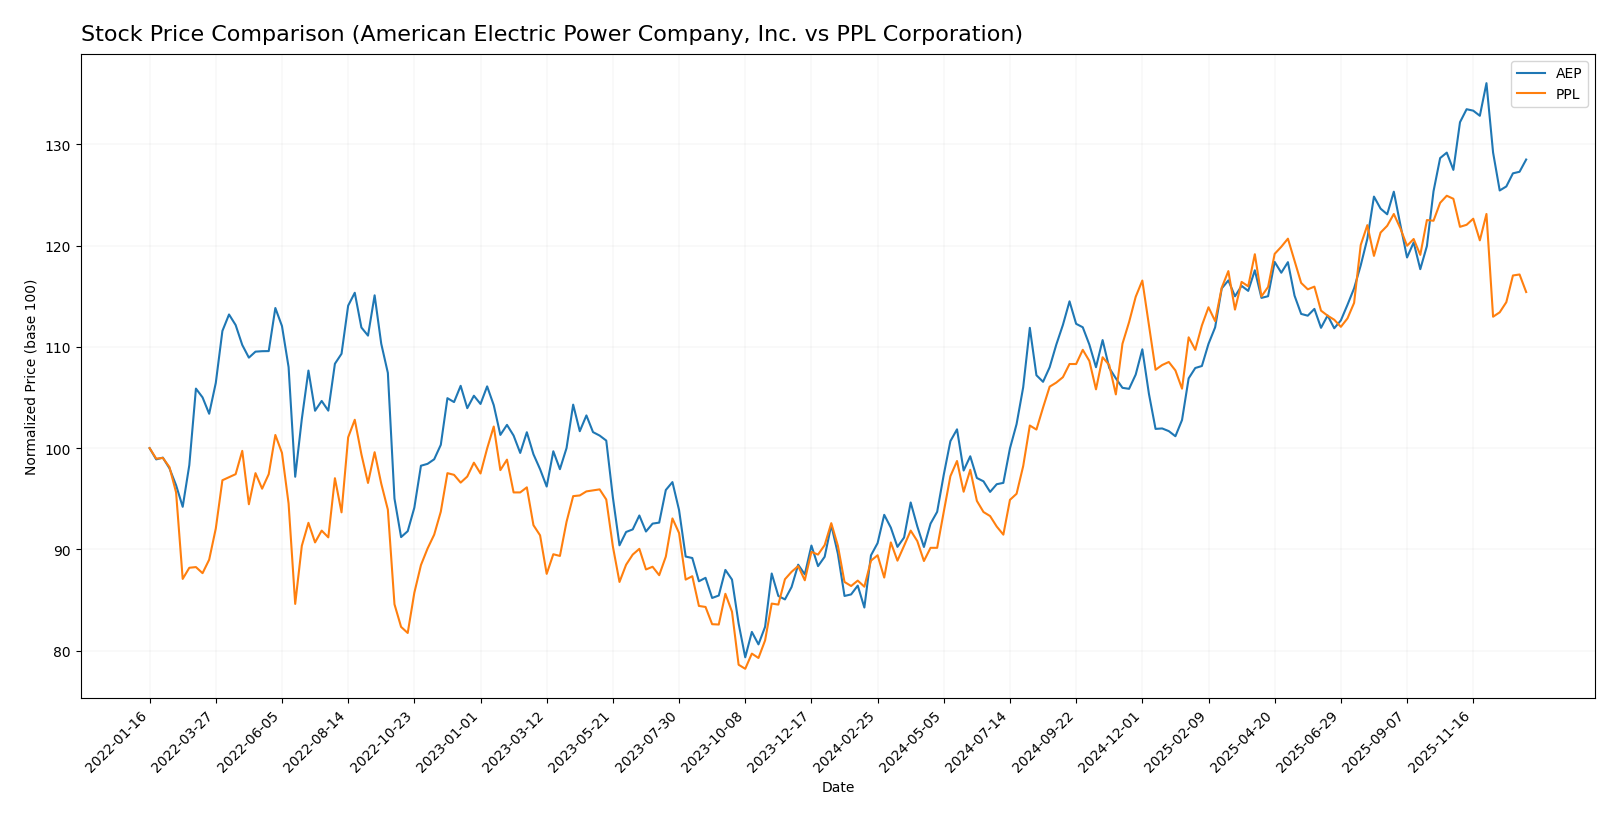
Trend Analysis
American Electric Power Company, Inc. (AEP) exhibited a bullish trend with a 43.71% price increase over the past year, though this growth has decelerated recently, showing a marginal 0.8% rise from late October 2025 to mid-January 2026.
PPL Corporation (PPL) also maintained a bullish trend across the last 12 months, gaining 29.84%, but experienced deceleration and a bearish recent trend of -7.39% over the same recent period.
Comparing both, AEP delivered the highest market performance with a stronger annual gain and a more dominant buyer presence, despite its recent trend flattening relative to PPL’s recent decline.
Target Prices
Analyst consensus target prices indicate moderate upside potential for these regulated electric utilities.
| Company | Target High | Target Low | Consensus |
|---|---|---|---|
| American Electric Power Company, Inc. | 138 | 107 | 126.82 |
| PPL Corporation | 45 | 36 | 41.29 |
The consensus targets for AEP and PPL suggest expectations of price appreciation compared to current prices of $116.91 and $34.59 respectively, reflecting a generally positive analyst outlook.
Analyst Opinions Comparison
This section compares analysts’ ratings and grades for American Electric Power Company, Inc. (AEP) and PPL Corporation (PPL):
Rating Comparison
AEP Rating
- Rating: B+ indicating a very favorable overall assessment
- Discounted Cash Flow Score: 4, favorable score reflecting positive cash flow projections
- ROE Score: 4, favorable score showing efficient profit generation from equity
- ROA Score: 4, favorable score reflecting effective asset utilization
- Debt To Equity Score: 2, moderate score suggesting moderate financial risk
- Overall Score: 3, moderate summary score of financial standing
PPL Rating
- Rating: C+ indicating a very favorable overall assessment
- Discounted Cash Flow Score: 1, very unfavorable score indicating weak cash flow projections
- ROE Score: 3, moderate score indicating average efficiency
- ROA Score: 3, moderate score showing average asset utilization
- Debt To Equity Score: 2, moderate score indicating similar financial risk
- Overall Score: 2, moderate but lower financial standing summary
Which one is the best rated?
Based strictly on the data, AEP holds a higher rating with a B+ and superior scores in discounted cash flow, ROE, and ROA, while PPL has a lower C+ rating and weaker discounted cash flow score. AEP is better rated overall.
Scores Comparison
Here is a comparison of the Altman Z-Score and Piotroski Score for both companies:
AEP Scores
- Altman Z-Score: 1.00, indicating financial distress.
- Piotroski Score: 6, reflecting average financial strength.
PPL Scores
- Altman Z-Score: 0.97, indicating financial distress.
- Piotroski Score: 6, reflecting average financial strength.
Which company has the best scores?
Both AEP and PPL have Altman Z-Scores in the distress zone, indicating financial risk. Their Piotroski Scores are equal at 6, showing average financial strength. Neither company shows a clear advantage based on these scores.
Grades Comparison
Here is a detailed comparison of the recent grades assigned to American Electric Power Company, Inc. and PPL Corporation by various reliable grading companies:
American Electric Power Company, Inc. Grades
The following table shows the latest grades from major financial institutions for AEP:
| Grading Company | Action | New Grade | Date |
|---|---|---|---|
| UBS | Maintain | Sell | 2025-12-17 |
| JP Morgan | Maintain | Neutral | 2025-12-12 |
| Jefferies | Upgrade | Buy | 2025-11-17 |
| Citigroup | Maintain | Neutral | 2025-10-31 |
| Wells Fargo | Maintain | Overweight | 2025-10-30 |
| Evercore ISI Group | Maintain | Outperform | 2025-10-30 |
| Morgan Stanley | Maintain | Overweight | 2025-10-30 |
| Mizuho | Maintain | Neutral | 2025-10-30 |
| BMO Capital | Downgrade | Market Perform | 2025-10-30 |
| Scotiabank | Maintain | Sector Perform | 2025-10-30 |
The grades for AEP show a mixed but generally positive outlook, with several firms maintaining or upgrading to Buy/Outperform, balanced by some Neutral and Sell ratings.
PPL Corporation Grades
The table below presents the recent grades given to PPL Corporation by reputable grading companies:
| Grading Company | Action | New Grade | Date |
|---|---|---|---|
| UBS | Maintain | Neutral | 2025-12-17 |
| Wells Fargo | Maintain | Overweight | 2025-12-12 |
| JP Morgan | Maintain | Overweight | 2025-12-11 |
| BMO Capital | Maintain | Outperform | 2025-10-21 |
| B of A Securities | Maintain | Buy | 2025-10-16 |
| Barclays | Maintain | Equal Weight | 2025-10-14 |
| UBS | Maintain | Neutral | 2025-10-10 |
| Morgan Stanley | Maintain | Overweight | 2025-09-25 |
| Barclays | Maintain | Equal Weight | 2025-07-01 |
| Morgan Stanley | Maintain | Overweight | 2025-06-18 |
The PPL grades consistently indicate a favorable view, predominantly Overweight and Outperform ratings with no downgrades or Sell ratings.
Which company has the best grades?
Both American Electric Power Company, Inc. and PPL Corporation have a consensus Buy rating. However, PPL shows a steadier pattern of Overweight and Outperform grades without any Sell ratings, whereas AEP’s ratings are more mixed with some Sell and Neutral grades. This suggests PPL may be perceived as having a slightly stronger outlook, potentially influencing investor confidence differently.
Strengths and Weaknesses
Below is a comparison of key strengths and weaknesses for American Electric Power Company, Inc. (AEP) and PPL Corporation based on the most recent financial and operational data.
| Criterion | American Electric Power Company, Inc. (AEP) | PPL Corporation |
|---|---|---|
| Diversification | Highly diversified across generation, transmission, and distribution with $5.88B in transmission and distribution revenue in 2024 | Less diversified, focused on regulated utilities in Kentucky, Pennsylvania, and Rhode Island |
| Profitability | Net margin of 14.9% (favorable), but ROIC below WACC indicating value destruction | Net margin of 10.49% (favorable); ROIC below WACC also indicating value destruction |
| Innovation | Moderate focus on innovation with growth in ROIC trend (+28.1%) despite current value shedding | Slower innovation impact with ROIC growth (+19%) but overall unfavorable value creation |
| Global presence | Primarily US-focused with strong vertically integrated utilities segment | Mostly US regional operations; previously had UK segment but scaled back |
| Market Share | Strong presence in US transmission and distribution utilities | Regional market share concentrated in eastern US states |
Key takeaways: Both AEP and PPL show growing profitability trends but currently destroy value as ROIC remains below WACC. AEP benefits from more diversification and a larger scale, while PPL operates more regionally with a narrower geographic footprint. Investors should weigh growth potential against current value challenges.
Risk Analysis
Below is a comparative table summarizing key risks for American Electric Power Company, Inc. (AEP) and PPL Corporation based on the most recent 2024 data:
| Metric | American Electric Power Company, Inc. (AEP) | PPL Corporation (PPL) |
|---|---|---|
| Market Risk | Moderate (Beta 0.615; stable price range) | Moderate (Beta 0.716; wider range) |
| Debt level | High (D/E 1.7; interest coverage 2.53) | Elevated (D/E 1.19; interest coverage 2.51) |
| Regulatory Risk | Significant (regulated electric sector) | Significant (regulated electric sector) |
| Operational Risk | Moderate (diverse energy sources, incl. coal) | Moderate (coal and gas generation, UK exposure) |
| Environmental Risk | Elevated (coal reliance, transition risks) | Elevated (coal and gas generation, UK operations) |
| Geopolitical Risk | Low to moderate (US-focused) | Moderate (US and UK operations) |
The most impactful risks for both companies stem from their substantial debt levels combined with operational and environmental challenges linked to continued coal usage amid tightening regulations and energy transition demands. PPL’s dual-country exposure adds geopolitical complexity, while AEP’s lower beta suggests slightly less market volatility risk. Both companies fall in the distress zone on Altman Z-Score, signaling financial vulnerability that investors should monitor closely.
Which Stock to Choose?
American Electric Power Company, Inc. (AEP) shows favorable income evolution with a 33.6% revenue growth over 2020-2024 and a strong net margin of 14.9%. Its financial ratios present a slightly unfavorable global opinion, with some concerns in liquidity and leverage, while profitability remains moderate. The company holds a very favorable B+ rating but is in the distress zone for bankruptcy risk, with average financial strength scores.
PPL Corporation (PPL) has a favorable income statement overall, despite a 39.6% decline in net income over the period and a lower net margin of 10.5%. Its financial ratios are globally unfavorable, with weaker profitability and higher valuation multiples. PPL carries a very favorable C+ rating, yet also falls in the distress zone for bankruptcy risk and posts average Piotroski scores.
For investors, AEP might appear more attractive for those prioritizing stronger income growth and profitability with a slightly better rating, while PPL may appeal to those accepting higher risk amid weaker financial ratios but a comparable rating. Both companies show improving ROIC trends but remain value destroyers, suggesting cautious interpretation depending on risk tolerance and investment goals.
Disclaimer: Investment carries a risk of loss of initial capital. The past performance is not a reliable indicator of future results. Be sure to understand risks before making an investment decision.
Go Further
I encourage you to read the complete analyses of American Electric Power Company, Inc. and PPL Corporation to enhance your investment decisions: