American Electric Power Company, Inc. (AEP) and Pinnacle West Capital Corporation (PNW) are two prominent players in the regulated electric utility sector, serving millions of customers across the United States. Both companies focus on electricity generation, transmission, and distribution, leveraging diverse energy sources and innovative strategies to meet growing demand. This article will analyze their market positioning and growth potential to help you decide which stock deserves a place in your investment portfolio.
Table of contents
Companies Overview
I will begin the comparison between American Electric Power Company, Inc. and Pinnacle West Capital Corporation by providing an overview of these two companies and their main differences.
American Electric Power Company, Inc. Overview
AEP is a leading electric public utility holding company engaged in the generation, transmission, and distribution of electricity across the United States. It operates through multiple segments, including vertically integrated utilities and transmission services. The company utilizes a diverse energy mix, including coal, natural gas, nuclear, hydro, solar, and wind, to supply retail and wholesale customers. Founded in 1906, AEP is headquartered in Columbus, Ohio.
Pinnacle West Capital Corporation Overview
PNW, via its subsidiary Arizona Public Service Company, provides electric services primarily in Arizona. It manages generation, transmission, and distribution of electricity using coal, nuclear, gas, oil, and solar facilities. The company owns extensive infrastructure with thousands of miles of overhead and underground lines and serves about 1.3 million customers. Incorporated in 1985, Pinnacle West is based in Phoenix, Arizona.
Key similarities and differences
Both AEP and Pinnacle West operate in the regulated electric utilities sector, focusing on electricity generation and distribution with diverse energy sources including nuclear and renewables. AEP has a broader national footprint, whereas Pinnacle West concentrates on Arizona. AEP’s larger scale is reflected in its higher market cap and workforce, while Pinnacle West operates with fewer employees and a more regional focus. Both companies maintain significant infrastructure assets to support their operations.
Income Statement Comparison
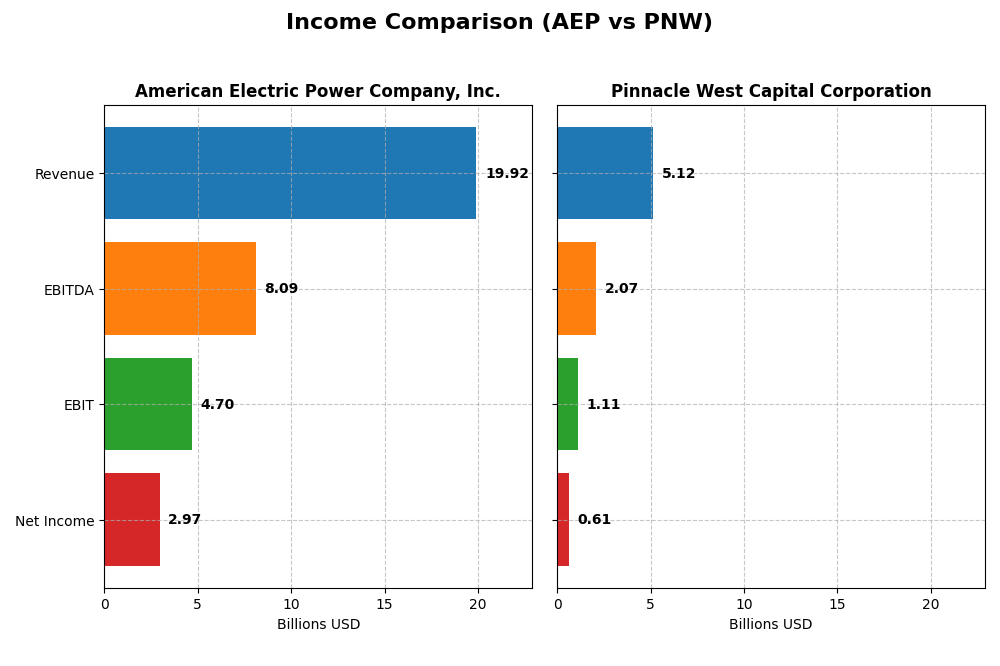
The following table presents a side-by-side comparison of the key income statement metrics for American Electric Power Company, Inc. (AEP) and Pinnacle West Capital Corporation (PNW) for the fiscal year 2024.
| Metric | American Electric Power Company, Inc. (AEP) | Pinnacle West Capital Corporation (PNW) |
|---|---|---|
| Market Cap | 62.6B | 10.7B |
| Revenue | 19.9B | 5.1B |
| EBITDA | 8.1B | 2.1B |
| EBIT | 4.7B | 1.1B |
| Net Income | 3.0B | 609M |
| EPS | 5.60 | 5.35 |
| Fiscal Year | 2024 | 2024 |
Income Statement Interpretations
American Electric Power Company, Inc.
American Electric Power Company, Inc. shows a steady revenue increase of 33.6% over 2020-2024, with net income growing 34.9%. Margins remain strong and mostly stable, with a favorable gross margin at 31.9% and a net margin near 15%. The 2024 year featured slower revenue growth at 2.8% but marked improvements in gross profit and net margin, indicating enhanced operational efficiency.
Pinnacle West Capital Corporation
Pinnacle West Capital Corporation experienced solid revenue growth of 42.9% from 2020 to 2024, with net income increasing by 10.6%. The company maintains a favorable gross margin at 41.7% and an 11.9% net margin, though net margin declined by 22.6% over the full period. In 2024, revenue grew 9.1% and net margin improved by 11.2%, reflecting ongoing profitability gains despite rising operating expenses.
Which one has the stronger fundamentals?
Both companies exhibit favorable income growth and margin profiles, with Pinnacle West showing higher revenue growth and gross margin, while American Electric Power delivers stronger net income growth and more stable net margins. American Electric Power’s consistent margin expansion contrasts with Pinnacle West’s net margin decline over the period, presenting a mixed but generally favorable fundamental outlook for both firms.
Financial Ratios Comparison
The table below presents a side-by-side comparison of key financial ratios for American Electric Power Company, Inc. (AEP) and Pinnacle West Capital Corporation (PNW) based on their most recent fiscal year data (2024).
| Ratios | American Electric Power Company, Inc. (AEP) | Pinnacle West Capital Corporation (PNW) |
|---|---|---|
| ROE | 11.0% | 9.0% |
| ROIC | 5.0% | 3.5% |
| P/E | 16.5 | 15.9 |
| P/B | 1.81 | 1.43 |
| Current Ratio | 0.44 | 0.59 |
| Quick Ratio | 0.31 | 0.42 |
| D/E (Debt-to-Equity) | 1.70 | 1.64 |
| Debt-to-Assets | 44.4% | 42.3% |
| Interest Coverage | 2.56 | 2.68 |
| Asset Turnover | 0.19 | 0.20 |
| Fixed Asset Turnover | 0.24 | 0.25 |
| Payout Ratio | 64.2% | 64.8% |
| Dividend Yield | 3.89% | 4.09% |
Interpretation of the Ratios
American Electric Power Company, Inc.
American Electric Power shows mixed financial strength with favorable net margin (14.9%) and dividend yield (3.89%), but concerns arise from low current (0.44) and quick ratios (0.31), high debt-to-equity (1.7), and weak asset turnover. The return on equity is neutral at 11.01%, while return on invested capital is unfavorable at 4.96%. The company pays dividends with a sustainable yield supported by moderate payout risks.
Pinnacle West Capital Corporation
Pinnacle West exhibits a favorable net margin (11.88%) and dividend yield (4.09%), yet it faces challenges such as low return on equity (9.01%) and invested capital (3.48%), alongside an unfavorable current ratio (0.59) and high debt-to-equity (1.64). Asset turnover remains weak. The dividend payments appear consistent, but financial leverage and liquidity ratios warrant attention.
Which one has the best ratios?
Both companies present slightly unfavorable overall ratio profiles with similar liquidity and leverage concerns. Pinnacle West has a marginally higher favorable ratio percentage (28.57% vs. 21.43%) and a stronger dividend yield, but American Electric Power achieves a higher net margin and return on equity. Neither stands out decisively, reflecting balanced strengths and weaknesses.
Strategic Positioning
This section compares the strategic positioning of AEP and PNW, including market position, key segments, and exposure to technological disruption:
American Electric Power Company, Inc. (AEP)
- Large market cap of 62.6B with moderate beta, facing regulated electric industry competition
- Diverse segments including generation, transmission, distribution, and marketing with a broad energy mix
- Uses coal, natural gas, nuclear, hydro, solar, wind; diversification may mitigate disruption risks
Pinnacle West Capital Corporation (PNW)
- Smaller market cap of 10.7B, also regulated electric, with lower beta and regional focus in Arizona
- Focused on electric service, transmission, and wholesale energy primarily in Arizona with regulated generation capacity
- Uses coal, nuclear, gas, oil, solar; regional exposure could limit technological adaptability
AEP vs PNW Positioning
AEP’s diversified national operations contrast with PNW’s concentrated regional focus. AEP’s broader energy sources and segments offer scale advantages, while PNW’s limited geography and generation mix may constrain growth and flexibility.
Which has the best competitive advantage?
Both companies are shedding value with ROIC below WACC; however, AEP shows a growing ROIC trend, indicating improving profitability, whereas PNW’s declining ROIC suggests worsening value destruction.
Stock Comparison
The stock prices of American Electric Power Company, Inc. (AEP) and Pinnacle West Capital Corporation (PNW) showed significant bullish trends over the past 12 months, with notable deceleration and contrasting recent movements.
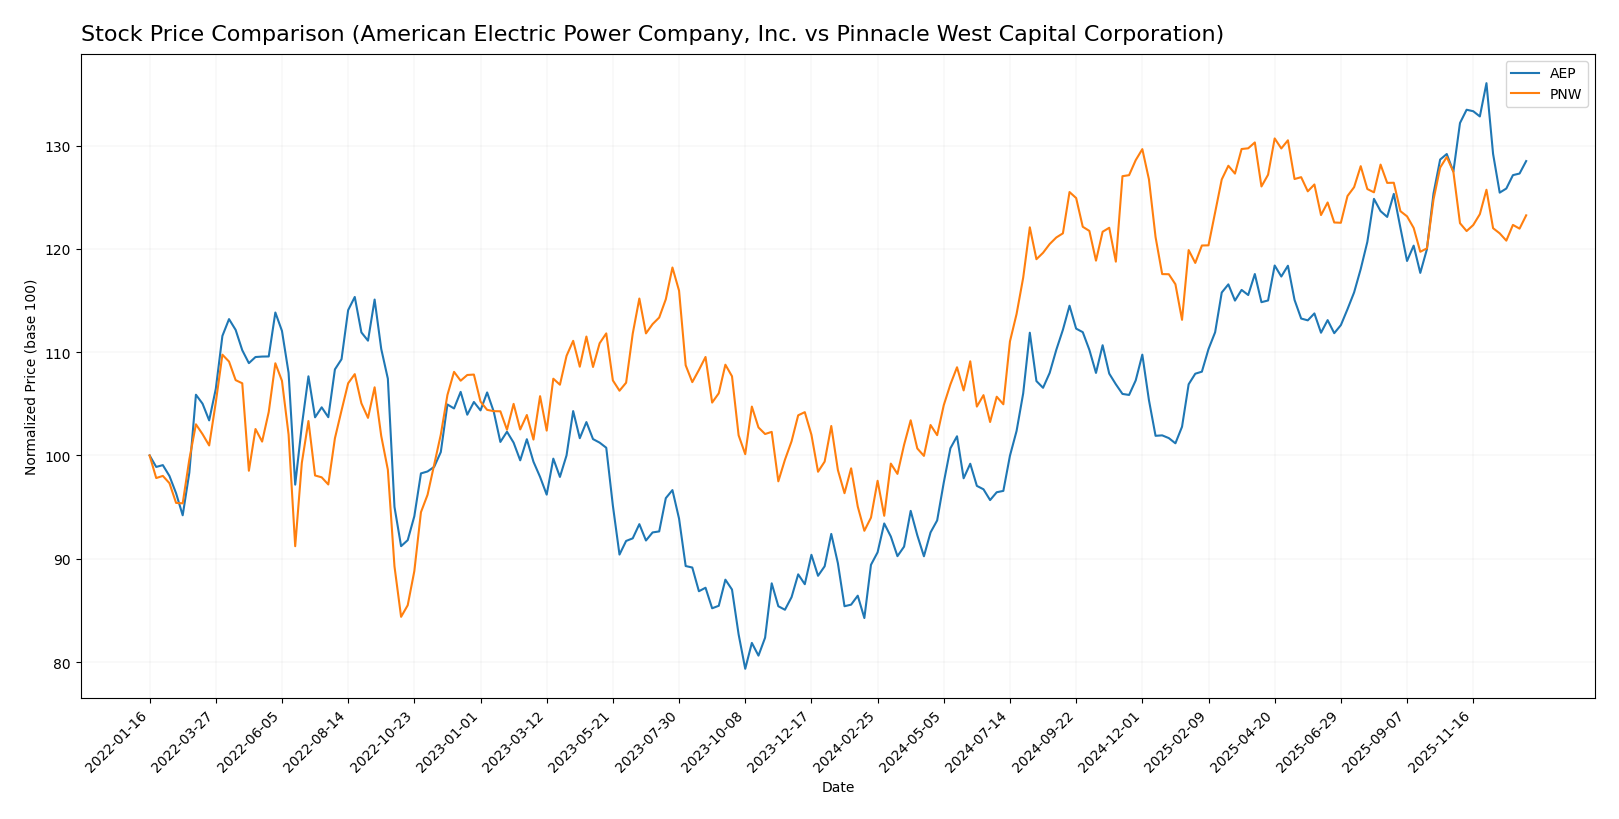
Trend Analysis
American Electric Power Company, Inc. (AEP) exhibited a strong bullish trend with a 43.71% price increase over the past year, accompanied by a deceleration in momentum and a standard deviation of 10.6, indicating moderate volatility.
Pinnacle West Capital Corporation (PNW) also showed a bullish trend with a 31.14% gain over the past year, though with decelerating momentum and lower volatility (std deviation 6.87). Recently, PNW’s price declined by 3.31%, indicating a short-term bearish trend.
Comparing both stocks, AEP delivered the highest market performance over the last 12 months, outperforming PNW by over 12 percentage points in price appreciation.
Target Prices
Analysts present a clear target price consensus for American Electric Power Company, Inc. and Pinnacle West Capital Corporation.
| Company | Target High | Target Low | Consensus |
|---|---|---|---|
| American Electric Power Company, Inc. | 138 | 107 | 126.82 |
| Pinnacle West Capital Corporation | 115 | 85 | 96.33 |
The consensus target prices suggest a moderate upside potential for both stocks, with AEP’s target consensus above its current price of 116.91 USD, and PNW’s target consensus also higher than its 89.07 USD price, indicating generally positive analyst expectations.
Analyst Opinions Comparison
This section compares analysts’ ratings and financial scores for American Electric Power Company, Inc. (AEP) and Pinnacle West Capital Corporation (PNW):
Rating Comparison
AEP Rating
- Rating: B+, categorized as Very Favorable by analysts.
- Discounted Cash Flow Score: 4, indicating Favorable valuation based on future cash flows.
- ROE Score: 4, showing efficient profit generation from equity.
- ROA Score: 4, demonstrating strong asset utilization.
- Debt To Equity Score: 2, reflecting moderate financial risk.
- Overall Score: 3, a moderate overall financial standing.
PNW Rating
- Rating: C+, also categorized as Very Favorable.
- Discounted Cash Flow Score: 1, indicating a Very Unfavorable valuation.
- ROE Score: 3, indicating moderate efficiency in profit generation.
- ROA Score: 3, showing moderate asset utilization.
- Debt To Equity Score: 1, indicating very unfavorable financial risk.
- Overall Score: 2, representing a moderate but lower standing than AEP.
Which one is the best rated?
Based strictly on the provided data, AEP holds a higher rating (B+) and better financial scores across key metrics, especially discounted cash flow and return measures, compared to PNW’s lower rating (C+) and less favorable scores.
Scores Comparison
Here is a comparison of the Altman Z-Score and Piotroski Score for the two companies:
AEP Scores
- Altman Z-Score: 0.998, in distress zone indicating high bankruptcy risk.
- Piotroski Score: 6, average financial strength.
PNW Scores
- Altman Z-Score: 0.727, in distress zone indicating very high bankruptcy risk.
- Piotroski Score: 4, average but weaker financial strength than AEP.
Which company has the best scores?
Based strictly on the data, AEP has a higher Altman Z-Score and a stronger Piotroski Score than PNW. Both companies are in the distress zone, but AEP’s scores indicate relatively better financial health.
Grades Comparison
The following presents the recent and reliable grades assigned to American Electric Power Company, Inc. and Pinnacle West Capital Corporation:
American Electric Power Company, Inc. Grades
This table summarizes recent grade updates by major financial institutions for American Electric Power Company, Inc.:
| Grading Company | Action | New Grade | Date |
|---|---|---|---|
| UBS | Maintain | Sell | 2025-12-17 |
| JP Morgan | Maintain | Neutral | 2025-12-12 |
| Jefferies | Upgrade | Buy | 2025-11-17 |
| Citigroup | Maintain | Neutral | 2025-10-31 |
| Wells Fargo | Maintain | Overweight | 2025-10-30 |
| Evercore ISI Group | Maintain | Outperform | 2025-10-30 |
| Morgan Stanley | Maintain | Overweight | 2025-10-30 |
| Mizuho | Maintain | Neutral | 2025-10-30 |
| BMO Capital | Downgrade | Market Perform | 2025-10-30 |
| Scotiabank | Maintain | Sector Perform | 2025-10-30 |
American Electric Power displays a mixed but generally positive trend, with multiple firms maintaining overweight or outperform ratings and one upgrade to buy.
Pinnacle West Capital Corporation Grades
Recent grade updates from financial institutions for Pinnacle West Capital Corporation are summarized below:
| Grading Company | Action | New Grade | Date |
|---|---|---|---|
| UBS | Maintain | Neutral | 2025-12-17 |
| Keybanc | Downgrade | Sector Weight | 2025-12-12 |
| Keybanc | Maintain | Overweight | 2025-10-15 |
| UBS | Maintain | Neutral | 2025-10-10 |
| Barclays | Maintain | Equal Weight | 2025-10-07 |
| Argus Research | Maintain | Buy | 2025-09-30 |
| Morgan Stanley | Maintain | Equal Weight | 2025-09-25 |
| UBS | Maintain | Neutral | 2025-09-12 |
| Mizuho | Downgrade | Neutral | 2025-09-09 |
| Barclays | Maintain | Equal Weight | 2025-08-13 |
Pinnacle West Capital shows a more neutral consensus with several equal weight or neutral ratings and some recent downgrades from outperform to neutral.
Which company has the best grades?
American Electric Power holds a stronger consensus with more buy and outperform ratings compared to Pinnacle West Capital’s predominantly neutral and equal weight grades. This suggests a relatively more favorable outlook by analysts for American Electric Power, which may influence investor confidence differently for each stock.
Strengths and Weaknesses
Below is a comparison table summarizing key strengths and weaknesses of American Electric Power Company, Inc. (AEP) and Pinnacle West Capital Corporation (PNW) based on recent financial and strategic data.
| Criterion | American Electric Power Company, Inc. (AEP) | Pinnacle West Capital Corporation (PNW) |
|---|---|---|
| Diversification | Strong revenue from transmission & distribution (5.88B in 2024), plus generation and marketing segments | Less diversified, mostly electric service (2.56B in 2024) with smaller wholesale and transmission services |
| Profitability | Net margin favorable at 14.9%, ROE neutral at 11.01%, but ROIC unfavorable at 4.96% (below WACC) | Net margin favorable at 11.88%, ROE unfavorable at 9.01%, ROIC also unfavorable at 3.48% (below WACC) |
| Innovation | Moderate focus on transmission infrastructure, some growth in ROIC indicating operational improvements | Declining ROIC trend suggests challenges in innovation or efficiency gains |
| Global presence | Primarily US-focused with extensive transmission and distribution network | Regional focus in the US Southwest, limited global presence |
| Market Share | Large vertically integrated utility with significant market share in transmission and distribution | Smaller market share, more regional utility player with limited competitive moat |
Key takeaways: AEP benefits from a diversified utility portfolio with substantial transmission assets and improving profitability trends despite currently shedding value. PNW shows weaker financial metrics with declining profitability and a narrower regional focus, posing higher investment risk. Both companies face challenges in ROIC relative to their cost of capital, suggesting cautious consideration for investors.
Risk Analysis
Below is a comparison table highlighting key risk factors for American Electric Power Company, Inc. (AEP) and Pinnacle West Capital Corporation (PNW) as of 2024-2026.
| Metric | American Electric Power (AEP) | Pinnacle West Capital (PNW) |
|---|---|---|
| Market Risk | Moderate (Beta 0.615) | Lower (Beta 0.543) |
| Debt Level | High (Debt/Equity 1.7, Distress Altman Z-Score) | High (Debt/Equity 1.64, Distress Altman Z-Score) |
| Regulatory Risk | Significant (Utility sector, evolving energy policies) | Significant (Utility sector, Arizona-focused regulations) |
| Operational Risk | Moderate (Aging infrastructure, transition to renewables) | Moderate (Infrastructure maintenance, energy mix transition) |
| Environmental Risk | Elevated (Coal and gas-heavy generation mix) | Elevated (Coal, gas, and nuclear reliance) |
| Geopolitical Risk | Low to Moderate (US domestic focus) | Low to Moderate (US domestic focus, regional exposure) |
Both companies face considerable financial risk as indicated by their distress zone Altman Z-scores and high debt-to-equity ratios. Regulatory and environmental risks are prominent given their reliance on fossil fuels amidst tightening emissions standards and the energy transition. Market risk is moderate but manageable due to relatively low betas. Operational challenges center on infrastructure upgrades and renewable integration. Investors should weigh these risks carefully against dividend yields and sector stability when considering these utilities.
Which Stock to Choose?
American Electric Power Company, Inc. (AEP) shows favorable income growth with a 34.86% net income increase over 2020-2024 and strong profitability metrics including a 14.9% net margin. Its financial ratios reveal mixed signals: a slightly unfavorable global ratio stance with a 1.7 debt-to-equity level and low liquidity ratios. The company’s rating is very favorable with a B+ score, supported by strong ROE and ROA scores but moderate leverage metrics.
Pinnacle West Capital Corporation (PNW) demonstrates solid income growth with a 42.88% revenue increase overall and a favorable gross margin of 41.7%, though net margin growth is negative over the period. Financial ratios similarly appear slightly unfavorable, with a 1.64 debt-to-equity ratio and moderate liquidity challenges. Its rating is very favorable with a C+ grade, but weaker discounted cash flow and debt-to-equity scores compared to AEP.
For investors focused on income statement strength and higher profitability, AEP might appear more favorable given its positive earnings growth and stronger rating. Conversely, investors prioritizing revenue growth and dividend yield could see PNW as a viable option despite its financial constraints. Risk-averse investors may consider the moderate leverage and liquidity profiles of both companies, while growth-oriented investors might weigh the differences in income and cash flow trends.
Disclaimer: Investment carries a risk of loss of initial capital. The past performance is not a reliable indicator of future results. Be sure to understand risks before making an investment decision.
Go Further
I encourage you to read the complete analyses of American Electric Power Company, Inc. and Pinnacle West Capital Corporation to enhance your investment decisions: