Home > Comparison > Utilities > AEP vs PCG
The strategic rivalry between American Electric Power Company, Inc. (AEP) and Pacific Gas & Electric Co. (PCG) shapes the utilities sector’s evolution. AEP operates as a vertically integrated utility with diverse generation sources, while PCG focuses on regulated electric and gas services in California, integrating smart grid technology. This analysis pits AEP’s broad asset base against PCG’s innovation-driven model to determine which offers a superior risk-adjusted profile for a diversified portfolio.
Table of contents
Companies Overview
American Electric Power Company, Inc. and Pacific Gas & Electric Co. hold pivotal roles in the U.S. regulated electric utility sector.
American Electric Power Company, Inc.: Vertically Integrated Utility Powerhouse
American Electric Power dominates as a vertically integrated utility generating, transmitting, and distributing electricity across the U.S. It earns revenue through retail and wholesale electricity sales. In 2026, AEP focuses strategically on expanding its renewable energy mix while maintaining a robust transmission network to support grid reliability and growth.
Pacific Gas & Electric Co.: Innovative California Energy Provider
Pacific Gas & Electric Co. serves northern and central California with electricity and natural gas, generating power from nuclear, hydro, fossil fuels, and solar sources. Its core revenue stream lies in regulated electric and gas sales. In 2026, PG&E prioritizes integrating smart grid technology, including personal microgrid backup devices, enhancing customer energy management and system resilience.
Strategic Collision: Similarities & Divergences
Both companies operate within the regulated electric utility space but diverge in approach. AEP emphasizes a vertically integrated model with a broad fuel mix, while PG&E leans on technological innovation in a regional market. Their primary battleground is grid modernization and renewable integration. Investors face distinct profiles: AEP offers scale and diversification; PG&E targets tech-driven customer engagement in a complex regulatory environment.
Income Statement Comparison
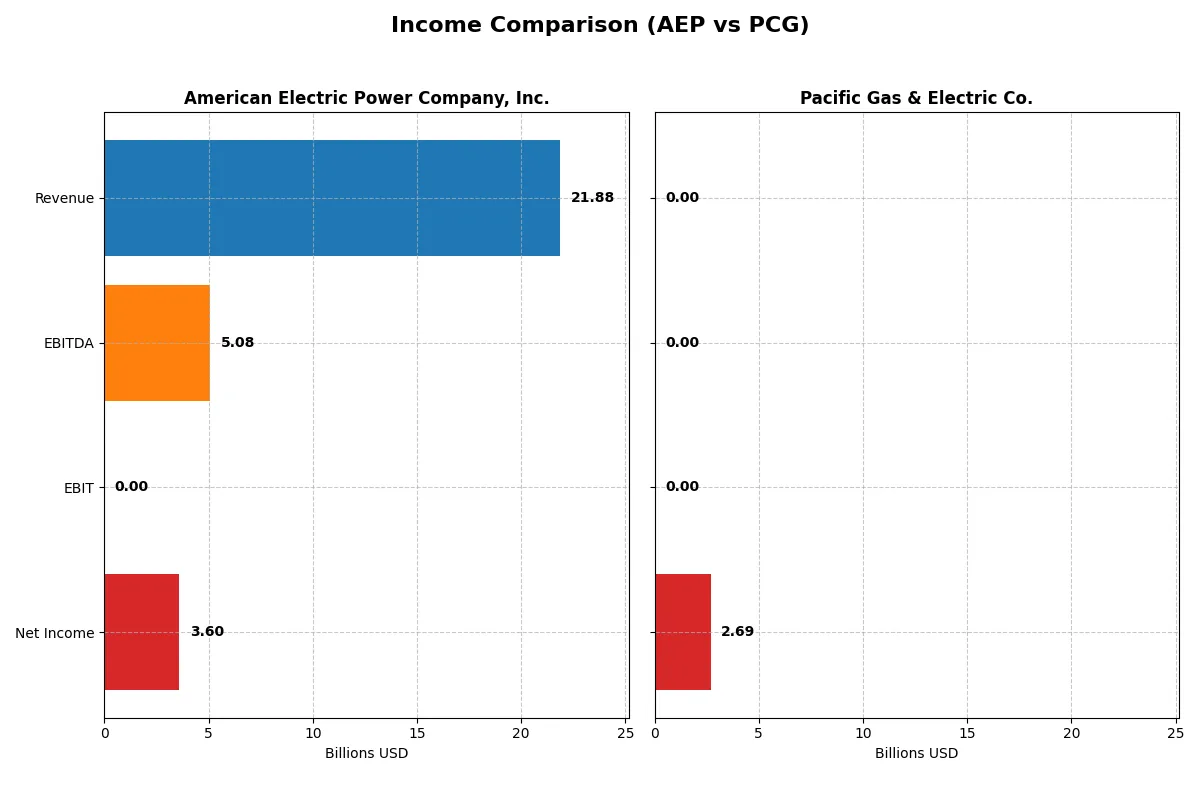
This data dissects the core profitability and scalability of both corporate engines to reveal who dominates the bottom line:
| Metric | American Electric Power Company, Inc. (AEP) | Pacific Gas & Electric Co. (PCG) |
|---|---|---|
| Revenue | 21.88B | 0 |
| Cost of Revenue | 0 | 0 |
| Operating Expenses | 0 | -207M |
| Gross Profit | 0 | 0 |
| EBITDA | 5.08B | 0 |
| EBIT | 0 | 0 |
| Interest Expense | -2.03B | -315M |
| Net Income | 3.60B | 2.69B |
| EPS | 6.66 | 1.18 |
| Fiscal Year | 2025 | 2025 |
Income Statement Analysis: The Bottom-Line Duel
This income statement comparison reveals which company operates with superior efficiency and sustainable profitability over recent years.
American Electric Power Company, Inc. Analysis
American Electric Power (AEP) shows steady revenue growth, climbing from $16.6B in 2021 to $21.9B in 2025. Net income advances strongly to $3.6B in 2025, reflecting a healthy 16.4% net margin. Despite a drop in gross profit in 2025, AEP’s net margin and EPS growth indicate improving operational momentum and effective cost control, especially in interest expenses.
Pacific Gas & Electric Co. Analysis
Pacific Gas & Electric (PCG) experiences volatility with revenue collapsing to zero in 2025 after peaking near $24.4B in prior years. Net income rebounds to $2.7B in 2025 despite no reported revenue, signaling accounting anomalies or asset sales. Margins collapse by 2025, and revenue growth is negative. PCG shows erratic profitability and weak margin health, undermining operational consistency.
Verdict: Consistent Growth vs. Volatile Recovery
AEP demonstrates consistent revenue and net income growth with improving margins, signaling a fundamentally sound business. In contrast, PCG’s financials reflect sharp revenue declines and irregular profitability. For investors prioritizing stable earnings and operational clarity, AEP’s profile offers greater reliability and efficiency.
Financial Ratios Comparison
These vital ratios act as a diagnostic tool to expose the underlying fiscal health, valuation premiums, and capital efficiency of the companies compared below:
| Ratios | American Electric Power Company, Inc. (AEP) | Pacific Gas & Electric Co. (PCG) |
|---|---|---|
| ROE | 11.55% | 8.26% |
| ROIC | -54.56% | 0% |
| P/E | 16.64 | 13.13 |
| P/B | 1.92 | 1.08 |
| Current Ratio | 0.44 | 0.03 |
| Quick Ratio | 0.31 | 0.03 |
| D/E | 0.14 | 0.27 |
| Debt-to-Assets | 0.44 | 0.19 |
| Interest Coverage | -2.63 | 0 |
| Asset Turnover | 0 | 0 |
| Fixed Asset Turnover | 0 | 0 |
| Payout ratio | 55.86% | 8.17% |
| Dividend yield | 3.36% | 0.62% |
| Fiscal Year | 2025 | 2025 |
Efficiency & Valuation Duel: The Vital Signs
Ratios act as a company’s DNA, exposing hidden risks and operational strengths critical for informed investment decisions.
American Electric Power Company, Inc.
American Electric Power shows solid profitability with an 11.55% ROE and a 16.43% net margin, signaling operational effectiveness. The P/E of 16.64 and P/B of 1.92 suggest a fairly valued stock. A 3.36% dividend yield rewards shareholders, reflecting steady capital return despite some balance sheet concerns.
Pacific Gas & Electric Co.
Pacific Gas & Electric displays weaker profitability, with an 8.26% ROE and zero net margin, indicating operational challenges. Its lower P/E of 13.13 and P/B of 1.08 imply a cheaper valuation. The 0.62% dividend yield is modest, pointing to limited shareholder returns amid unfavorable profitability metrics.
Balanced Profitability vs. Discounted Risk Profile
American Electric Power delivers a healthier profitability profile with a fair valuation and stronger dividend yield. Pacific Gas & Electric offers a cheaper entry but struggles with operational inefficiencies and weaker returns. Investors seeking stable income may prefer AEP, while those tolerating risk might consider PCG’s discounted valuation.
Which one offers the Superior Shareholder Reward?
I compare American Electric Power Company, Inc. (AEP) and Pacific Gas & Electric Co. (PCG) on dividends, payout ratios, and buybacks to identify the superior shareholder reward in 2026.
AEP yields 3.36% with a 56% payout ratio, strongly supported by free cash flow of 13.1/share, and maintains a robust buyback program enhancing total return. PCG pays a minimal 0.62% dividend with an 8% payout ratio, reflecting weak free cash flow (-1.4/share) and limited buybacks. AEP’s balanced distribution model combining sustainable dividends and active buybacks outperforms PCG’s conservative payout and reinvestment strategy. I conclude AEP offers the more attractive total return profile for investors in 2026.
Comparative Score Analysis: The Strategic Profile
The radar chart reveals the fundamental DNA and trade-offs of American Electric Power Company, Inc. and Pacific Gas & Electric Co.:
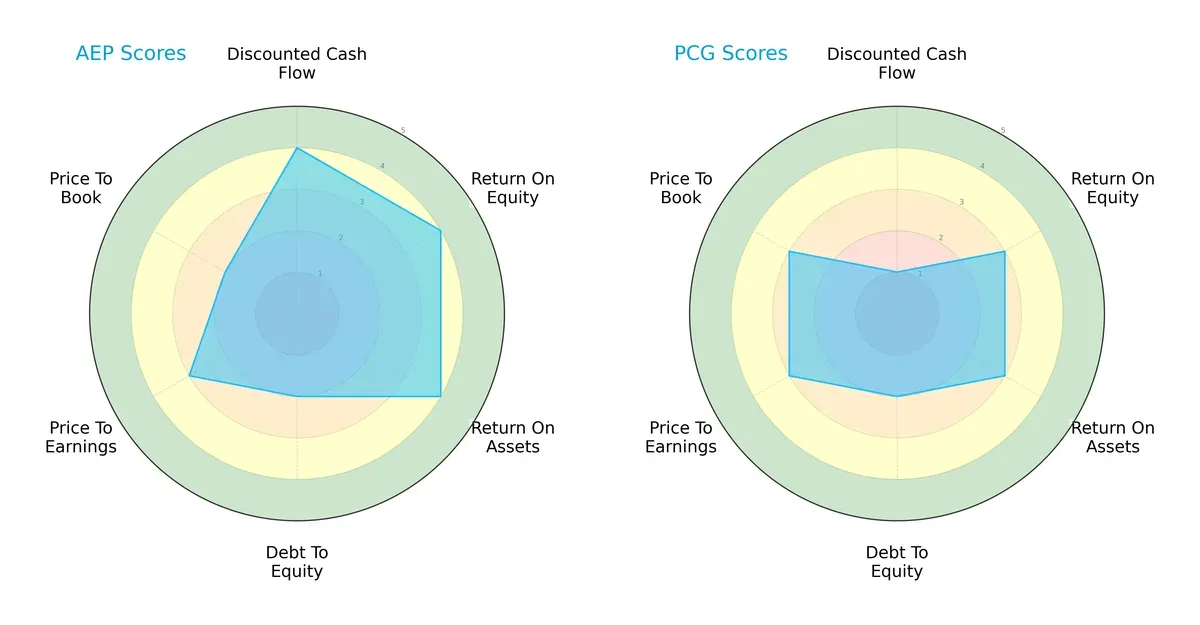
American Electric Power (AEP) outperforms Pacific Gas & Electric (PCG) in discounted cash flow, ROE, and ROA, signaling stronger profitability and asset use. Both share weak debt-to-equity scores, indicating elevated leverage risks. PCG’s valuation metrics (PE/PB) are slightly better, showing modestly more attractive pricing. AEP exhibits a more balanced profile, while PCG leans on valuation appeal amid operational challenges.
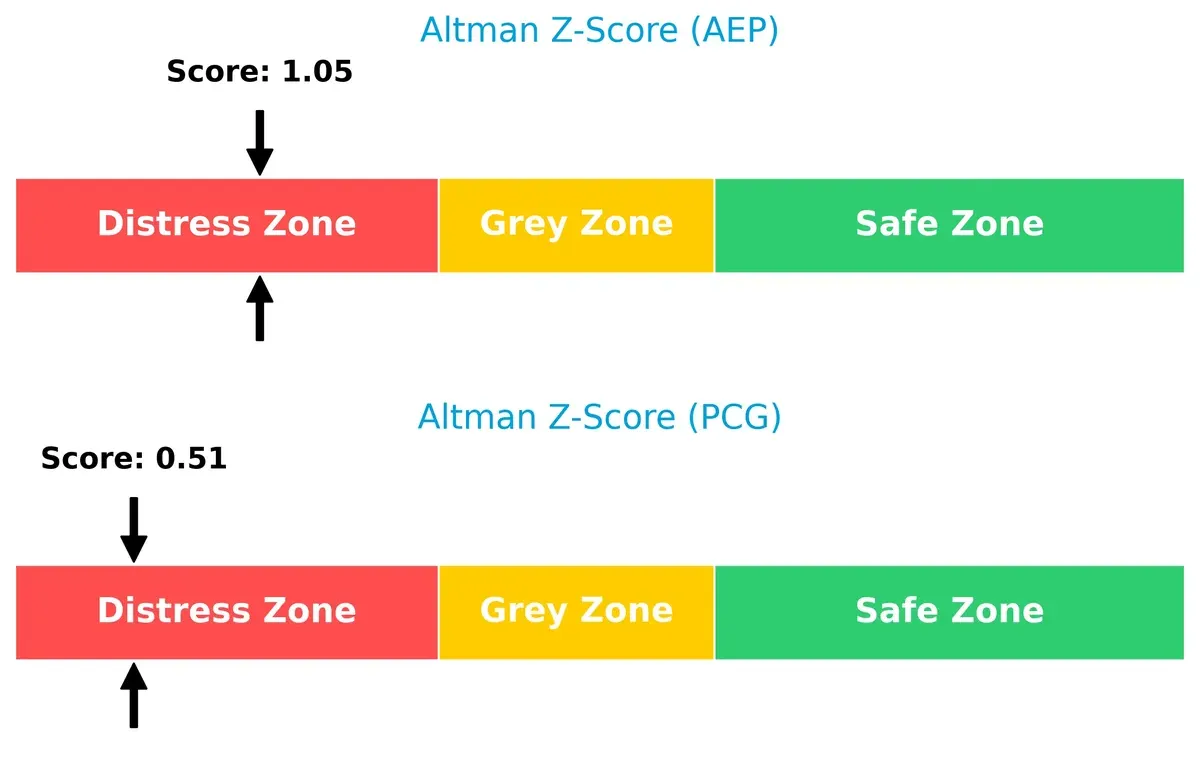
Bankruptcy Risk: Solvency Showdown
AEP’s Altman Z-Score of 1.05 slightly exceeds PCG’s 0.51, but both remain in the distress zone, signaling elevated bankruptcy risk amid economic headwinds:
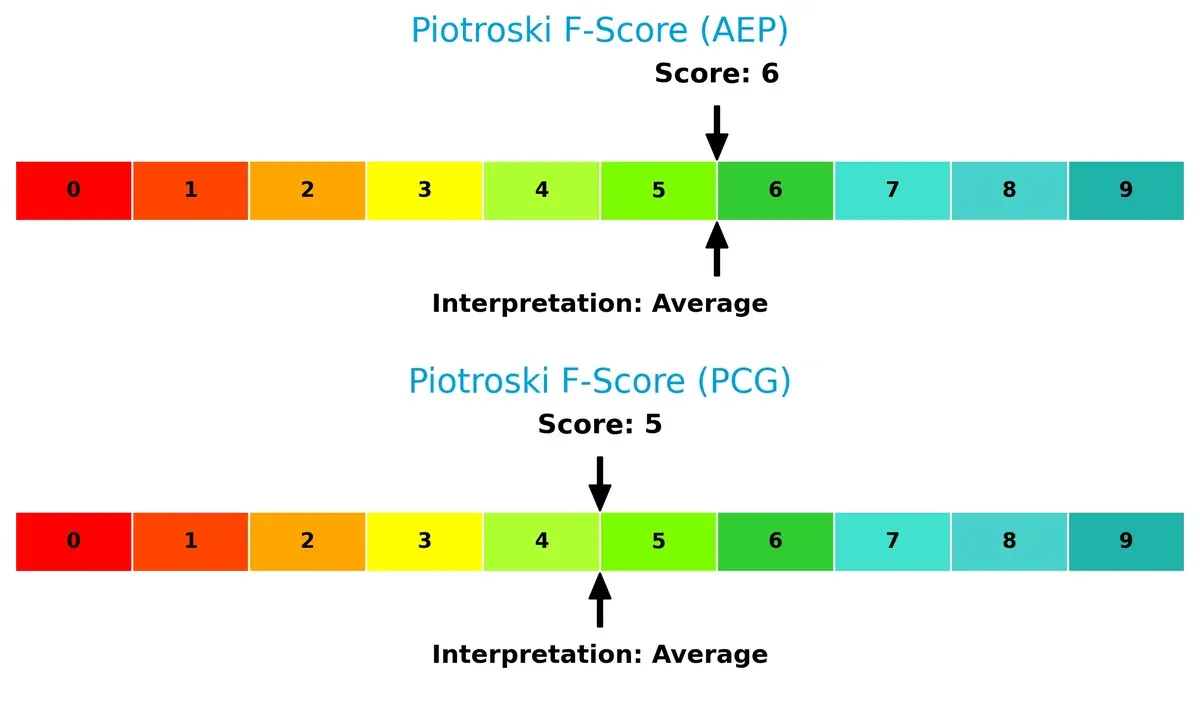
Financial Health: Quality of Operations
Both firms score average Piotroski F-Scores—AEP at 6 and PCG at 5—indicating moderate financial health but not peak operational strength. Neither displays clear red flags, yet neither signals robust internal metrics either:
How are the two companies positioned?
This section dissects AEP and PCG’s operational DNA by comparing revenue distribution and internal dynamics. The goal is to confront their economic moats and reveal which model holds the most resilient competitive advantage today.
Revenue Segmentation: The Strategic Mix
This comparison dissects how American Electric Power and Pacific Gas & Electric diversify income streams and where their primary sector bets lie:
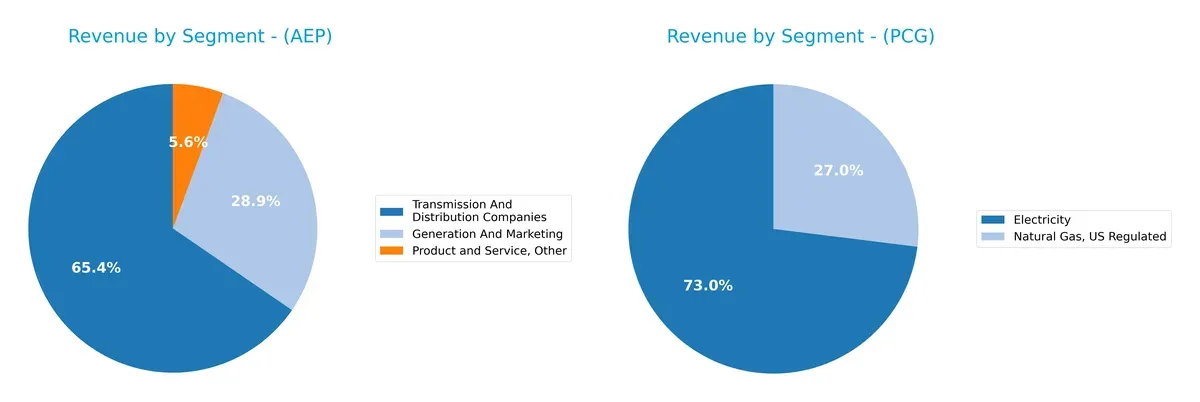
American Electric Power anchors revenue in Transmission and Distribution Companies with $6.1B, complemented by $2.7B from Generation and Marketing, showing moderate diversification. Pacific Gas & Electric pivots heavily on Electricity at $18.3B, with a significant $6.8B from Natural Gas, US Regulated, reflecting a strong dual-sector focus. AEP’s model suggests infrastructure dominance, while PCG’s split implies balanced exposure but risk concentration in energy delivery sectors.
Strengths and Weaknesses Comparison
This table compares the Strengths and Weaknesses of American Electric Power Company, Inc. (AEP) and Pacific Gas & Electric Co. (PCG):
AEP Strengths
- Diverse revenue streams including Generation, Transmission, and Marketing
- Favorable net margin at 16.43%
- Low debt-to-equity ratio at 0.14 indicating conservative leverage
- Dividend yield of 3.36% supports income investors
- WACC favorable at 6.31% supporting investment returns
PCG Strengths
- Favorable WACC at 4.93% reduces capital costs
- Attractive P/E of 13.13 and P/B of 1.08 suggest undervaluation
- Maintains low debt-to-assets at 18.84%
- Operates in two major segments: Electricity and Natural Gas
- Debt-to-equity ratio of 0.27 remains manageable
AEP Weaknesses
- Negative ROIC at -54.56% signals poor capital efficiency
- Zero current and quick ratios raise liquidity concerns
- Negative interest coverage signals risk in servicing debt
- Asset turnover and fixed asset turnover both zero, indicating operational inefficiency
- Neutral ROE at 11.55% limits equity returns
PCG Weaknesses
- Zero net margin and ROIC show lack of profitability
- Low current and quick ratios indicate liquidity stress
- Negative interest coverage points to debt servicing issues
- Weak dividend yield at 0.62% limits shareholder return
- Higher unfavorable ratios at 64.29% indicate overall financial weakness
Both companies show strengths in capital structure management and segment diversification but face significant challenges in profitability and liquidity. AEP’s stronger net margin contrasts with PCG’s lack of profitability, impacting their strategic financial positioning.
The Moat Duel: Analyzing Competitive Defensibility
A structural moat shields long-term profits from competitive erosion. Without it, firms face relentless margin pressure and share loss:
American Electric Power Company, Inc.: Regulated Utility with Cost Advantage
AEP’s moat stems from regulated market barriers and scale-driven cost advantages. Despite declining ROIC, its steady net margin and revenue growth reflect operational resilience. New renewable projects in 2026 could deepen its cost edge, yet profitability erosion warns caution.
Pacific Gas & Electric Co.: Emerging Moat via Operational Improvement
PCG contrasts AEP with a slightly unfavorable moat but improving ROIC trend. Its regulated footprint limits competition while ongoing infrastructure upgrades boost efficiency. Though currently value-destroying, growing profitability and smart grid innovation hint at a strengthening competitive position by 2026.
Regulated Monopoly Stability vs. Operational Turnaround Momentum
I see AEP’s wider moat rooted in entrenched regulation and cost scale, but its sharply declining ROIC signals vulnerability. PCG’s narrower moat lacks excess returns but shows promising ROIC recovery, positioning it better to defend and grow market share long term.
Which stock offers better returns?
Over the past 12 months, both stocks show bullish price trends with notable acceleration, but American Electric Power Company, Inc. exhibits a far stronger price increase and higher volatility.
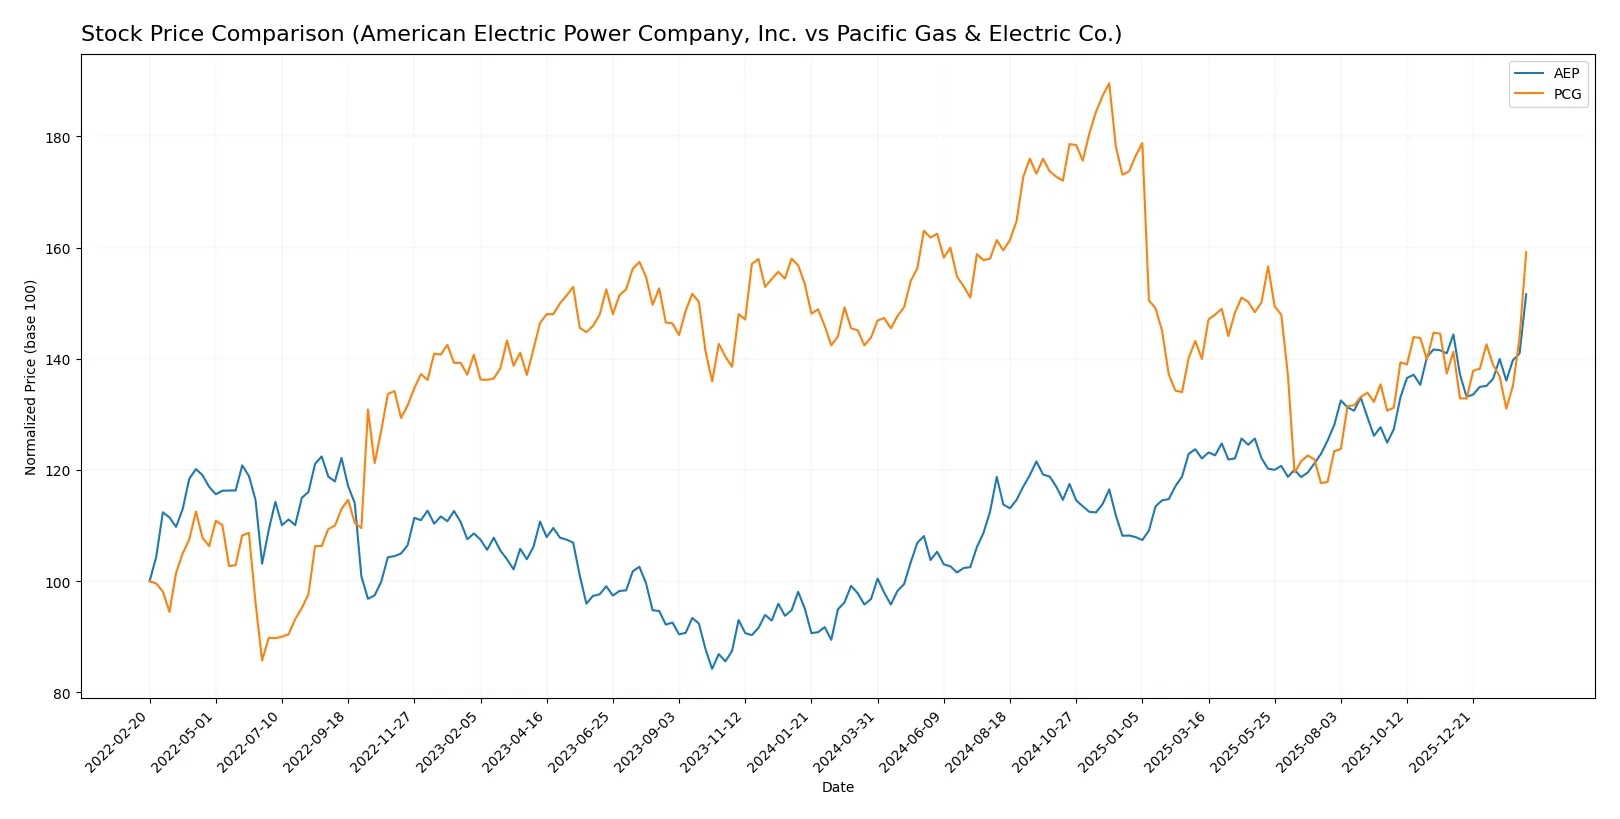
Trend Comparison
American Electric Power Company’s stock rose 56.65% over the last year, showing acceleration and a high volatility level with a standard deviation of 10.66. The price ranged between 82.1 and 129.94.
Pacific Gas & Electric’s stock increased 10.66% over the same period, also accelerating but with lower volatility, reflected by a standard deviation of 1.96. The price fluctuated between 13.42 and 21.63.
American Electric Power outperformed Pacific Gas & Electric significantly in total price appreciation, delivering the highest market return in this period.
Target Prices
Analysts present a clear target price consensus for both American Electric Power Company, Inc. and Pacific Gas & Electric Co.
| Company | Target Low | Target High | Consensus |
|---|---|---|---|
| American Electric Power Company, Inc. | 107 | 142 | 130.17 |
| Pacific Gas & Electric Co. | 18 | 25 | 21.43 |
The consensus target price for AEP sits just above its current price of $129.94, indicating modest upside potential. PCG’s consensus target price of $21.43 suggests a notable upside from its current $18.16, reflecting more optimistic analyst expectations.

Don’t Let Luck Decide Your Entry Point
Optimize your entry points with our advanced ProRealTime indicators. You’ll get efficient buy signals with precise price targets for maximum performance. Start outperforming now!
How do institutions grade them?
The following tables summarize recent institutional grades for American Electric Power Company, Inc. and Pacific Gas & Electric Co.:
American Electric Power Company, Inc. Grades
This table details recent grades and rating actions from major financial institutions.
| Grading Company | Action | New Grade | Date |
|---|---|---|---|
| Wells Fargo | maintain | Overweight | 2026-02-13 |
| Wolfe Research | upgrade | Outperform | 2026-02-13 |
| Mizuho | maintain | Neutral | 2026-02-13 |
| Barclays | maintain | Equal Weight | 2026-01-22 |
| Wells Fargo | maintain | Overweight | 2026-01-20 |
| B of A Securities | downgrade | Neutral | 2026-01-12 |
| UBS | maintain | Sell | 2025-12-17 |
| JP Morgan | maintain | Neutral | 2025-12-12 |
| Jefferies | upgrade | Buy | 2025-11-17 |
| Citigroup | maintain | Neutral | 2025-10-31 |
Pacific Gas & Electric Co. Grades
This table lists recent institutional grades and rating stances for Pacific Gas & Electric Co.
| Grading Company | Action | New Grade | Date |
|---|---|---|---|
| Jefferies | maintain | Buy | 2026-01-28 |
| Wells Fargo | maintain | Overweight | 2026-01-20 |
| JP Morgan | maintain | Overweight | 2025-12-12 |
| UBS | maintain | Neutral | 2025-10-24 |
| Jefferies | maintain | Buy | 2025-10-22 |
| BMO Capital | maintain | Outperform | 2025-10-14 |
| Jefferies | maintain | Buy | 2025-10-03 |
| Barclays | maintain | Overweight | 2025-10-01 |
| Morgan Stanley | maintain | Equal Weight | 2025-09-25 |
| Morgan Stanley | upgrade | Equal Weight | 2025-09-18 |
Which company has the best grades?
Pacific Gas & Electric Co. consistently receives “Buy,” “Overweight,” and “Outperform” ratings from multiple firms. American Electric Power shows a wider grade range, including “Sell” and neutral stances. Investors may interpret PG&E’s stronger consensus as reflecting higher institutional confidence.
Risks specific to each company
The following categories identify the critical pressure points and systemic threats facing both firms in the 2026 market environment:
1. Market & Competition
American Electric Power Company, Inc.
- Faces steady demand in regulated electric markets but must navigate increasing renewable integration and grid modernization pressures.
Pacific Gas & Electric Co.
- Operates in California’s complex energy market with rising competition from distributed energy resources and aggressive clean energy mandates.
2. Capital Structure & Debt
American Electric Power Company, Inc.
- Maintains low debt-to-equity ratio (0.14), signaling strong balance sheet but shows concerning negative interest coverage.
Pacific Gas & Electric Co.
- Higher leverage (0.27 D/E) increases financial risk; interest coverage also weak, raising solvency concerns amid capital-intensive operations.
3. Stock Volatility
American Electric Power Company, Inc.
- Beta of 0.61 indicates moderate volatility, offering some stability relative to the overall market.
Pacific Gas & Electric Co.
- Lower beta of 0.37 suggests less sensitivity to market swings but may imply limited upside in strong rallies.
4. Regulatory & Legal
American Electric Power Company, Inc.
- Subject to federal and state regulations with moderate exposure to policy shifts on emissions and infrastructure.
Pacific Gas & Electric Co.
- Faces intense regulatory scrutiny in California, including liabilities from wildfire risks and legal challenges impacting operations.
5. Supply Chain & Operations
American Electric Power Company, Inc.
- Vertically integrated utilities model reduces supply chain complexity but must manage fuel mix transition risks.
Pacific Gas & Electric Co.
- Complex operations with natural gas and electric distribution face supply chain vulnerabilities and operational disruptions from climate events.
6. ESG & Climate Transition
American Electric Power Company, Inc.
- Progressing in renewable energy integration but coal reliance poses decarbonization challenges.
Pacific Gas & Electric Co.
- Aggressively pursuing clean energy but wildfire liabilities and carbon footprint complicate ESG profile.
7. Geopolitical Exposure
American Electric Power Company, Inc.
- Primarily domestic U.S. operations with minimal geopolitical risks.
Pacific Gas & Electric Co.
- Concentrated in California, potentially exposed to state-specific policy changes and natural disaster risks.
Which company shows a better risk-adjusted profile?
American Electric Power’s most impactful risk is its negative interest coverage, undermining its financial resilience despite a strong balance sheet. Pacific Gas & Electric faces severe regulatory and legal risks linked to wildfire liabilities and operational hazards. Despite both being in distress zones for bankruptcy risk, AEP’s moderate market volatility and stronger capital structure offer a comparatively better risk-adjusted profile. The persistence of wildfire-related regulatory pressures for PCG justifies heightened caution.
Final Verdict: Which stock to choose?
American Electric Power Company, Inc. (AEP) excels as a robust cash generator with steady income growth and a reliable dividend yield. Its main point of vigilance is the persistent negative return on invested capital, signaling value erosion. AEP suits portfolios focused on income and moderate growth with an appetite for operational risks.
Pacific Gas & Electric Co. (PCG) offers a strategic moat through improving profitability trends and modest valuation multiples. While its financial health shows some distress signals, it presents a relatively safer profile than AEP in terms of capital structure. PCG fits well with investors pursuing growth at a reasonable price (GARP) and seeking gradual stability.
If you prioritize consistent income and cash generation despite capital inefficiencies, AEP is the compelling choice due to its strong dividend and growth momentum. However, if you seek improving profitability with better valuation discipline and a more cautious risk profile, PCG offers superior stability and potential upside as its operational metrics improve.
Disclaimer: Investment carries a risk of loss of initial capital. The past performance is not a reliable indicator of future results. Be sure to understand risks before making an investment decision.
Go Further
I encourage you to read the complete analyses of American Electric Power Company, Inc. and Pacific Gas & Electric Co. to enhance your investment decisions: