In the evolving energy sector, American Electric Power Company, Inc. (AEP) and Oklo Inc. represent two distinct yet overlapping approaches to electricity generation. AEP, a century-old utility giant, blends traditional and renewable sources, while Oklo pioneers advanced fission technology for clean power. Comparing their market positions and innovation strategies offers valuable insights for investors seeking growth and stability. Let’s explore which company holds the most promise for your investment portfolio.
Table of contents
Companies Overview
I will begin the comparison between American Electric Power Company, Inc. and Oklo Inc. by providing an overview of these two companies and their main differences.
American Electric Power Company, Inc. Overview
American Electric Power Company, Inc. is a major electric public utility holding company in the U.S., focused on generating, transmitting, and distributing electricity to retail and wholesale customers. Established in 1906 and headquartered in Columbus, Ohio, it operates through multiple segments using diverse energy sources including coal, natural gas, nuclear, hydro, solar, and wind. The company is well-established with a market cap of 62.6B USD.
Oklo Inc. Overview
Oklo Inc. is a newer player in the regulated electric sector, designing and developing fission power plants for commercial-scale energy production in the U.S. Founded in 2013 and based in Santa Clara, California, Oklo also offers used nuclear fuel recycling services. Despite its smaller size with a market cap of 16.5B USD and 120 employees, it is positioned in a specialized niche within the utilities sector.
Key similarities and differences
Both companies operate in the regulated electric utilities sector in the U.S., focusing on providing reliable energy. However, AEP has a broad energy portfolio and a long history, serving a wide customer base with vertically integrated utilities. In contrast, Oklo specializes in advanced nuclear technology and fuel recycling, representing a more focused and innovative approach. Their scale and market capitalization also differ significantly, reflecting their distinct business models.
Income Statement Comparison
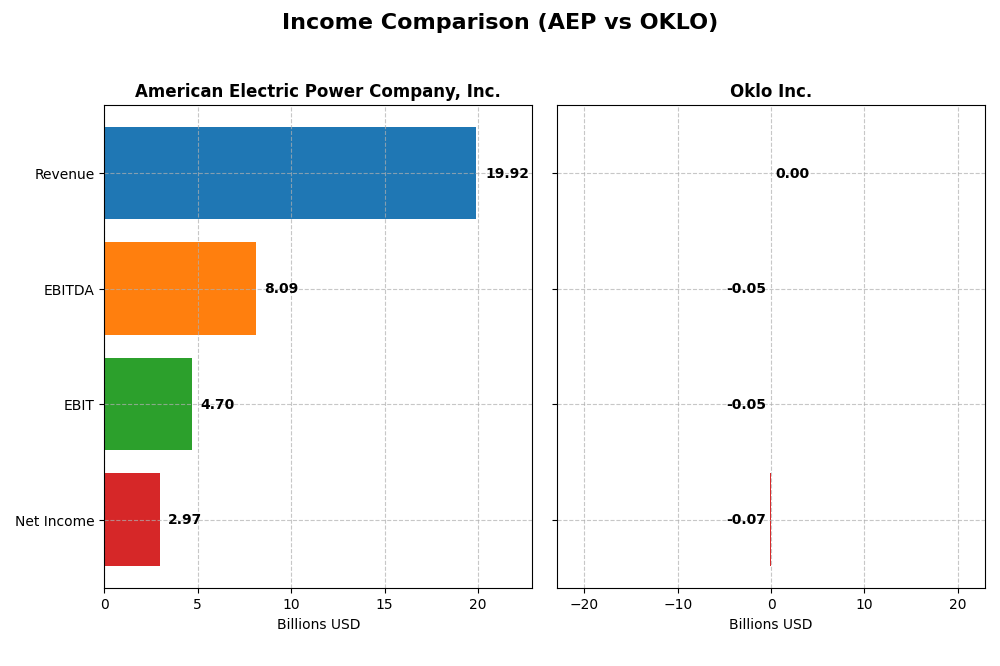
Below is a comparison of the key income statement metrics for American Electric Power Company, Inc. and Oklo Inc. for the fiscal year 2024.
| Metric | American Electric Power Company, Inc. (AEP) | Oklo Inc. (OKLO) |
|---|---|---|
| Market Cap | 62.6B | 16.5B |
| Revenue | 19.9B | 0 |
| EBITDA | 8.1B | -52.5M |
| EBIT | 4.7B | -52.8M |
| Net Income | 3.0B | -73.6M |
| EPS | 5.60 | -0.74 |
| Fiscal Year | 2024 | 2024 |
Income Statement Interpretations
American Electric Power Company, Inc.
American Electric Power Company, Inc. showed steady revenue growth from 2020 to 2024, reaching $19.9B in 2024, with net income rising to $2.97B. Margins remained generally favorable, with a gross margin near 32% and a net margin around 15%. In 2024, growth in gross profit and net income was strong despite a slight slowdown in revenue expansion.
Oklo Inc.
Oklo Inc. reported no revenue from 2021 through 2024, resulting in persistent net losses that worsened to -$73.6M in 2024. Margins were unfavorable with no gross or net profit generated. The company’s expenses increased significantly, and EBIT declined sharply in the latest year, reflecting ongoing operational challenges without commercial revenue.
Which one has the stronger fundamentals?
American Electric Power exhibits stronger fundamentals with consistent revenue and net income growth, positive margins, and a favorable overall income statement evaluation. In contrast, Oklo’s financials show sustained losses, zero revenue, and unfavorable margin trends, indicating weaker income statement fundamentals over the observed period.
Financial Ratios Comparison
The table below presents a side-by-side comparison of key financial ratios for American Electric Power Company, Inc. (AEP) and Oklo Inc. (OKLO) based on their most recent fiscal year data for 2024.
| Ratios | American Electric Power Company, Inc. (AEP) | Oklo Inc. (OKLO) |
|---|---|---|
| ROE | 11.0% | -29.3% |
| ROIC | 4.96% | -19.2% |
| P/E | 16.48 | -28.52 |
| P/B | 1.81 | 8.37 |
| Current Ratio | 0.44 | 43.47 |
| Quick Ratio | 0.31 | 43.47 |
| D/E (Debt-to-Equity) | 1.70 | 0.005 |
| Debt-to-Assets | 44.4% | 0.46% |
| Interest Coverage | 2.56 | 0 |
| Asset Turnover | 0.19 | 0 |
| Fixed Asset Turnover | 0.24 | 0 |
| Payout ratio | 64.2% | 0 |
| Dividend yield | 3.89% | 0 |
Interpretation of the Ratios
American Electric Power Company, Inc.
American Electric Power shows a mixed ratio profile with favorable net margin (14.9%) and dividend yield (3.89%), but unfavorable liquidity ratios (current ratio 0.44, quick ratio 0.31) and high leverage (debt-to-equity 1.7). Return on equity is neutral at 11.01%, while return on invested capital is unfavorable at 4.96%. The company pays dividends supported by a steady yield, although some debt and liquidity concerns remain.
Oklo Inc.
Oklo has predominantly unfavorable profitability ratios, including negative return on equity (-29.35%) and return on invested capital (-19.23%), reflecting its early-stage growth status. Liquidity is extreme with a very high current ratio (43.47), but this is flagged unfavorable due to operational inefficiencies. Oklo does not pay dividends, focusing instead on reinvestment and development in its nuclear power business.
Which one has the best ratios?
American Electric Power presents a slightly unfavorable overall ratio profile but benefits from stable profitability and dividend payments. Oklo’s ratios are mostly unfavorable, reflecting its developmental phase and negative profitability. While AEP faces some financial risks, its mature utility profile contrasts with Oklo’s high-risk, growth-focused metrics.
Strategic Positioning
This section compares the strategic positioning of American Electric Power Company, Inc. (AEP) and Oklo Inc. (OKLO) in terms of market position, key segments, and exposure to technological disruption:
American Electric Power Company, Inc. (AEP)
- Large market cap of 62.6B with established presence in regulated electric utilities facing moderate competitive pressure.
- Diversified revenue streams including generation, transmission, and distribution across multiple energy sources.
- Exposure to traditional and renewable energy technologies with potential gradual impact from nuclear innovation.
Oklo Inc. (OKLO)
- Smaller market cap of 16.5B, focused on innovative nuclear fission power plant design with emerging competitive environment.
- Concentrated on fission power plants and nuclear fuel recycling services in the U.S. market.
- High exposure to technological disruption through advanced nuclear energy development and recycling technologies.
AEP vs OKLO Positioning
AEP adopts a diversified approach with vertically integrated utilities and multiple energy sources, providing stable revenue streams but facing traditional industry pressures. OKLO’s concentrated focus on nuclear innovation offers growth potential but carries higher technological and market risks.
Which has the best competitive advantage?
AEP shows a slightly unfavorable moat with growing profitability despite value destruction, indicating moderate competitive resilience. OKLO displays a very unfavorable moat with declining profitability, suggesting weaker competitive advantage and higher investment risk.
Stock Comparison
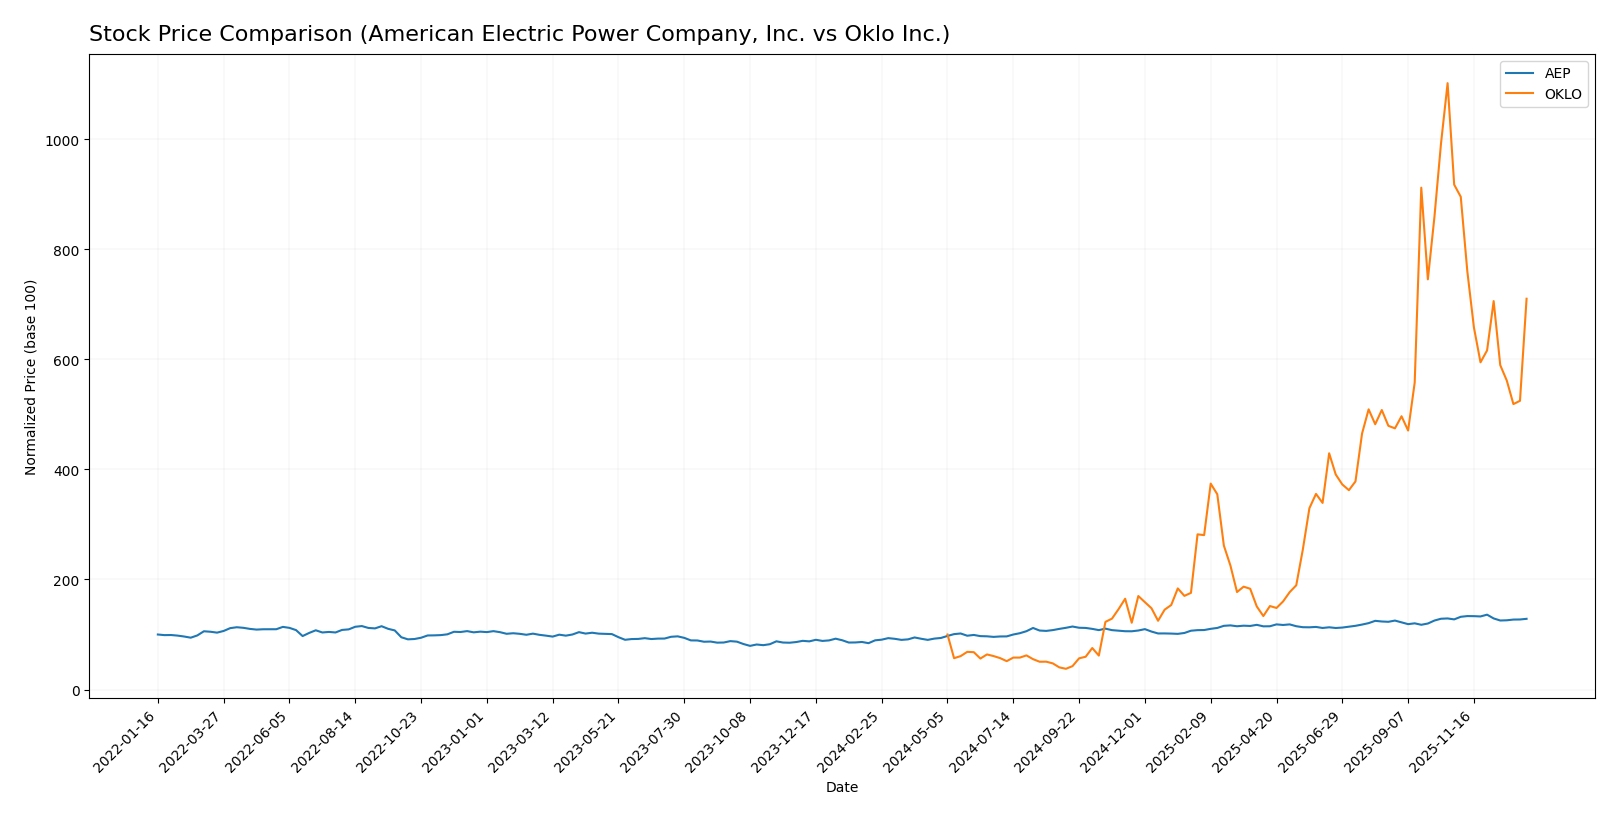
The stock prices of American Electric Power Company, Inc. (AEP) and Oklo Inc. (OKLO) have shown significant divergence over the past year, with AEP exhibiting steady growth and OKLO demonstrating extreme volatility and recent downturns.
Trend Analysis
American Electric Power Company, Inc. (AEP) delivered a bullish trend over the past 12 months with a 43.71% price increase, though the trend shows deceleration. Recent weeks reflect a neutral trend with a slight 0.8% gain and a mild downward slope.
Oklo Inc. (OKLO) experienced a strong bullish trend over the year, marked by a 610.11% price surge and high volatility. However, recent months reveal a bearish trend with a 22.59% decline and accelerated downward momentum.
Comparing both stocks, OKLO provided the highest market performance over the full year despite recent losses, while AEP maintained more stable and consistent growth.
Target Prices
The current analyst consensus indicates promising upside potential for both American Electric Power Company, Inc. and Oklo Inc.
| Company | Target High | Target Low | Consensus |
|---|---|---|---|
| American Electric Power Company, Inc. | 138 | 107 | 126.82 |
| Oklo Inc. | 150 | 95 | 125.67 |
Analysts expect American Electric Power’s stock to appreciate above its current price of 116.91, with a consensus target near 127. Oklo’s consensus target of 125.67 also suggests notable upside from its current 105.31 price.
Analyst Opinions Comparison
This section compares analysts’ ratings and grades for American Electric Power Company, Inc. (AEP) and Oklo Inc. (OKLO):
Rating Comparison
AEP Rating
- Rating: B+ indicating a very favorable overall assessment of financial standing.
- Discounted Cash Flow Score: 4, favorable, suggesting AEP is fairly valued based on cash flows.
- ROE Score: 4, favorable, showing efficient profit generation from equity.
- ROA Score: 4, favorable, reflecting effective use of assets to generate earnings.
- Debt To Equity Score: 2, moderate, suggesting moderate financial risk with some leverage.
- Overall Score: 3, moderate, summarizing a balanced financial performance.
OKLO Rating
- Rating: C+ indicating a very favorable overall standing despite lower scores.
- Discounted Cash Flow Score: 3, moderate, indicating less confidence in valuation accuracy.
- ROE Score: 1, very unfavorable, indicating poor efficiency in generating profits from equity.
- ROA Score: 1, very unfavorable, showing weak asset utilization for earnings.
- Debt To Equity Score: 5, very favorable, indicating low financial risk and strong balance sheet.
- Overall Score: 2, moderate, reflecting below-average financial metrics overall.
Which one is the best rated?
Based strictly on the data, AEP holds a higher rating (B+) with favorable scores in cash flow, ROE, and ROA, while OKLO has a lower rating (C+) with strong debt management but poor profitability metrics. Overall, AEP is better rated.
Scores Comparison
Here is a comparison of the Altman Z-Score and Piotroski Score for the two companies:
AEP Scores
- Altman Z-Score: 1.0, in the distress zone indicating high bankruptcy risk.
- Piotroski Score: 6, considered average financial strength.
OKLO Scores
- Altman Z-Score: 339.4, in the safe zone indicating very low bankruptcy risk.
- Piotroski Score: 2, considered very weak financial strength.
Which company has the best scores?
OKLO has a significantly higher Altman Z-Score, placing it in the safe zone, while AEP is in distress. However, AEP’s Piotroski Score is average, outperforming OKLO’s very weak score.
Grades Comparison
The following is a comparison of the recent grades assigned to American Electric Power Company, Inc. and Oklo Inc.:
American Electric Power Company, Inc. Grades
The table below lists recent grades from notable financial institutions for AEP.
| Grading Company | Action | New Grade | Date |
|---|---|---|---|
| UBS | Maintain | Sell | 2025-12-17 |
| JP Morgan | Maintain | Neutral | 2025-12-12 |
| Jefferies | Upgrade | Buy | 2025-11-17 |
| Citigroup | Maintain | Neutral | 2025-10-31 |
| Wells Fargo | Maintain | Overweight | 2025-10-30 |
| Evercore ISI Group | Maintain | Outperform | 2025-10-30 |
| Morgan Stanley | Maintain | Overweight | 2025-10-30 |
| Mizuho | Maintain | Neutral | 2025-10-30 |
| BMO Capital | Downgrade | Market Perform | 2025-10-30 |
| Scotiabank | Maintain | Sector Perform | 2025-10-30 |
Overall, AEP’s grades exhibit a mixed trend with several neutral and overweight ratings alongside a downgrade and a sell rating, indicating varied analyst sentiment.
Oklo Inc. Grades
The table below presents recent evaluations from respected grading firms for OKLO.
| Grading Company | Action | New Grade | Date |
|---|---|---|---|
| Seaport Global | Upgrade | Buy | 2025-12-08 |
| UBS | Maintain | Neutral | 2025-12-03 |
| B of A Securities | Maintain | Neutral | 2025-11-12 |
| B. Riley Securities | Maintain | Buy | 2025-11-12 |
| Wedbush | Maintain | Outperform | 2025-11-12 |
| B of A Securities | Downgrade | Neutral | 2025-09-30 |
| Seaport Global | Downgrade | Neutral | 2025-09-23 |
| Wedbush | Maintain | Outperform | 2025-09-22 |
| Wedbush | Maintain | Outperform | 2025-08-14 |
| Wedbush | Maintain | Outperform | 2025-08-12 |
OKLO’s ratings show predominantly positive opinions with multiple outperform and buy ratings, though some recent downgrades to neutral reflect cautious adjustments.
Which company has the best grades?
Both AEP and OKLO have a consensus “Buy” rating, but OKLO’s grades skew more positively with several outperform and buy ratings maintained across multiple firms. This suggests a generally stronger analyst confidence in OKLO’s outlook, which may attract investors seeking growth potential, while AEP’s more mixed ratings indicate a cautious stance with some downside risk considerations.
Strengths and Weaknesses
Below is a comparison table highlighting the key strengths and weaknesses of American Electric Power Company, Inc. (AEP) and Oklo Inc. (OKLO) based on the most recent data available.
| Criterion | American Electric Power Company, Inc. (AEP) | Oklo Inc. (OKLO) |
|---|---|---|
| Diversification | Moderate diversification across generation, transmission, and distribution segments with $5.88B in transmission and distribution revenues (2024) | Limited diversification; primarily focused on nuclear technology development |
| Profitability | Net margin at 14.9% (favorable), ROIC 4.96% (unfavorable but growing), slightly unfavorable overall | Negative profitability; net margin 0%, ROIC -19.23%, declining profitability |
| Innovation | Stable utility operations with incremental innovation in transmission and generation | High innovation potential in advanced nuclear technology, but financials show challenges |
| Global presence | Primarily US-centric utility operations with large infrastructure | Emerging company with limited global footprint |
| Market Share | Strong market share in US utility sector with $5.88B transmission revenues (2024) | Very small market share as a startup in nuclear industry |
Key takeaways: AEP demonstrates stable revenue streams and improving profitability despite current value shedding, supported by diversified operations in traditional utilities. Oklo shows high innovation but suffers from significant financial challenges and very limited market presence, implying higher investment risk.
Risk Analysis
The table below summarizes key risks for American Electric Power Company, Inc. (AEP) and Oklo Inc. based on the most recent data from 2024.
| Metric | American Electric Power Company, Inc. (AEP) | Oklo Inc. |
|---|---|---|
| Market Risk | Moderate (Beta 0.615, stable utility sector) | Moderate (Beta 0.773, tech innovation exposure) |
| Debt level | Elevated (D/E 1.7, interest coverage 2.53) | Low (D/E 0.01, strong balance sheet) |
| Regulatory Risk | High (Utility sector heavily regulated) | High (Nuclear energy and recycling regulations) |
| Operational Risk | Moderate (Complex generation mix) | High (Emerging technology, small workforce) |
| Environmental Risk | Moderate (Coal and gas operations impact) | Moderate (Nuclear fuel cycle and waste concerns) |
| Geopolitical Risk | Low (US-focused with stable markets) | Moderate (Nuclear regulatory and public acceptance) |
In synthesis, AEP faces significant regulatory and debt-related risks, with a moderate operational complexity and environmental impact due to fossil fuel use. Oklo’s most impactful risks lie in regulatory and operational fronts given its pioneering nuclear technology and small size, despite very low debt and strong liquidity. Investors should carefully weigh AEP’s financial leverage against stable cash flows, and Oklo’s innovation potential against technological and regulatory uncertainties.
Which Stock to Choose?
American Electric Power Company, Inc. (AEP) shows a favorable income statement with 14.9% net margin and 31.6% EPS growth over one year. Its financial ratios reveal mixed signals: favorable net margin and dividend yield but unfavorable liquidity and asset turnover. The company carries significant debt and has a moderate B+ rating, indicating a slightly unfavorable overall ratio profile but growing profitability despite value destruction.
Oklo Inc. (OKLO) presents an unfavorable income statement with zero net margin and negative growth across key metrics. Its financial ratios are largely unfavorable, marked by negative returns and high price-to-book ratio, though the company benefits from low debt and a strong quick ratio. OKLO holds a C+ rating with very weak financial scores, and its economic moat evaluation signals significant value destruction and declining profitability.
Investors focused on stability and established profitability might find American Electric Power’s profile more indicative of sustainable performance, while those with tolerance for volatility and seeking potential high growth could see Oklo’s situation as a high-risk, speculative opportunity. The contrasting ratings and financial health suggest that the choice depends largely on risk appetite and investment strategy.
Disclaimer: Investment carries a risk of loss of initial capital. The past performance is not a reliable indicator of future results. Be sure to understand risks before making an investment decision.
Go Further
I encourage you to read the complete analyses of American Electric Power Company, Inc. and Oklo Inc. to enhance your investment decisions: