Home > Comparison > Utilities > NEE vs AEP
The strategic rivalry between NextEra Energy, Inc. and American Electric Power Company, Inc. shapes the Utilities sector’s future. NextEra operates as a clean energy pioneer with a strong focus on renewable assets. In contrast, American Electric Power runs a vertically integrated utility blending traditional and renewable power sources. This analysis aims to identify which company presents a superior risk-adjusted profile for investors seeking diversified exposure within regulated electric utilities.
Table of contents
Companies Overview
NextEra Energy and American Electric Power hold commanding positions in the regulated electric utilities sector, shaping North America’s energy landscape.
NextEra Energy, Inc.: Leader in Clean Energy Innovation
NextEra Energy dominates as a regulated electric utility with a massive clean energy portfolio. It generates revenue through electricity sales from wind, solar, nuclear, and natural gas facilities. The company’s 2021 strategic focus emphasized expanding renewable generation and battery storage projects, reinforcing its commitment to long-term contracted clean energy assets.
American Electric Power Company, Inc.: Vertically Integrated Power Provider
American Electric Power stands out as a vertically integrated electric utility holding company. Its revenue streams come from generating, transmitting, and distributing electricity using diverse sources, including coal, natural gas, nuclear, and renewables. In 2021, AEP concentrated on transmission and distribution utilities, along with generation & marketing segments, maintaining a broad energy mix across the U.S.
Strategic Collision: Similarities & Divergences
Both companies operate in regulated electric markets but diverge in their business models. NextEra pursues a growth strategy centered on clean energy innovation and contracted assets, while AEP leans on vertical integration and a diversified fuel mix. They primarily compete on expanding transmission and generation capacity. NextEra’s profile showcases a clean energy growth moat; AEP offers stability through integrated operations and varied energy sources.
Income Statement Comparison
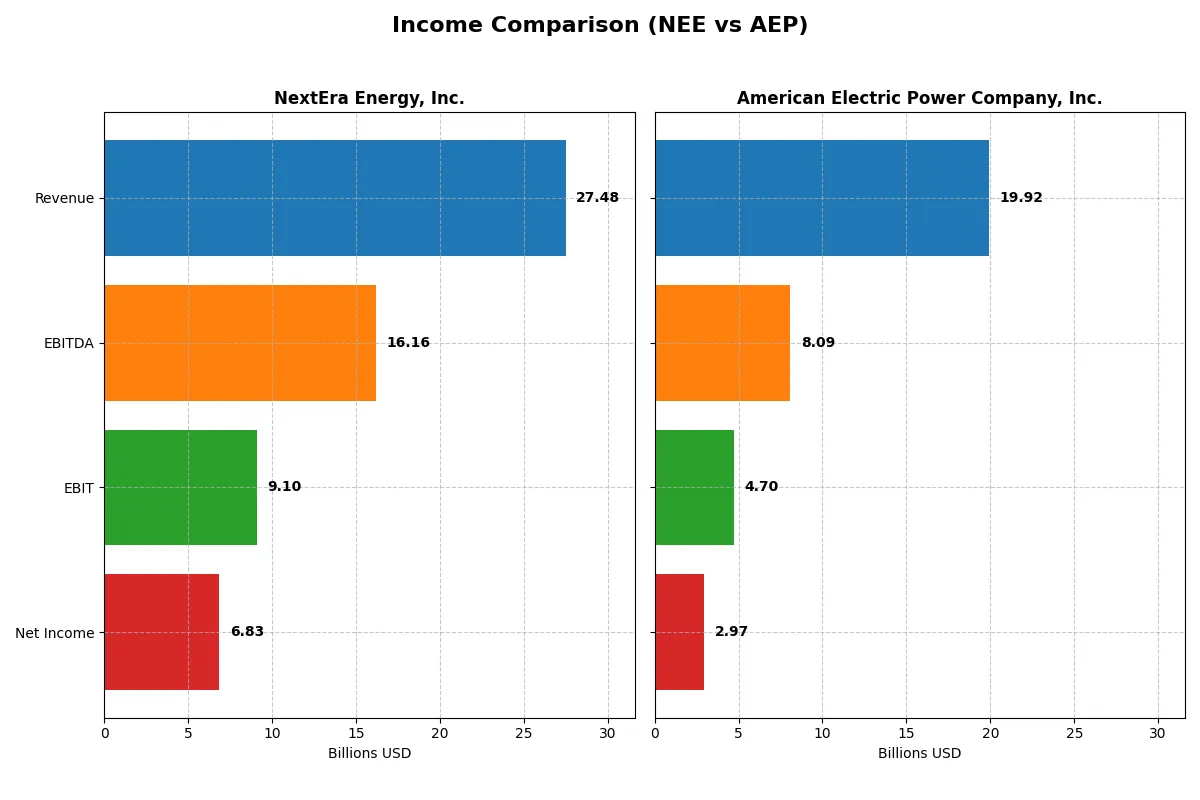
The following data dissects the core profitability and scalability of both corporate engines to reveal who dominates the bottom line:
| Metric | NextEra Energy, Inc. (NEE) | American Electric Power Company, Inc. (AEP) |
|---|---|---|
| Revenue | 27.48B | 19.92B |
| Cost of Revenue | 10.22B | 13.56B |
| Operating Expenses | 8.98B | 1.60B |
| Gross Profit | 17.26B | 6.36B |
| EBITDA | 16.17B | 8.09B |
| EBIT | 9.10B | 4.70B |
| Interest Expense | 4.57B | 1.86B |
| Net Income | 6.83B | 2.97B |
| EPS | 3.31 | 5.60 |
| Fiscal Year | 2025 | 2024 |
Income Statement Analysis: The Bottom-Line Duel
This income statement comparison reveals which company converts revenue into profit most efficiently, highlighting operational strengths and challenges.
NextEra Energy, Inc. Analysis
NextEra Energy’s revenue climbed from 17B in 2021 to 27.5B in 2025, with net income nearly doubling from 3.6B to 6.8B. Its gross margin stays robust at 62.8%, while net margin holds strong near 25%. Despite rising interest expenses, the company maintains solid operating momentum and expanding profitability over five years.
American Electric Power Company, Inc. Analysis
American Electric Power’s revenue grew more modestly from 14.9B in 2020 to 19.9B in 2024, with net income increasing 34% to 3B. Gross margin remains healthy at 31.9%, while net margin hovers around 15%. The latest year shows improved EBIT and net margin growth, supported by stable interest costs and steady operational efficiency.
Margin Strength vs. Growth Scale
NextEra Energy leads in scale and margin strength, delivering superior net margin and faster long-term profit growth. American Electric Power shows steadier, moderate expansion with lower margins. For investors prioritizing operational efficiency and sizable earnings growth, NextEra Energy’s profile appears more compelling.
Financial Ratios Comparison
These vital ratios act as a diagnostic tool to expose the underlying fiscal health, valuation premiums, and capital efficiency of the companies compared below:
| Ratios | NextEra Energy, Inc. (NEE) | American Electric Power Company, Inc. (AEP) |
|---|---|---|
| ROE | 13.9% | 11.0% |
| ROIC | 4.0% | 5.0% |
| P/E | 21.2 | 16.5 |
| P/B | 2.94 | 1.81 |
| Current Ratio | 0.47 | 0.44 |
| Quick Ratio | 0.38 | 0.31 |
| D/E (Debt-to-Equity) | 1.64 | 1.70 |
| Debt-to-Assets | 43.3% | 44.4% |
| Interest Coverage | 3.35 | 2.56 |
| Asset Turnover | 0.13 | 0.19 |
| Fixed Asset Turnover | 0.18 | 0.24 |
| Payout Ratio | 61.0% | 64.2% |
| Dividend Yield | 2.87% | 3.89% |
| Fiscal Year | 2024 | 2024 |
Efficiency & Valuation Duel: The Vital Signs
Financial ratios act as a company’s DNA, exposing hidden risks and operational strengths that shape investment decisions.
NextEra Energy, Inc.
NextEra Energy posts a robust net margin of 28.06%, signaling strong profitability. Its ROE at 13.86% remains neutral, while ROIC lags at 4.04%, below WACC of 6.41%, suggesting capital inefficiency. The P/E of 21.23 indicates a fairly valued stock. The 2.87% dividend yield rewards shareholders amid modest buybacks.
American Electric Power Company, Inc.
American Electric Power shows a solid 14.9% net margin and a neutral 11.01% ROE. Its ROIC of 4.96% also underperforms the 5.56% WACC, reflecting some capital allocation challenges. The stock trades at a P/E of 16.48, less stretched than peers. Its 3.89% dividend yield highlights a shareholder-friendly income focus.
Valuation Discipline vs. Profitability Edge
Both utilities face capital efficiency headwinds, but NextEra’s higher profitability contrasts with American Electric Power’s more conservative valuation. NextEra suits investors prioritizing operational strength; American Electric Power appeals to those seeking income with valuation discipline.
Which one offers the Superior Shareholder Reward?
NextEra Energy (NEE) offers a 2.87% dividend yield with a 61% payout ratio, supported by modest free cash flow coverage at 1.04x. Its buyback activity is limited, signaling a cautious distribution stance focused on sustainable dividends and reinvestment. American Electric Power (AEP) pays a higher 3.89% dividend yield with a 64% payout ratio but boasts exceptional free cash flow coverage at 3.33x, reflecting robust cash generation. AEP’s aggressive share buybacks amplify total shareholder returns, enhancing capital return beyond dividends. I see AEP’s combination of higher yield, stronger free cash flow coverage, and intense buybacks as a more sustainable, superior shareholder reward in 2026.
Comparative Score Analysis: The Strategic Profile
The radar chart reveals the fundamental DNA and trade-offs of NextEra Energy, Inc. and American Electric Power Company, Inc.:
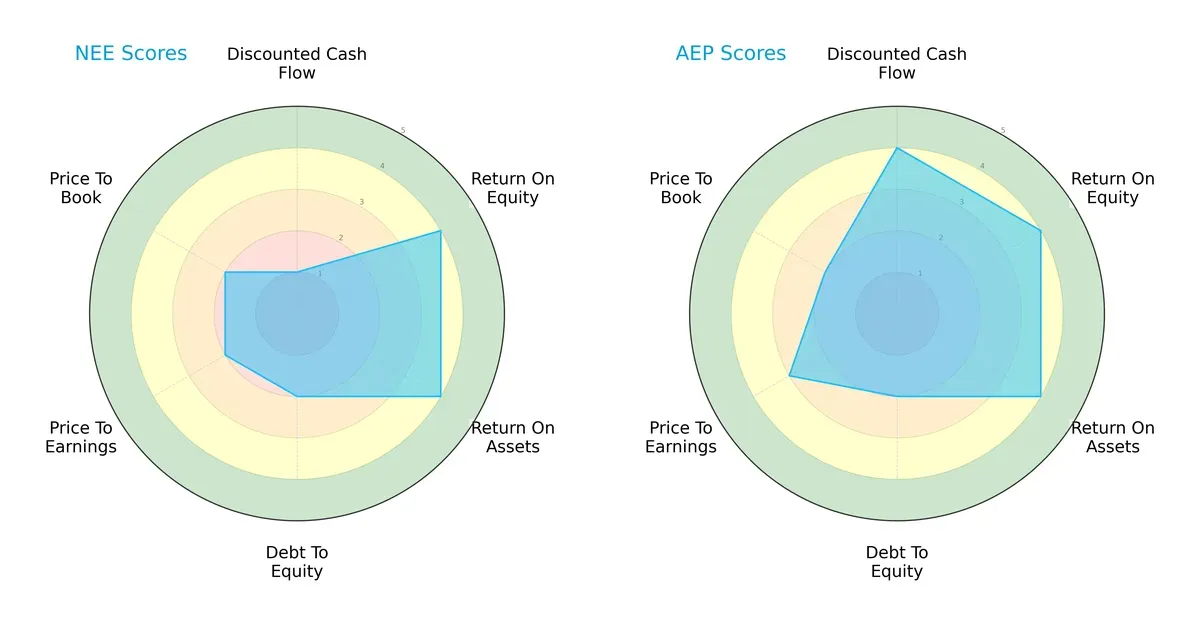
NextEra Energy shows strength in return on equity (ROE) and return on assets (ROA) but scores low on discounted cash flow (DCF), signaling valuation concerns. American Electric Power balances high DCF and strong profitability metrics, reflecting a more diversified advantage. Both share moderate debt-to-equity and valuation scores, yet AEP’s profile appears more balanced, whereas NEE leans heavily on operational efficiency.
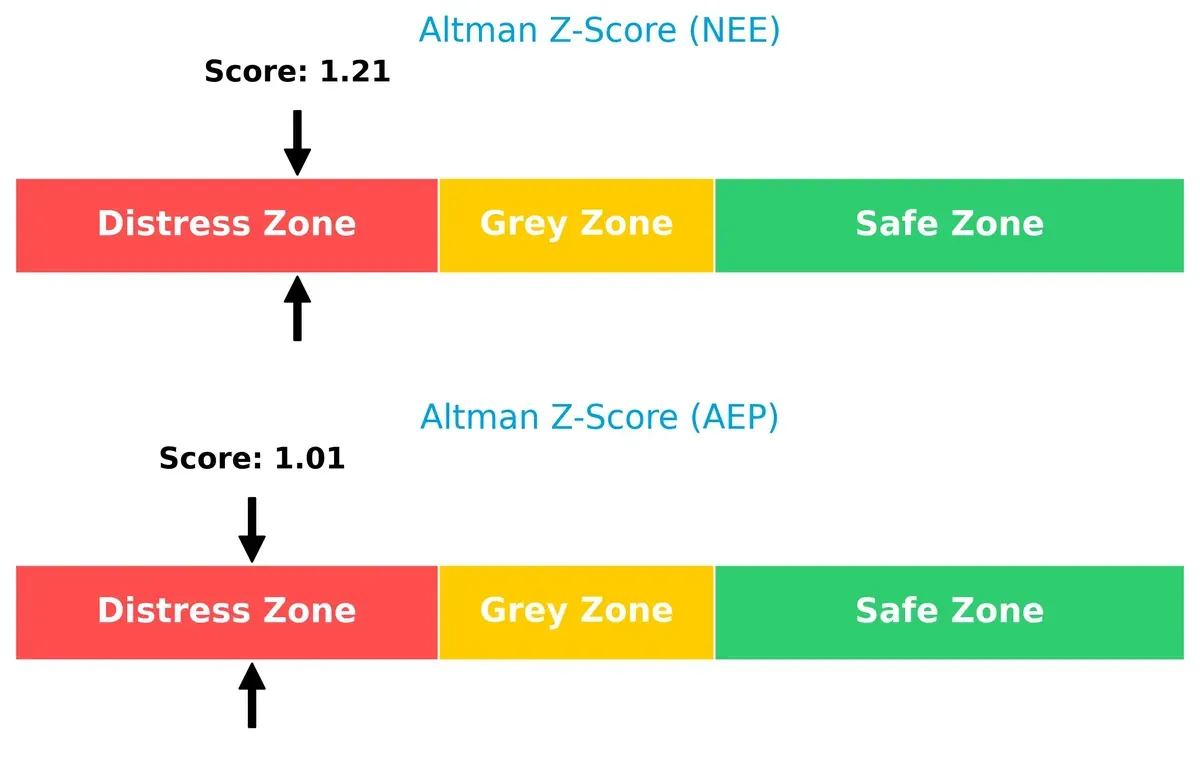
Bankruptcy Risk: Solvency Showdown
Both NextEra Energy and American Electric Power fall in the distress zone of the Altman Z-Score, signaling elevated bankruptcy risk in this cycle:
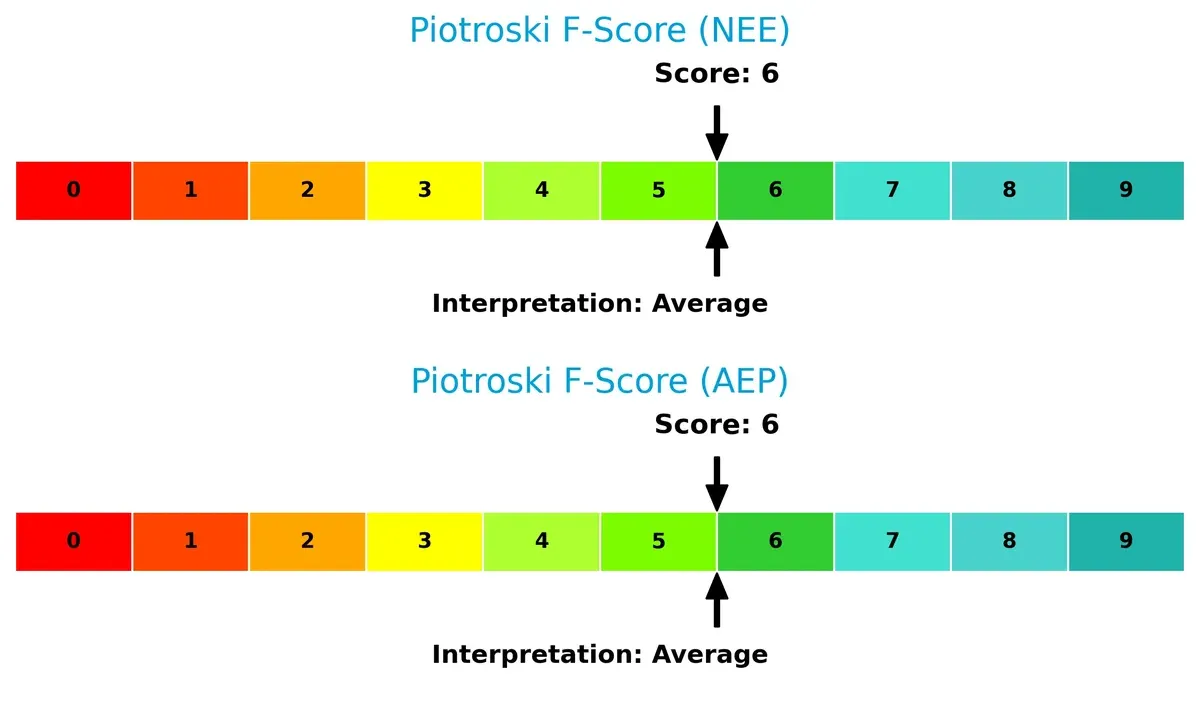
Financial Health: Quality of Operations
NextEra Energy and American Electric Power both score 6 on the Piotroski F-Score, indicating average financial health with no glaring red flags in operational quality or internal metrics:
How are the two companies positioned?
This section dissects the operational DNA of NextEra Energy and American Electric Power by comparing their revenue distribution by segment and internal strengths and weaknesses. The goal is to confront their economic moats and identify which model offers the most resilient competitive advantage today.
Revenue Segmentation: The Strategic Mix
This visual comparison dissects how NextEra Energy, Inc. and American Electric Power Company, Inc. diversify their income streams and where their primary sector bets lie:
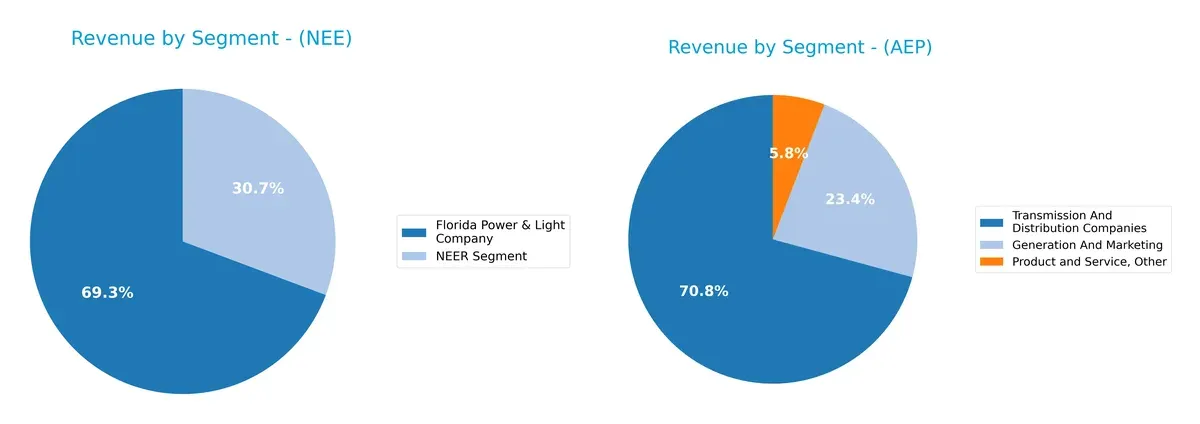
NextEra Energy anchors its revenue heavily on Florida Power & Light Company with $17B, complemented by a significant $7.5B from its NEER segment, showing moderate diversification. In contrast, American Electric Power pivots around its Transmission and Distribution segment at $5.9B, with Generation and Marketing contributing $1.9B, indicating a more balanced but infrastructure-heavy mix. NextEra’s focus suggests ecosystem lock-in, while AEP’s spread reduces concentration risk but leans on utility infrastructure dominance.
Strengths and Weaknesses Comparison
This table compares the Strengths and Weaknesses of NextEra Energy, Inc. and American Electric Power Company, Inc.:
NextEra Energy, Inc. Strengths
- Higher net margin at 28.06%
- Favorable dividend yield 2.87%
- Strong scale in Florida Power & Light segment $17B
American Electric Power Company, Inc. Strengths
- Favorable net margin at 14.9%
- Higher dividend yield 3.89%
- Significant revenues from Transmission & Distribution $5.9B
NextEra Energy, Inc. Weaknesses
- Low current ratio 0.47 and quick ratio 0.38 indicate liquidity concerns
- Unfavorable ROIC 4.04% vs WACC 6.41%
- High debt-to-equity 1.64
- Low asset turnover 0.13
American Electric Power Company, Inc. Weaknesses
- Low liquidity ratios current 0.44, quick 0.31
- Unfavorable ROIC 4.96% vs WACC 5.56%
- High debt-to-equity 1.7
- Low asset turnover 0.19
NextEra shows superior profitability but weaker liquidity and capital efficiency metrics. AEP’s strength lies in stable net margins and higher dividend yield, yet it faces similar liquidity and efficiency challenges. Both must manage capital allocation prudently amid sector pressures.
The Moat Duel: Analyzing Competitive Defensibility
A structural moat is the only reliable shield protecting long-term profits from relentless competition erosion. Let’s dissect the competitive moats of two major utilities:
NextEra Energy, Inc.: Innovation-Driven Cost Advantage
NextEra’s moat stems from a cost advantage via renewable energy scale and long-term contracted assets. Its financials show strong margins but declining ROIC signals value destruction. Innovation in battery storage could deepen its moat if execution improves in 2026.
American Electric Power Company, Inc.: Steady Operational Efficiency
AEP’s moat relies on operational efficiency and growing ROIC despite a smaller margin footprint than NextEra. It outperforms in profitability growth and is expanding transmission infrastructure, which may strengthen its competitive edge in 2026.
Battle of Efficiency vs. Innovation
NextEra commands wider margins but suffers value erosion from declining ROIC. AEP’s narrower moat is deepening with improving ROIC and operational discipline. I see AEP better equipped to defend and grow market share amid shifting energy dynamics.
Which stock offers better returns?
Both NextEra Energy, Inc. and American Electric Power Company, Inc. show significant price appreciation over the past year, with distinct bullish trends and a recent slowdown in momentum.
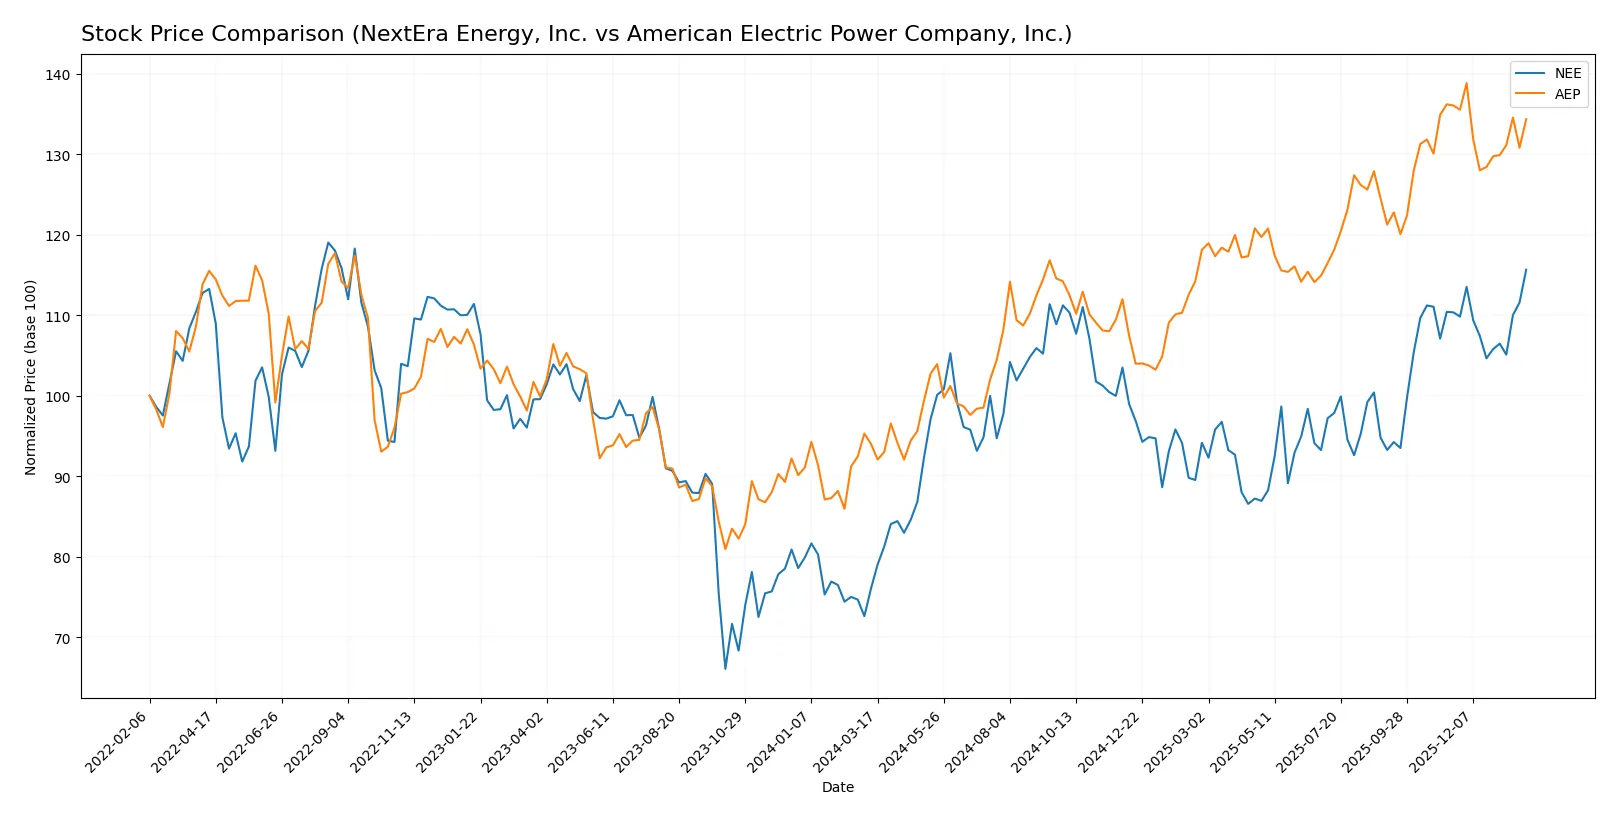
Trend Comparison
NextEra Energy’s stock gained 52.05% over the past 12 months, showing a bullish trend with decelerating momentum. The price ranged between 57.81 and 87.9, with volatility at 6.42%.
American Electric Power’s stock increased 42.86% over the same period, also bullish but with decelerating momentum. Its price fluctuated from 82.1 to 123.77, displaying higher volatility at 10.52%.
NextEra Energy outperformed American Electric Power in market returns, delivering a stronger price gain and lower volatility over the past year.
Target Prices
Analysts present a clear consensus on target prices for NextEra Energy, Inc. and American Electric Power Company, Inc.
| Company | Target Low | Target High | Consensus |
|---|---|---|---|
| NextEra Energy, Inc. | 84 | 104 | 93.09 |
| American Electric Power Co. | 107 | 140 | 128.36 |
The consensus target for NextEra Energy exceeds its current price of 87.9, signaling moderate upside potential. American Electric Power’s consensus target of 128.36 also suggests meaningful appreciation above its 119.78 market price.

Don’t Let Luck Decide Your Entry Point
Optimize your entry points with our advanced ProRealTime indicators. You’ll get efficient buy signals with precise price targets for maximum performance. Start outperforming now!
How do institutions grade them?
The following tables summarize recent institutional grades for NextEra Energy, Inc. and American Electric Power Company, Inc.:
NextEra Energy, Inc. Grades
The table below presents recent grade actions from leading financial institutions for NextEra Energy, Inc.:
| Grading Company | Action | New Grade | Date |
|---|---|---|---|
| Mizuho | Maintain | Neutral | 2026-01-28 |
| Argus Research | Maintain | Buy | 2026-01-28 |
| BMO Capital | Maintain | Outperform | 2026-01-27 |
| Wells Fargo | Maintain | Overweight | 2026-01-20 |
| Barclays | Maintain | Equal Weight | 2026-01-15 |
| Jefferies | Maintain | Hold | 2025-12-31 |
| UBS | Maintain | Buy | 2025-12-17 |
| JP Morgan | Maintain | Overweight | 2025-12-11 |
| UBS | Maintain | Buy | 2025-12-10 |
| BMO Capital | Maintain | Outperform | 2025-12-10 |
American Electric Power Company, Inc. Grades
The table below shows recent grade actions from recognized institutions for American Electric Power Company, Inc.:
| Grading Company | Action | New Grade | Date |
|---|---|---|---|
| Barclays | Maintain | Equal Weight | 2026-01-22 |
| Wells Fargo | Maintain | Overweight | 2026-01-20 |
| B of A Securities | Downgrade | Neutral | 2026-01-12 |
| UBS | Maintain | Sell | 2025-12-17 |
| JP Morgan | Maintain | Neutral | 2025-12-12 |
| Jefferies | Upgrade | Buy | 2025-11-17 |
| Citigroup | Maintain | Neutral | 2025-10-31 |
| Wells Fargo | Maintain | Overweight | 2025-10-30 |
| Evercore ISI Group | Maintain | Outperform | 2025-10-30 |
| Mizuho | Maintain | Neutral | 2025-10-30 |
Which company has the best grades?
NextEra Energy, Inc. consistently receives buy and outperform ratings from multiple top-tier firms. American Electric Power Company, Inc. shows a more mixed profile with notable sell and neutral grades. This divergence may influence investors seeking stronger analyst conviction.
Risks specific to each company
The following categories identify the critical pressure points and systemic threats facing both firms in the 2026 market environment:
1. Market & Competition
NextEra Energy, Inc.
- Leads in renewable capacity with 28,564 MW; faces rising competition in clean energy.
American Electric Power Company, Inc.
- More diversified fuel mix; competes strongly in regulated markets but less focused on renewables.
2. Capital Structure & Debt
NextEra Energy, Inc.
- Debt to equity ratio high at 1.64; interest coverage weak at 1.99, raising financial risk.
American Electric Power Company, Inc.
- Slightly higher debt to equity at 1.7; better interest coverage at 2.53, indicating moderate leverage risk.
3. Stock Volatility
NextEra Energy, Inc.
- Beta of 0.73 suggests moderate volatility, less sensitive to market swings.
American Electric Power Company, Inc.
- Lower beta at 0.62 reflects more stable stock price, less affected by market fluctuations.
4. Regulatory & Legal
NextEra Energy, Inc.
- Faces evolving renewable energy regulations; risks from policy shifts in clean energy incentives.
American Electric Power Company, Inc.
- Exposed to regulatory risks in coal and natural gas operations; stricter emissions rules pose challenges.
5. Supply Chain & Operations
NextEra Energy, Inc.
- Operational complexity from diverse generation assets including wind, solar, nuclear, and gas.
American Electric Power Company, Inc.
- Vertically integrated utilities face risks from fuel supply volatility and operational disruptions.
6. ESG & Climate Transition
NextEra Energy, Inc.
- Strong ESG profile driven by renewable investments; transition risks mitigated by clean energy focus.
American Electric Power Company, Inc.
- Moderate ESG risks due to coal dependency; ongoing transition to renewables remains a challenge.
7. Geopolitical Exposure
NextEra Energy, Inc.
- Primarily US-focused with limited geopolitical risk; benefits from stable domestic policies.
American Electric Power Company, Inc.
- Also US-centric; geopolitical exposure minimal but sensitive to federal infrastructure policies.
Which company shows a better risk-adjusted profile?
NextEra Energy’s most impactful risk is its elevated financial leverage and weak interest coverage, which could strain liquidity in rising rate environments. For American Electric Power, regulatory and environmental risks tied to coal operations present the biggest threat. Despite both being in the distress zone per Altman Z-scores, AEP’s stronger interest coverage and stable stock volatility offer a better risk-adjusted profile. The persistent low interest coverage for NEE, near 2x, underscores my concern over its financial flexibility amid market tightening.
Final Verdict: Which stock to choose?
NextEra Energy’s superpower lies in its robust revenue growth and strong net margins, reflecting operational excellence in a capital-intensive industry. However, its declining return on invested capital signals a point of vigilance for value creation. It suits portfolios targeting aggressive growth with a tolerance for cyclical risks.
American Electric Power stands out with a steadily improving ROIC trend and a strategic moat in regulated utilities, offering recurring revenue stability. Its valuation metrics and dividend yield suggest a safer profile compared to NextEra. It fits well for investors seeking growth at a reasonable price combined with income.
If you prioritize high-growth momentum and can absorb profitability fluctuations, NextEra Energy offers compelling upside due to its expansive scale and innovation. However, if you seek a more stable income stream with improving capital efficiency, American Electric Power outshines as the prudent choice. Both carry risks tied to capital structure and sector dynamics, warranting careful monitoring.
Disclaimer: Investment carries a risk of loss of initial capital. The past performance is not a reliable indicator of future results. Be sure to understand risks before making an investment decision.
Go Further
I encourage you to read the complete analyses of NextEra Energy, Inc. and American Electric Power Company, Inc. to enhance your investment decisions: