In the evolving landscape of regulated electric utilities, American Electric Power Company, Inc. (AEP) and Eversource Energy (ES) stand out as prominent players. Both companies focus on electricity generation, transmission, and distribution, serving extensive U.S. markets with a mix of traditional and renewable energy sources. This comparison explores their strategic positioning and innovation approaches to help you decide which utility stock might best complement your investment portfolio. Let’s uncover which company offers the most compelling opportunity for investors today.
Table of contents
Companies Overview
I will begin the comparison between American Electric Power Company, Inc. (AEP) and Eversource Energy (ES) by providing an overview of these two companies and their main differences.
American Electric Power Company, Inc. Overview
American Electric Power Company, Inc. is a leading electric public utility holding company in the US, primarily engaged in generating, transmitting, and distributing electricity. Operating through multiple segments, AEP uses a diverse mix of energy sources including coal, natural gas, nuclear, hydro, solar, and wind. Founded in 1906 and headquartered in Columbus, Ohio, it serves retail and wholesale customers across the country.
Eversource Energy Overview
Eversource Energy is a public utility holding company focused on energy delivery in the northeastern US. It operates electric distribution and transmission, natural gas distribution, and water distribution services. Serving residential, commercial, and municipal customers in Connecticut, Massachusetts, and New Hampshire, Eversource also manages solar power facilities. It is headquartered in Springfield, Massachusetts, and was formerly known as Northeast Utilities before 2015.
Key similarities and differences
Both AEP and Eversource operate as regulated electric utilities in the US, with diversified service offerings across electricity transmission and distribution. However, AEP has a broader generation portfolio, including nuclear and coal, while Eversource integrates natural gas and water distribution services in its business model. AEP’s market cap is significantly larger at $62.6B compared to Eversource’s $25.0B, reflecting their difference in scale and geographic focus.
Income Statement Comparison
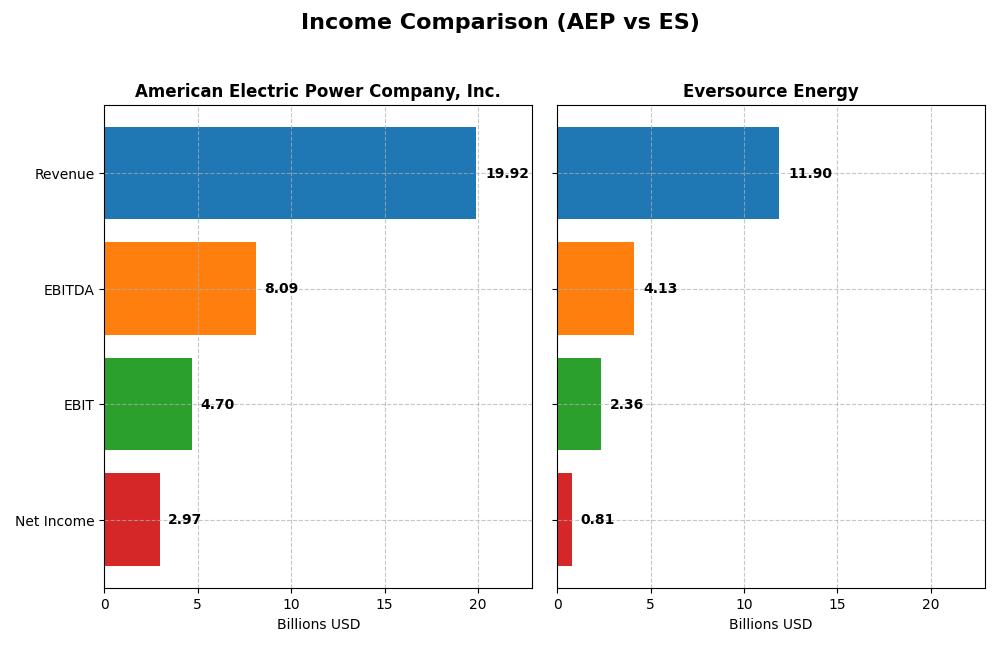
The table below presents a side-by-side comparison of key income statement metrics for American Electric Power Company, Inc. and Eversource Energy for fiscal year 2024.
| Metric | American Electric Power Company, Inc. | Eversource Energy |
|---|---|---|
| Market Cap | 62.6B | 25.0B |
| Revenue | 19.9B | 11.9B |
| EBITDA | 8.1B | 4.1B |
| EBIT | 4.7B | 2.4B |
| Net Income | 3.0B | 812M |
| EPS | 5.60 | 2.27 |
| Fiscal Year | 2024 | 2024 |
Income Statement Interpretations
American Electric Power Company, Inc.
American Electric Power’s revenue increased steadily from $14.9B in 2020 to $19.9B in 2024, with net income rising from $2.2B to $3.0B. Gross margin remained favorable around 32%, while net margin improved slightly to 14.9%. The 2024 fiscal year showed slower revenue growth at 2.76%, but significant improvements in net margin and earnings per share, signaling operational efficiencies.
Eversource Energy
Eversource Energy’s revenue grew from $8.9B in 2020 to $11.9B in 2024, yet net income declined overall, from $1.2B to $811M. Gross margin remained favorable near 31%, but net margin was lower at 6.82%. The latest year saw a slight revenue decline (-0.08%) and a sharp drop in gross profit (-23.6%), though net margin and EPS improved markedly due to strong EBIT growth.
Which one has the stronger fundamentals?
American Electric Power displays stronger fundamentals with consistent revenue and net income growth, stable and improving margins, and favorable overall income statement trends. Eversource shows mixed signals, with solid revenue growth but declining net income and margins over the period, despite recent operational gains. The overall financial health and margin stability favor American Electric Power.
Financial Ratios Comparison
The table below compares the most recent key financial ratios for American Electric Power Company, Inc. (AEP) and Eversource Energy (ES) for the fiscal year 2024.
| Ratios | American Electric Power Company, Inc. (AEP) | Eversource Energy (ES) |
|---|---|---|
| ROE | 11.0% | 5.4% |
| ROIC | 4.96% | 3.18% |
| P/E | 16.48 | 25.29 |
| P/B | 1.81 | 1.37 |
| Current Ratio | 0.44 | 0.76 |
| Quick Ratio | 0.31 | 0.67 |
| D/E (Debt to Equity) | 1.70 | 1.94 |
| Debt-to-Assets | 44.4% | 48.9% |
| Interest Coverage | 2.56 | 2.43 |
| Asset Turnover | 0.19 | 0.20 |
| Fixed Asset Turnover | 0.24 | 0.29 |
| Payout Ratio | 64.2% | 124.3% |
| Dividend Yield | 3.89% | 4.91% |
Interpretation of the Ratios
American Electric Power Company, Inc.
American Electric Power shows a mixed ratio profile with favorable net margin (14.9%) and dividend yield (3.89%), but weak liquidity indicated by a low current ratio (0.44) and quick ratio (0.31). Leverage ratios such as debt-to-equity (1.7) are unfavorable. Its return on equity (11.01%) and valuation multiples are neutral. The firm maintains a stable dividend supported by cash flow, though coverage risks exist given its financial structure.
Eversource Energy
Eversource Energy presents several unfavorable ratios, including a low return on equity (5.4%) and a high price-to-earnings ratio (25.29), indicating valuation concerns. Its liquidity ratios are better than AEP but remain below one, suggesting cautious short-term financial health. The dividend yield is attractive (4.91%), yet the company faces elevated debt levels (debt to equity 1.94) and weaker profitability measures, impacting overall financial stability.
Which one has the best ratios?
American Electric Power’s ratios are slightly unfavorable overall but feature stronger profitability and a moderate dividend yield. Eversource Energy faces more pronounced weaknesses, especially in profitability and valuation, with a higher proportion of unfavorable ratios. Based on the ratio evaluations, American Electric Power demonstrates a relatively stronger financial position compared to Eversource Energy.
Strategic Positioning
This section compares the strategic positioning of American Electric Power Company, Inc. (AEP) and Eversource Energy (ES) in terms of market position, key segments, and exposure to technological disruption:
American Electric Power Company, Inc. (AEP)
- Large market cap of 62.6B with lower beta indicating lower volatility and NASDAQ listing. Faces regulated electric industry pressure.
- Diversified revenue streams: Vertically Integrated Utilities, Transmission & Distribution, Generation & Marketing totaling over 18B USD in 2024.
- Moderate exposure to disruption through a mix of coal, natural gas, nuclear, hydro, solar, and wind generation technologies.
Eversource Energy (ES)
- Smaller market cap of 25.0B, slightly higher beta, NYSE listed, operates in regulated electric sector with competitive pressures.
- Focus on Electric Distribution, Transmission, Natural Gas, and Water Distribution with combined revenues near 13B USD in 2024.
- Exposure includes solar power facilities and natural gas distribution, plus regulated water utilities servicing multiple states.
American Electric Power Company, Inc. vs Eversource Energy Positioning
AEP pursues a more diversified strategy across multiple energy generation sources and utility services, providing broad business drivers. ES concentrates more on electric and gas distribution with regulated water services, reflecting a geographically focused approach. AEP’s larger scale contrasts with ES’s regional specialization.
Which has the best competitive advantage?
Based on MOAT evaluation, AEP shows a slightly unfavorable position with growing ROIC but currently shedding value, whereas ES has a very unfavorable position with declining ROIC and value destruction. AEP demonstrates a relatively stronger competitive advantage in profitability trends.
Stock Comparison
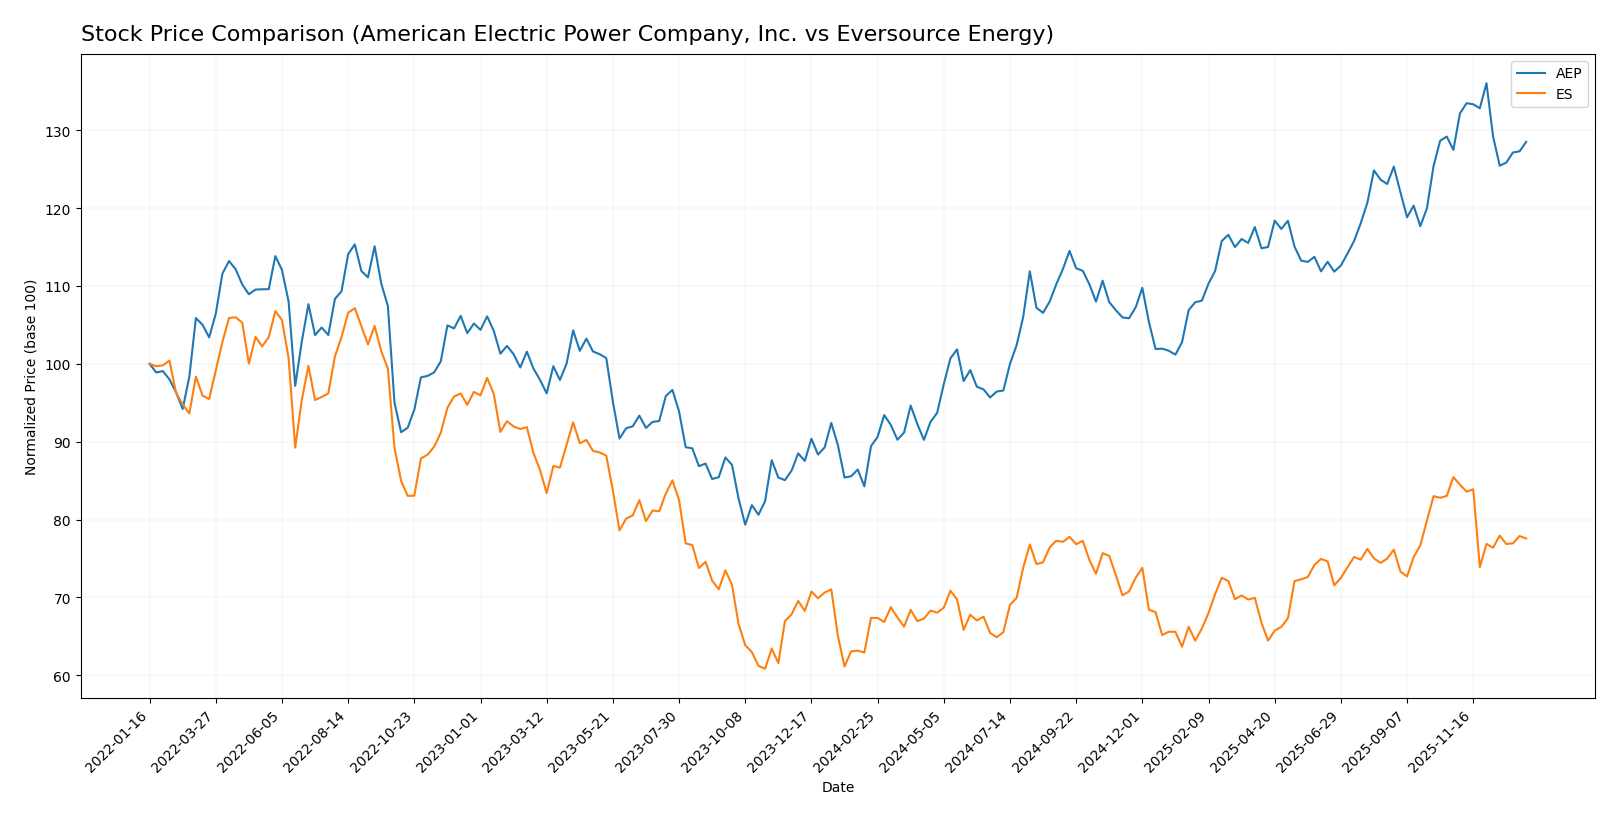
The stock price movements of American Electric Power Company, Inc. (AEP) and Eversource Energy (ES) over the past 12 months reveal distinct bullish trends with AEP showing stronger gains but recent signs of deceleration in both stocks.
Trend Analysis
American Electric Power Company, Inc. (AEP) exhibited a 43.71% price increase over the past year, indicating a clear bullish trend with decelerating momentum and a high volatility level of 10.6%. The stock peaked at 123.77 and bottomed at 81.35 during this period.
Eversource Energy (ES) recorded a 15.15% price rise over the same timeframe, also reflecting a bullish trend with deceleration and moderate volatility at 4.5%. Its highest price was 74.67, while the lowest was 55.63.
Comparing both, AEP delivered the highest market performance with a significantly larger price appreciation than ES over the past year.
Target Prices
Analysts present a clear consensus on target prices for American Electric Power Company, Inc. and Eversource Energy.
| Company | Target High | Target Low | Consensus |
|---|---|---|---|
| American Electric Power Company, Inc. | 138 | 107 | 126.82 |
| Eversource Energy | 81 | 60 | 68 |
The consensus target price for AEP at 126.82 suggests upside potential compared to the current price of 116.91, while ES’s consensus at 68 closely matches its current price of 67.79, indicating a stable outlook.
Analyst Opinions Comparison
This section compares analysts’ ratings and grades for American Electric Power Company, Inc. (AEP) and Eversource Energy (ES):
Rating Comparison
AEP Rating
- Rating: B+ indicating a very favorable overall evaluation from analysts.
- Discounted Cash Flow Score: 4, showing a favorable valuation based on future cash flows.
- ROE Score: 4, representing efficient profit generation from shareholders’ equity.
- ROA Score: 4, reflecting strong utilization of assets to generate earnings.
- Debt To Equity Score: 2, a moderate risk level from debt relative to equity.
- Overall Score: 3, considered moderate in overall financial health and performance.
ES Rating
- Rating: C+ also marked as very favorable, but lower than AEP’s rating.
- Discounted Cash Flow Score: 1, which is very unfavorable, signaling concerns about valuation.
- ROE Score: 3, moderate efficiency in generating profits from equity.
- ROA Score: 3, indicating moderate effectiveness in using assets.
- Debt To Equity Score: 1, very unfavorable, suggesting higher financial risk from leverage.
- Overall Score: 2, moderate but below AEP’s overall rating.
Which one is the best rated?
Based strictly on the provided data, AEP holds a superior position with higher scores in discounted cash flow, ROE, ROA, and overall financial health. ES scores lower particularly in valuation metrics and debt risk, making AEP the better rated company according to analyst evaluations.
Scores Comparison
The scores comparison between American Electric Power Company, Inc. (AEP) and Eversource Energy (ES) is as follows:
AEP Scores
- Altman Z-Score: 0.998, indicating financial distress and high bankruptcy risk.
- Piotroski Score: 6, reflecting average financial strength.
ES Scores
- Altman Z-Score: 0.747, indicating financial distress and high bankruptcy risk.
- Piotroski Score: 6, reflecting average financial strength.
Which company has the best scores?
Both AEP and ES are in the distress zone according to their Altman Z-Scores, indicating high bankruptcy risk. Their Piotroski Scores are identical at 6, showing average financial strength. Neither company clearly outperforms the other based on these scores.
Grades Comparison
Here is the comparison of recent grades and ratings for American Electric Power Company, Inc. and Eversource Energy:
American Electric Power Company, Inc. Grades
The table below lists recent grades from major financial institutions for AEP:
| Grading Company | Action | New Grade | Date |
|---|---|---|---|
| UBS | Maintain | Sell | 2025-12-17 |
| JP Morgan | Maintain | Neutral | 2025-12-12 |
| Jefferies | Upgrade | Buy | 2025-11-17 |
| Citigroup | Maintain | Neutral | 2025-10-31 |
| Wells Fargo | Maintain | Overweight | 2025-10-30 |
| Evercore ISI Group | Maintain | Outperform | 2025-10-30 |
| Morgan Stanley | Maintain | Overweight | 2025-10-30 |
| Mizuho | Maintain | Neutral | 2025-10-30 |
| BMO Capital | Downgrade | Market Perform | 2025-10-30 |
| Scotiabank | Maintain | Sector Perform | 2025-10-30 |
The grades for AEP show a mixed but generally positive trend with several institutions maintaining overweight or outperform ratings and a consensus rating of Buy.
Eversource Energy Grades
The table below summarizes recent grades from recognized grading companies for ES:
| Grading Company | Action | New Grade | Date |
|---|---|---|---|
| UBS | Maintain | Neutral | 2025-12-17 |
| JP Morgan | Maintain | Underweight | 2025-12-12 |
| Janney Montgomery Scott | Upgrade | Buy | 2025-11-24 |
| Scotiabank | Maintain | Sector Underperform | 2025-11-20 |
| Mizuho | Downgrade | Neutral | 2025-11-20 |
| Wells Fargo | Downgrade | Equal Weight | 2025-11-20 |
| UBS | Downgrade | Neutral | 2025-11-06 |
| BMO Capital | Maintain | Market Perform | 2025-11-06 |
| Scotiabank | Maintain | Sector Underperform | 2025-11-06 |
| Mizuho | Maintain | Outperform | 2025-10-27 |
The grades for Eversource Energy reveal a more cautious stance with a majority of Hold or Neutral ratings and a consensus rating of Hold.
Which company has the best grades?
American Electric Power Company, Inc. has received generally stronger and more positive grades compared to Eversource Energy, with a consensus Buy rating versus Hold for ES. This suggests potentially better market sentiment and analyst confidence in AEP, which may influence investor decisions regarding risk and return expectations.
Strengths and Weaknesses
Below is a comparative overview of key strengths and weaknesses for American Electric Power Company, Inc. (AEP) and Eversource Energy (ES) based on their latest financial and operational data.
| Criterion | American Electric Power Company, Inc. (AEP) | Eversource Energy (ES) |
|---|---|---|
| Diversification | Moderate, with strong focus on transmission and distribution, plus generation and marketing segments | Diversified across electric distribution, transmission, natural gas, and water segments |
| Profitability | Net margin 14.9% (favorable); ROIC 4.96% (unfavorable); growing ROIC trend but still slightly unfavorable overall | Net margin 6.82% (neutral); ROIC 3.18% (unfavorable); declining ROIC trend with very unfavorable overall moat |
| Innovation | Limited data on innovation; emphasis on utility infrastructure with moderate asset turnover (unfavorable) | Limited innovation indicators; focus on traditional utility services with slightly better fixed asset turnover than AEP |
| Global presence | Primarily US-based with extensive transmission and distribution footprint | US-focused with strong regional presence in electric, gas, and water utilities |
| Market Share | Strong in transmission and distribution sectors with revenues exceeding $5.8B in 2024 | Leading regional utility with electric distribution revenues over $9B and natural gas over $2B in 2024 |
Key takeaways: AEP shows a stronger profitability margin and a growing ROIC trend, suggesting improving operational efficiency despite current value destruction. Eversource faces declining profitability and a very unfavorable moat, highlighting caution for investors despite its diversified utility services. Both companies have limited innovation but maintain solid regional market shares.
Risk Analysis
Below is a comparative table highlighting key risks for American Electric Power Company, Inc. (AEP) and Eversource Energy (ES) based on 2024 data and recent financial assessments:
| Metric | American Electric Power (AEP) | Eversource Energy (ES) |
|---|---|---|
| Market Risk | Moderate beta at 0.615, stable range 92.76-124.8 | Higher beta at 0.772, wider range 52.28-75.25 |
| Debt Level | Debt-to-equity 1.7 (unfavorable), debt to assets 44.4% (neutral) | Debt-to-equity 1.94 (unfavorable), debt to assets 48.85% (neutral) |
| Regulatory Risk | High, due to reliance on coal and lignite amid energy transition policies | Moderate, with diversified energy mix including natural gas, solar, and water utilities |
| Operational Risk | Unfavorable asset turnover and liquidity ratios point to efficiency challenges | Similar unfavorable asset turnover, slightly better liquidity but still weak |
| Environmental Risk | High, given significant coal usage and carbon footprint concerns | Moderate, with investments in renewable energy and water services mitigating impact |
| Geopolitical Risk | Moderate, mainly US-focused but sensitive to regulatory shifts | Moderate, regional focus in Northeast US with stable regulatory environment |
The most impactful risks are AEP’s high operational inefficiencies and environmental exposure from fossil fuels, which may face increasing regulatory pressure. Both companies suffer from high debt levels that could constrain financial flexibility. ES’s slightly higher market volatility and weaker discounted cash flow score indicate valuation risks. Investors should weigh these risks carefully against dividend yields and sector stability.
Which Stock to Choose?
American Electric Power Company, Inc. (AEP) shows a favorable income statement with strong gross and EBIT margins, positive net margin growth, and improving profitability despite slightly unfavorable financial ratios and a high debt level. Its rating is very favorable with a B+ grade.
Eversource Energy (ES) presents a favorable income statement but with mixed growth trends and declining profitability overall. Its financial ratios are mostly unfavorable, especially regarding debt and valuation multiples. The company holds a lower rating of C+ with a very unfavorable discount cash flow score.
For investors, AEP might appear more suitable for those prioritizing quality and improving profitability, while ES could be considered by those with tolerance for risk given its weaker rating and declining MOAT. The choice depends on the investor’s profile and their focus on stability versus risk.
Disclaimer: Investment carries a risk of loss of initial capital. The past performance is not a reliable indicator of future results. Be sure to understand risks before making an investment decision.
Go Further
I encourage you to read the complete analyses of American Electric Power Company, Inc. and Eversource Energy to enhance your investment decisions: