American Electric Power Company, Inc. (AEP) and Evergy, Inc. (EVRG) are two key players in the regulated electric utility sector, both focused on electricity generation, transmission, and distribution. While AEP boasts a larger market presence and diversified energy portfolio, Evergy serves a more concentrated regional market with a strong commitment to renewable integration. This article will explore their strengths and risks to help you decide which company offers the most compelling investment opportunity in 2026.
Table of contents
Companies Overview
I will begin the comparison between American Electric Power Company, Inc. and Evergy, Inc. by providing an overview of these two companies and their main differences.
American Electric Power Company, Inc. Overview
American Electric Power Company, Inc. is a longstanding electric public utility holding company headquartered in Columbus, Ohio. Founded in 1906, it operates through multiple segments including generation, transmission, and distribution of electricity across the U.S. The company utilizes a diverse mix of energy sources such as coal, natural gas, nuclear, hydro, solar, and wind, catering to retail and wholesale customers in the regulated electric industry.
Evergy, Inc. Overview
Evergy, Inc., based in Kansas City, Missouri, was established in 2017 and serves customers primarily in Kansas and Missouri. The company focuses on the generation, transmission, distribution, and sale of electricity using coal, hydroelectric, natural gas, uranium, and renewable sources like solar and wind. Evergy operates an extensive network of transmission and distribution lines and serves over 1.6M customers, including residential, commercial, and municipal clients.
Key similarities and differences
Both companies operate within the regulated electric utilities sector, focusing on electricity generation, transmission, and distribution using a mix of conventional and renewable energy sources. AEP has a longer history and a significantly larger market capitalization of approximately 62.6B USD compared to Evergy’s 16.8B USD. Evergy is more regionally concentrated in Kansas and Missouri, whereas AEP serves a broader national market across the United States. Employee count and infrastructure scale also differ notably between the two.
Income Statement Comparison
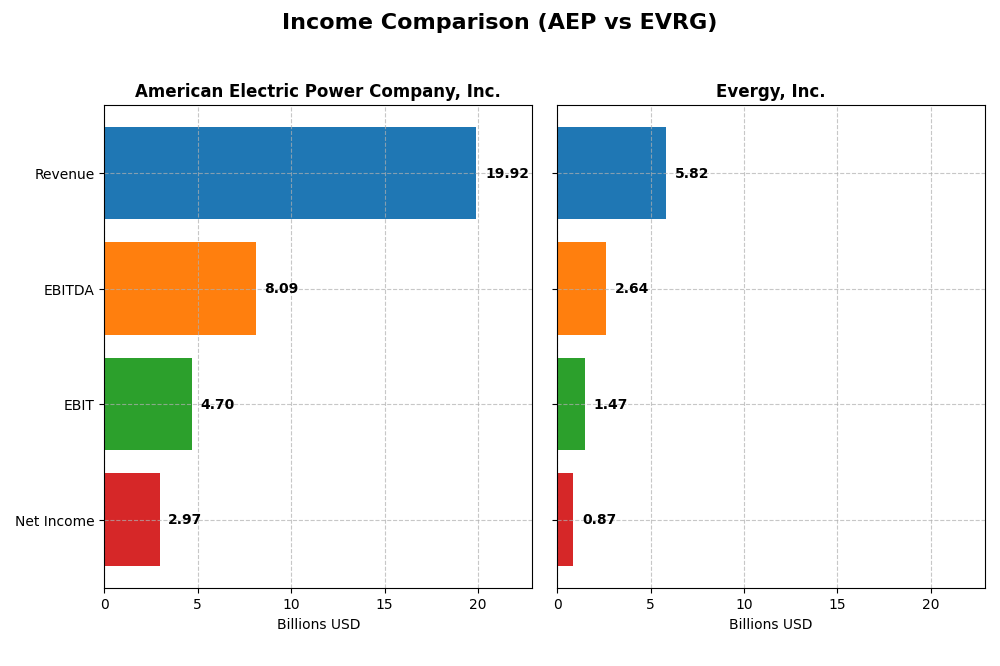
Below is a comparison of key income statement metrics for American Electric Power Company, Inc. (AEP) and Evergy, Inc. (EVRG) for the fiscal year 2024.
| Metric | American Electric Power Company, Inc. (AEP) | Evergy, Inc. (EVRG) |
|---|---|---|
| Market Cap | 62.6B | 16.8B |
| Revenue | 19.9B | 5.8B |
| EBITDA | 8.1B | 2.6B |
| EBIT | 4.7B | 1.5B |
| Net Income | 3.0B | 874M |
| EPS | 5.60 | 3.79 |
| Fiscal Year | 2024 | 2024 |
Income Statement Interpretations
American Electric Power Company, Inc.
From 2020 to 2024, American Electric Power Company, Inc. showed a steady revenue increase from $14.9B to $19.9B, with net income rising from $2.2B to $3.0B. Margins remained generally stable, with a favorable gross margin of 31.9% and net margin near 15%. In 2024, revenue growth slowed to 2.8%, but net margin and EPS improved significantly, reflecting stronger profitability.
Evergy, Inc.
Evergy, Inc. experienced revenue growth from $4.9B in 2020 to $5.8B in 2024, with net income increasing from $618M to $874M. Margins improved over the period, with a gross margin of 32.6% and net margin of 15% in 2024. The latest year showed moderate revenue growth of 6.2%, alongside favorable expansions in net margin and EPS, indicating enhanced operational efficiency.
Which one has the stronger fundamentals?
Both companies exhibit favorable fundamentals with growing revenues and improving profitability metrics. Evergy shows a higher overall net income growth of 41.3% versus American Electric Power’s 34.9%, and stronger margin improvements. However, American Electric Power’s larger scale and consistent margin stability provide a robust income profile. Each firm demonstrates solid but differing strengths in income statement fundamentals.
Financial Ratios Comparison
The table below presents a side-by-side comparison of key financial ratios for American Electric Power Company, Inc. (AEP) and Evergy, Inc. (EVRG) based on their latest fiscal year 2024 data.
| Ratios | American Electric Power Company, Inc. (AEP) | Evergy, Inc. (EVRG) |
|---|---|---|
| ROE | 11.0% | 8.8% |
| ROIC | 5.0% | 4.5% |
| P/E | 16.5 | 16.2 |
| P/B | 1.81 | 1.42 |
| Current Ratio | 0.44 | 0.50 |
| Quick Ratio | 0.31 | 0.27 |
| D/E (Debt-to-Equity) | 1.70 | 1.41 |
| Debt-to-Assets | 44.4% | 43.6% |
| Interest Coverage | 2.56 | 2.57 |
| Asset Turnover | 0.19 | 0.18 |
| Fixed Asset Turnover | 0.24 | 0.23 |
| Payout Ratio | 64.2% | 68.3% |
| Dividend Yield | 3.89% | 4.21% |
Interpretation of the Ratios
American Electric Power Company, Inc.
American Electric Power shows a mix of strengths and weaknesses in its 2024 ratios. Net margin and dividend yield are favorable at 14.9% and 3.89%, respectively, but return on invested capital (4.96%) and liquidity ratios like current ratio (0.44) are unfavorable. The company maintains a stable dividend payout, supported moderately by cash flow, though leverage and asset turnover raise some concerns.
Evergy, Inc.
Evergy presents slightly more favorable ratios in terms of price-to-book (1.42) and dividend yield (4.21%), but suffers from a weaker return on equity (8.77%) and liquidity ratios below 1.0. Its net margin is also favorable at 15.0%. The firm pays dividends backed by steady cash flow, yet elevated debt and low asset turnover suggest cautious attention to financial efficiency and solvency.
Which one has the best ratios?
Both companies exhibit slightly unfavorable overall ratio profiles, with American Electric Power having a slightly higher return on equity but weaker price-to-book and liquidity ratios. Evergy offers a better dividend yield and price-to-book ratio but lower profitability metrics. Neither stands out decisively, as both face challenges in liquidity, leverage, and asset utilization.
Strategic Positioning
This section compares the strategic positioning of American Electric Power Company, Inc. (AEP) and Evergy, Inc. (EVRG) in terms of market position, key segments, and exposure to technological disruption:
American Electric Power Company, Inc. (AEP)
- Large market cap of 62.6B USD with moderate beta, facing regulated electric industry pressures.
- Diversified revenue streams across generation, transmission, and distribution segments totaling over 17B USD.
- Uses a broad mix of energy sources including coal, natural gas, nuclear, hydro, solar, and wind.
Evergy, Inc. (EVRG)
- Smaller market cap at 16.8B USD, also in regulated electric sector with similar beta.
- Concentrated electric utility segment serving Kansas and Missouri with about 2.7B USD revenue.
- Generates electricity from coal, hydroelectric, landfill gas, uranium, natural gas, oil, solar, and wind.
American Electric Power Company, Inc. vs Evergy, Inc. Positioning
AEP pursues a diversified business model with multiple segments and energy sources, offering broad exposure but complexity. EVRG focuses on a geographically concentrated utility segment, providing simpler but narrower market exposure and operational scope.
Which has the best competitive advantage?
Both companies show slightly unfavorable MOAT evaluations, shedding value despite growing ROIC trends. Neither currently demonstrates a strong sustainable competitive advantage based on ROIC versus WACC analysis.
Stock Comparison
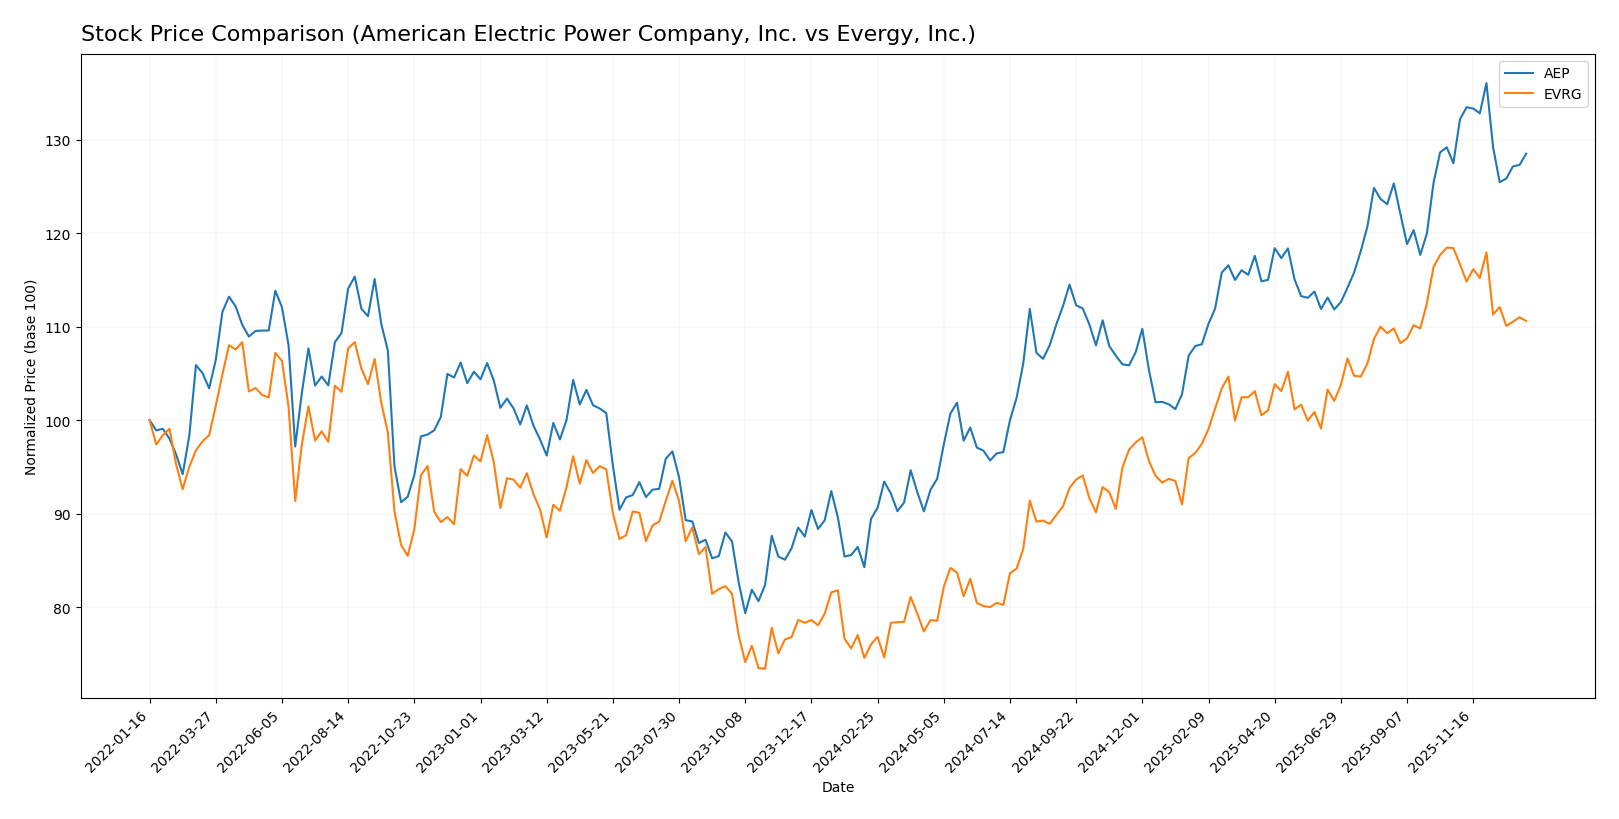
The stock price movements of American Electric Power Company, Inc. (AEP) and Evergy, Inc. (EVRG) over the past 12 months reveal significant bullish trends with decelerating momentum, punctuated by recent contrasting short-term performances.
Trend Analysis
American Electric Power Company, Inc. (AEP) exhibited a 43.71% price increase over the past year, indicating a bullish trend with deceleration. The stock reached a high of 123.77 and a low of 81.35, showing notable volatility (std deviation 10.6). Recent weeks show a slight 0.8% rise but a mild downward slope.
Evergy, Inc. (EVRG) showed a 45.55% price increase over the past year, also bullish with deceleration. The price ranged between 49.12 and 77.98 with lower volatility (std deviation 7.94). However, recent months experienced a 6.59% decline and a downward slope, reflecting a short-term bearish shift.
Comparing the two, EVRG delivered a marginally higher annual market performance than AEP. Despite recent short-term weakness, EVRG outperformed AEP in total price appreciation over the analyzed period.
Target Prices
The consensus target prices for these utilities reflect cautious optimism from analysts.
| Company | Target High | Target Low | Consensus |
|---|---|---|---|
| American Electric Power Company, Inc. | 138 | 107 | 126.82 |
| Evergy, Inc. | 93 | 76 | 82.67 |
Analysts expect American Electric Power’s stock to appreciate from $116.91 toward a consensus of $126.82, suggesting moderate upside. Evergy’s consensus target of $82.67 also points to potential gains from its current price near $72.82.
Analyst Opinions Comparison
This section compares analysts’ ratings and grades for American Electric Power Company, Inc. (AEP) and Evergy, Inc. (EVRG):
Rating Comparison
AEP Rating
- Rating: B+, rated very favorable overall.
- Discounted Cash Flow Score: 4, indicating a favorable evaluation of cash flow.
- ROE Score: 4, showing favorable profitability from equity.
- ROA Score: 4, demonstrating favorable asset utilization.
- Debt To Equity Score: 2, a moderate level of financial risk.
- Overall Score: 3, a moderate overall financial standing.
EVRG Rating
- Rating: B-, rated very favorable overall.
- Discounted Cash Flow Score: 1, considered very unfavorable for cash flow.
- ROE Score: 3, moderate profitability from equity.
- ROA Score: 3, moderate asset utilization.
- Debt To Equity Score: 2, a moderate level of financial risk.
- Overall Score: 2, a moderate but lower overall financial standing.
Which one is the best rated?
Based strictly on the provided data, AEP holds a higher rating (B+) compared to EVRG’s B-. AEP scores better in discounted cash flow, ROE, ROA, and overall score, suggesting a stronger financial profile in these areas.
Scores Comparison
Here is a comparison of the Altman Z-Score and Piotroski Score for the two companies:
AEP Scores
- Altman Z-Score: 0.998, indicating distress zone risk level.
- Piotroski Score: 6, reflecting average financial strength.
EVRG Scores
- Altman Z-Score: 0.821, indicating distress zone risk level.
- Piotroski Score: 5, reflecting average financial strength.
Which company has the best scores?
Both AEP and EVRG fall into the distress zone for Altman Z-Score, with AEP slightly higher. AEP also has a marginally better Piotroski Score, suggesting slightly stronger financial health relative to EVRG based on these metrics.
Grades Comparison
Here is a detailed comparison of the recent grades provided by reputable financial institutions for the two companies:
American Electric Power Company, Inc. Grades
The following table summarizes recent grades from verified grading companies for American Electric Power Company, Inc.:
| Grading Company | Action | New Grade | Date |
|---|---|---|---|
| UBS | Maintain | Sell | 2025-12-17 |
| JP Morgan | Maintain | Neutral | 2025-12-12 |
| Jefferies | Upgrade | Buy | 2025-11-17 |
| Citigroup | Maintain | Neutral | 2025-10-31 |
| Wells Fargo | Maintain | Overweight | 2025-10-30 |
| Evercore ISI Group | Maintain | Outperform | 2025-10-30 |
| Morgan Stanley | Maintain | Overweight | 2025-10-30 |
| Mizuho | Maintain | Neutral | 2025-10-30 |
| BMO Capital | Downgrade | Market Perform | 2025-10-30 |
| Scotiabank | Maintain | Sector Perform | 2025-10-30 |
The overall trend for American Electric Power shows a mix of neutral to moderately positive grades, with some downgrades but also upgrades, reflecting a balanced but cautious market sentiment.
Evergy, Inc. Grades
The following table summarizes recent grades from verified grading companies for Evergy, Inc.:
| Grading Company | Action | New Grade | Date |
|---|---|---|---|
| Mizuho | Downgrade | Neutral | 2025-12-18 |
| UBS | Maintain | Buy | 2025-12-17 |
| Citigroup | Maintain | Buy | 2025-11-10 |
| Jefferies | Maintain | Buy | 2025-10-09 |
| Mizuho | Maintain | Outperform | 2025-08-08 |
| Mizuho | Maintain | Outperform | 2025-07-18 |
| Barclays | Maintain | Overweight | 2025-05-30 |
| Citigroup | Maintain | Buy | 2025-05-16 |
| UBS | Upgrade | Buy | 2025-04-28 |
| Barclays | Maintain | Overweight | 2025-04-22 |
Evergy’s grades predominantly reflect positive recommendations, with many buy and outperform ratings and only one recent downgrade, indicating generally favorable analyst sentiment.
Which company has the best grades?
Both companies carry a consensus “Buy” rating, but Evergy, Inc. has a stronger pattern of consistent buy and outperform grades from multiple respected analysts, suggesting a more positive outlook. This may influence investors seeking growth potential, while American Electric Power shows mixed signals that suggest a more cautious investment stance.
Strengths and Weaknesses
Below is a comparative overview of the key strengths and weaknesses for American Electric Power Company, Inc. (AEP) and Evergy, Inc. (EVRG) based on the most recent fundamental data.
| Criterion | American Electric Power (AEP) | Evergy, Inc. (EVRG) |
|---|---|---|
| Diversification | Strong revenue diversification with Transmission & Distribution at $5.88B, Generation & Marketing at $1.94B, and other services contributing significantly | Primarily focused on Electric Utility segment, $2.71B revenue, less diversified |
| Profitability | Net margin favorable at 14.9%, growing ROIC trend but currently shedding value (ROIC 4.96% < WACC 5.52%) | Net margin favorable at 15.0%, also growing ROIC but ROIC (4.52%) below WACC (5.36%) indicating value destruction |
| Innovation | Moderate — steady investment but no standout innovation metrics | Moderate — consistent but no significant innovation edge evident |
| Global presence | Limited; primarily US-focused utility operations | Limited; focused on regional utility operations |
| Market Share | Large market share in transmission & distribution utilities | Smaller regional market share relative to AEP |
Key takeaways: Both AEP and EVRG show growing profitability trends but currently operate below the threshold of value creation, with ROIC trailing WACC. AEP benefits from better diversification and a larger operational scale, while EVRG has a stronger net margin but less diversified revenue. Investors should weigh growth prospects against current value destruction and sector-specific risks.
Risk Analysis
Below is a comparative table summarizing key risks for American Electric Power Company, Inc. (AEP) and Evergy, Inc. (EVRG) as of 2026:
| Metric | American Electric Power Company, Inc. (AEP) | Evergy, Inc. (EVRG) |
|---|---|---|
| Market Risk | Moderate (beta 0.615, stable utility sector) | Moderate (beta 0.646, regional exposure) |
| Debt level | High (Debt/Equity 1.7, Interest Coverage 2.53) | High (Debt/Equity 1.41, Interest Coverage 2.61) |
| Regulatory Risk | Elevated (subject to US energy regulations and environmental policies) | Elevated (Kansas & Missouri state regulations) |
| Operational Risk | Medium (diverse energy mix but aging infrastructure concerns) | Medium (extensive transmission but smaller scale) |
| Environmental Risk | Significant (coal reliance, transition risks) | Significant (coal and fossil fuels exposure) |
| Geopolitical Risk | Low (domestic operations only) | Low (domestic operations only) |
Both companies face notable risks related to high leverage and exposure to regulatory and environmental pressures as they transition to cleaner energy sources. Their Altman Z-Scores place them in the distress zone, underscoring financial vulnerability. Market risk remains moderate given their utility sector stability, but debt levels and environmental compliance are the most impactful risks to monitor closely.
Which Stock to Choose?
American Electric Power Company, Inc. (AEP) shows a favorable income statement with 71.43% positive metrics, including a 14.9% net margin and strong profitability growth. However, its financial ratios reveal a slightly unfavorable overall status due to high debt and low liquidity, despite a very favorable B+ rating.
Evergy, Inc. (EVRG) has a similarly favorable income profile, with 78.57% positive income metrics and a 15.0% net margin. Its financial ratios are slightly more unfavorable than AEP’s, reflecting moderate profitability and debt concerns, though it holds a very favorable B- rating.
Investors seeking growth might view EVRG’s stronger income growth and slightly better net margin as appealing, while those prioritizing financial stability and higher credit ratings could lean toward AEP. Both companies show value destruction in MOAT terms but improving profitability, suggesting a preference depends on individual risk tolerance and investment strategy.
Disclaimer: Investment carries a risk of loss of initial capital. The past performance is not a reliable indicator of future results. Be sure to understand risks before making an investment decision.
Go Further
I encourage you to read the complete analyses of American Electric Power Company, Inc. and Evergy, Inc. to enhance your investment decisions: