In the evolving energy sector, American Electric Power Company, Inc. (AEP) and Entergy Corporation (ETR) stand out as major players in regulated electric utilities. Both companies generate and distribute electricity across multiple U.S. states, embracing diverse energy sources including nuclear and renewables. Their shared focus on innovation and market presence makes them natural competitors. In this article, I will help you decide which company offers the most compelling investment opportunity.
Table of contents
Companies Overview
I will begin the comparison between American Electric Power Company, Inc. and Entergy Corporation by providing an overview of these two companies and their main differences.
American Electric Power Company, Inc. Overview
American Electric Power Company, Inc. is a leading electric public utility holding company engaged in generating, transmitting, and distributing electricity in the US. Operating through multiple segments, it utilizes diverse energy sources, including coal, natural gas, nuclear, hydro, solar, and wind. Founded in 1906 and headquartered in Columbus, Ohio, AEP serves retail and wholesale customers with a market cap of $62.6B.
Entergy Corporation Overview
Entergy Corporation, headquartered in New Orleans, Louisiana, produces and distributes electricity primarily in Arkansas, Louisiana, Mississippi, and Texas. Its business includes utility operations and wholesale commodity sales, with a significant focus on nuclear power plants. Founded in 1913, Entergy generates electricity from gas, nuclear, coal, hydro, and solar sources, serving 3 million customers and holding a market cap of $41.8B.
Key similarities and differences
Both companies operate in the regulated electric utility sector, generating and distributing electricity from diverse sources including nuclear, coal, gas, hydro, and solar power. AEP has a broader geographic reach and higher market capitalization, while Entergy focuses on specific southern states with a notable emphasis on nuclear power capacity. Each company serves both retail and wholesale customers but differs in scale and regional footprint.
Income Statement Comparison
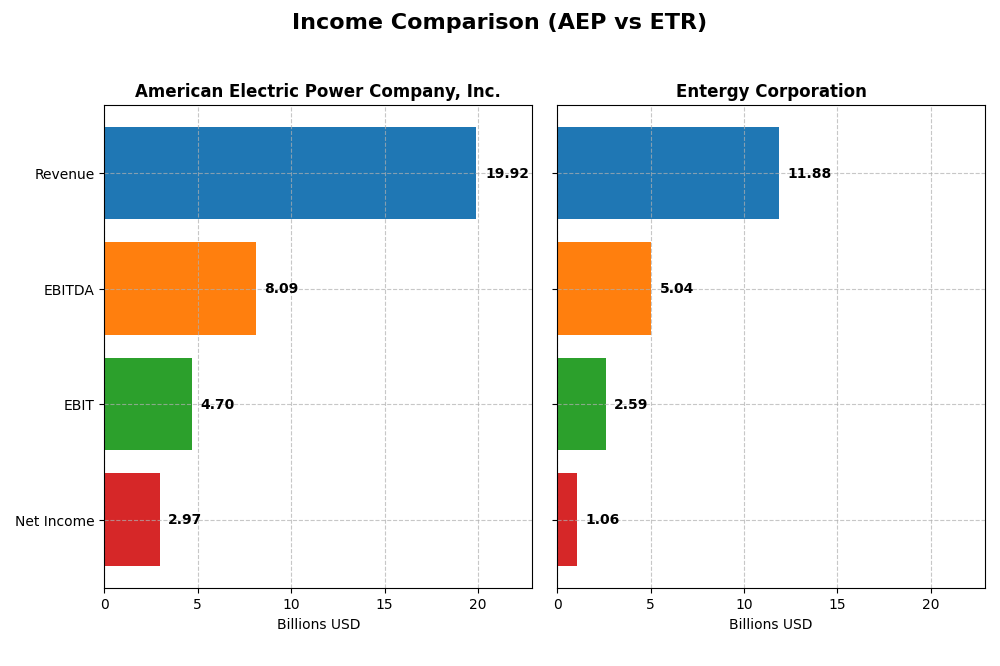
The table below presents a factual comparison of the most recent fiscal year income statement metrics for American Electric Power Company, Inc. (AEP) and Entergy Corporation (ETR), reflecting their financial performance in 2024.
| Metric | American Electric Power Company, Inc. (AEP) | Entergy Corporation (ETR) |
|---|---|---|
| Market Cap | 62.6B | 41.8B |
| Revenue | 19.9B | 11.9B |
| EBITDA | 8.1B | 5.0B |
| EBIT | 4.7B | 2.6B |
| Net Income | 3.0B | 1.1B |
| EPS | 5.60 | 2.47 |
| Fiscal Year | 2024 | 2024 |
Income Statement Interpretations
American Electric Power Company, Inc.
American Electric Power’s revenue increased steadily from $14.9B in 2020 to $19.9B in 2024, with net income rising from $2.2B to nearly $3B. Margins remained generally stable with a favorable gross margin around 32% and a net margin of 14.9%. The 2024 results showed slower revenue growth at 2.76%, but strong improvements in net margin and earnings per share.
Entergy Corporation
Entergy’s revenue grew from $10.1B in 2020 to $11.9B in 2024 but declined compared to 2023, with net income dropping from $1.4B to about $1.1B. Gross margin was favorable at 48.3%, while net margin was lower at 8.93%. The latest year showed a negative trend in revenue, EBIT, and net income growth, signaling pressure on profitability and margins.
Which one has the stronger fundamentals?
American Electric Power displays stronger fundamentals with consistent revenue and net income growth over five years, favorable margins, and recent improvement in profitability metrics. Conversely, Entergy faces declining net income and margins with unfavorable growth indicators despite a solid gross margin. Overall, AEP’s income statement reflects more robust and positive financial health.
Financial Ratios Comparison
The table below presents a side-by-side comparison of key financial ratios for American Electric Power Company, Inc. (AEP) and Entergy Corporation (ETR) based on their most recent fiscal year data from 2024.
| Ratios | American Electric Power Company, Inc. (AEP) | Entergy Corporation (ETR) |
|---|---|---|
| ROE | 11.0% | 7.0% |
| ROIC | 5.0% | 3.2% |
| P/E | 16.5 | 30.6 |
| P/B | 1.8 | 2.1 |
| Current Ratio | 0.44 | 0.72 |
| Quick Ratio | 0.31 | 0.43 |
| D/E (Debt-to-Equity) | 1.70 | 1.91 |
| Debt-to-Assets | 44.4% | 44.6% |
| Interest Coverage | 2.56 | 2.30 |
| Asset Turnover | 0.19 | 0.18 |
| Fixed Asset Turnover | 0.24 | 0.25 |
| Payout ratio | 64.2% | 94.2% |
| Dividend yield | 3.9% | 3.1% |
Interpretation of the Ratios
American Electric Power Company, Inc.
American Electric Power shows a mix of strengths and weaknesses in its 2024 ratios. While net margin and dividend yield are favorable, concerns arise from low liquidity ratios, high debt-to-equity, and poor asset turnover. Return on equity is neutral but return on invested capital remains unfavorable, indicating efficiency challenges. The company pays dividends with a 3.89% yield, supported by a stable payout ratio, though some leverage risks persist.
Entergy Corporation
Entergy’s 2024 ratios reflect several unfavorable metrics, including low return on equity, high price-to-earnings ratio, and considerable debt levels. Liquidity ratios are below ideal, and asset turnover is weak, signaling operational inefficiency. Despite these issues, the dividend yield remains favorable at 3.08%. The company maintains its dividend payments, but the elevated payout ratio and financial leverage may pose risks.
Which one has the best ratios?
Comparing both, American Electric Power holds a slightly more favorable overall ratio profile with 21.43% favorable metrics versus Entergy’s 14.29%. Entergy faces more pronounced weaknesses, especially in profitability and valuation multiples. Both companies struggle with liquidity and leverage, but AEP’s stronger profitability and dividend yield provide a modest edge in ratio quality.
Strategic Positioning
This section compares the strategic positioning of American Electric Power Company, Inc. (AEP) and Entergy Corporation (ETR) based on Market position, Key segments, and Exposure to technological disruption:
American Electric Power Company, Inc. (AEP)
- Large market cap of $62.6B with diversified operations in generation, transmission, and distribution.
- Key segments include Vertically Integrated Utilities, Transmission & Distribution, and Generation & Marketing.
- Uses diverse energy sources: coal, natural gas, nuclear, hydro, solar, wind, and others.
Entergy Corporation (ETR)
- Smaller market cap of $41.8B focused on electricity production and retail distribution.
- Operates Utility and Wholesale Commodities segments, with strong nuclear power presence.
- Generates electricity mainly via gas, nuclear, coal, hydro, and solar power.
AEP vs ETR Positioning
AEP follows a diversified strategy across generation, transmission, and distribution, leveraging multiple energy sources. ETR has a more concentrated focus on utility and wholesale commodities, with significant nuclear capacity. Diversification offers AEP broader revenue streams, while ETR’s focus may limit exposure but concentrates expertise.
Which has the best competitive advantage?
Both companies are shedding value with ROIC below WACC. AEP shows growing profitability despite value destruction (Slightly Unfavorable moat), while ETR has declining profitability and a Very Unfavorable moat, indicating weaker competitive advantage.
Stock Comparison
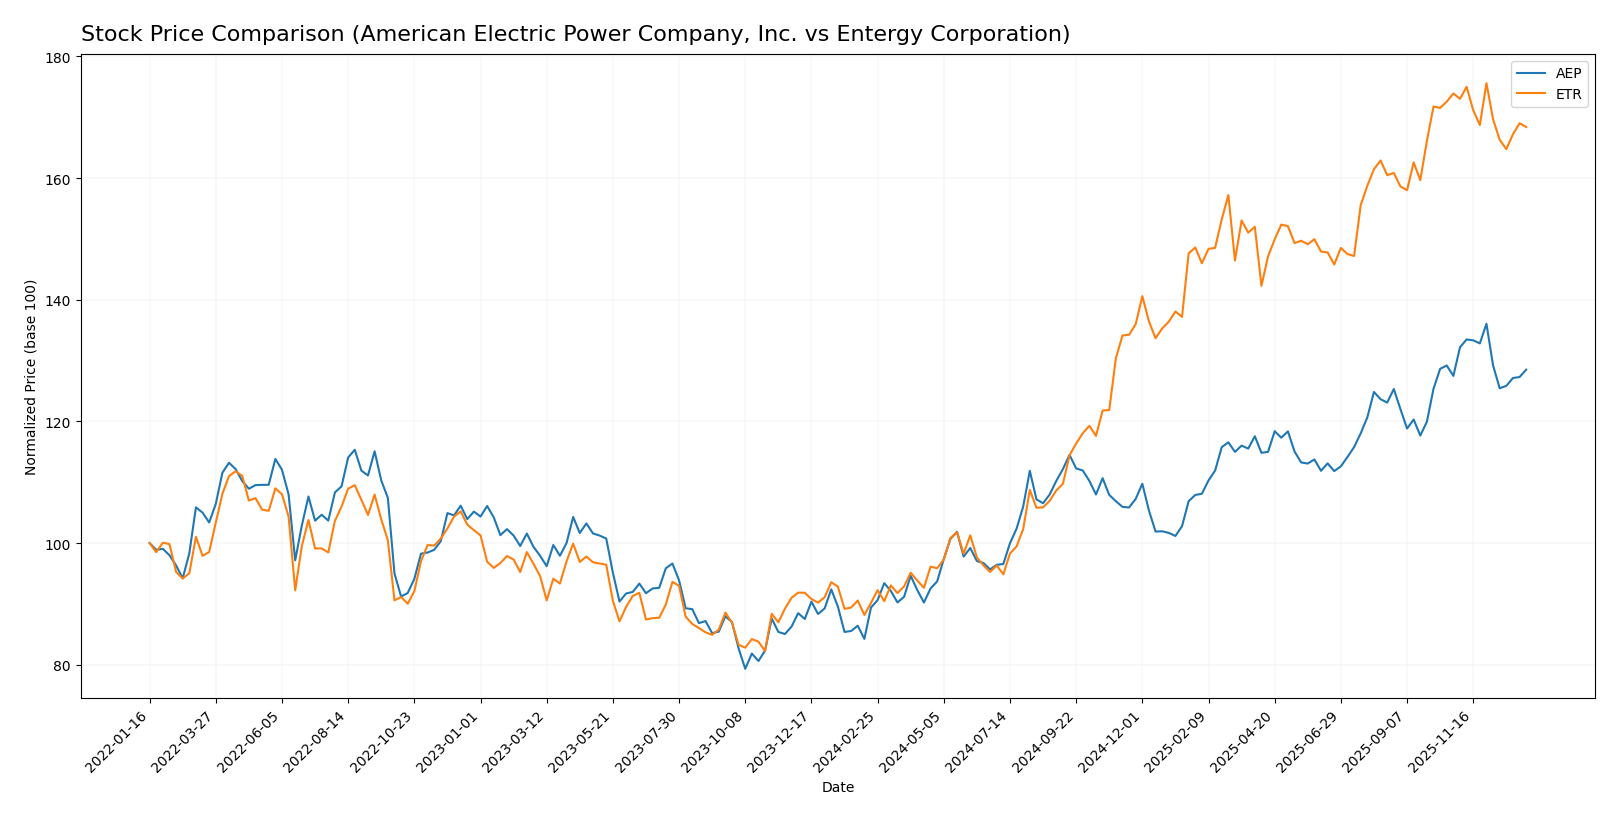
The stock prices of American Electric Power Company, Inc. (AEP) and Entergy Corporation (ETR) have shown notable bullish trends over the past 12 months, with varying degrees of acceleration and recent trading dynamics.
Trend Analysis
American Electric Power Company, Inc. (AEP) exhibited a strong bullish trend over the past year, with a 43.71% price increase and deceleration in momentum. Recent weeks show a neutral trend with a 0.8% price change and slight negative slope.
Entergy Corporation (ETR) demonstrated an even stronger bullish trend with an 86.74% price increase over the same period, also decelerating. However, recent weeks reveal a bearish trend with a -3.17% price change and a mild downward slope.
Comparing the two, Entergy Corporation (ETR) delivered the highest market performance over the past year, despite its recent bearish movement, outperforming AEP’s more moderate gains.
Target Prices
Analysts present a clear target price consensus for both American Electric Power Company, Inc. and Entergy Corporation, reflecting moderate upside potential.
| Company | Target High | Target Low | Consensus |
|---|---|---|---|
| American Electric Power Company, Inc. | 138 | 107 | 126.82 |
| Entergy Corporation | 115 | 91 | 103.17 |
The consensus target prices for AEP and ETR suggest a modest increase potential compared to their current prices of $116.91 and $93.52, respectively, indicating generally positive analyst expectations.
Analyst Opinions Comparison
This section compares analysts’ ratings and grades for American Electric Power Company, Inc. (AEP) and Entergy Corporation (ETR):
Rating Comparison
AEP Rating
- Rating: B+, classified as Very Favorable by analysts.
- Discounted Cash Flow Score: 4, indicating a Favorable outlook.
- ROE Score: 4, showing strong efficiency in generating profit.
- ROA Score: 4, reflecting effective asset utilization.
- Debt To Equity Score: 2, indicating moderate financial risk.
- Overall Score: 3, assessed as Moderate.
ETR Rating
- Rating: B-, also classified as Very Favorable by analysts.
- Discounted Cash Flow Score: 1, indicating a Very Unfavorable outlook.
- ROE Score: 4, showing strong efficiency in generating profit.
- ROA Score: 3, reflecting moderate asset utilization.
- Debt To Equity Score: 2, indicating moderate financial risk.
- Overall Score: 2, assessed as Moderate.
Which one is the best rated?
Based strictly on the provided data, AEP holds a higher overall rating (B+) and better discounted cash flow and return on assets scores than ETR. ETR matches AEP in ROE and debt-to-equity scores but scores lower overall.
Scores Comparison
Here is a comparison of the Altman Z-Score and Piotroski Score for the two companies:
AEP Scores
- Altman Z-Score: 0.998, in distress zone, high risk of bankruptcy
- Piotroski Score: 6, average financial strength
ETR Scores
- Altman Z-Score: 1.036, in distress zone, high risk of bankruptcy
- Piotroski Score: 4, average financial strength
Which company has the best scores?
Both AEP and ETR are in the distress zone based on Altman Z-Scores, indicating high bankruptcy risk. AEP has a higher Piotroski Score (6) than ETR (4), suggesting relatively stronger financial health, strictly from the provided data.
Grades Comparison
Here is a detailed comparison of the recent grades assigned to American Electric Power Company, Inc. and Entergy Corporation:
American Electric Power Company, Inc. Grades
The following table summarizes recent grades from major financial institutions for AEP:
| Grading Company | Action | New Grade | Date |
|---|---|---|---|
| UBS | Maintain | Sell | 2025-12-17 |
| JP Morgan | Maintain | Neutral | 2025-12-12 |
| Jefferies | Upgrade | Buy | 2025-11-17 |
| Citigroup | Maintain | Neutral | 2025-10-31 |
| Wells Fargo | Maintain | Overweight | 2025-10-30 |
| Evercore ISI Group | Maintain | Outperform | 2025-10-30 |
| Morgan Stanley | Maintain | Overweight | 2025-10-30 |
| Mizuho | Maintain | Neutral | 2025-10-30 |
| BMO Capital | Downgrade | Market Perform | 2025-10-30 |
| Scotiabank | Maintain | Sector Perform | 2025-10-30 |
The grades for AEP show a mix of opinions, with a general tilt towards neutral to positive ratings, though UBS maintains a Sell rating, indicating some caution.
Entergy Corporation Grades
This table presents recent grades from recognized grading companies for ETR:
| Grading Company | Action | New Grade | Date |
|---|---|---|---|
| Argus Research | Maintain | Buy | 2026-01-06 |
| UBS | Maintain | Buy | 2025-12-17 |
| Keybanc | Maintain | Overweight | 2025-12-12 |
| JP Morgan | Maintain | Overweight | 2025-12-11 |
| Citigroup | Maintain | Neutral | 2025-11-18 |
| Evercore ISI Group | Maintain | In Line | 2025-10-30 |
| Mizuho | Maintain | Outperform | 2025-10-27 |
| Morgan Stanley | Maintain | Equal Weight | 2025-10-22 |
| B of A Securities | Maintain | Neutral | 2025-10-16 |
| Keybanc | Maintain | Overweight | 2025-10-15 |
Entergy’s grades predominantly indicate positive sentiment, with multiple Buy and Overweight ratings consistently maintained.
Which company has the best grades?
Both AEP and ETR have a consensus “Buy” rating, but Entergy Corporation shows a stronger concentration of Buy and Overweight grades without any Sell ratings, suggesting more bullish sentiment. This difference could influence investors seeking slightly more optimistic analyst views.
Strengths and Weaknesses
Below is a comparative table outlining key strengths and weaknesses of American Electric Power Company, Inc. (AEP) and Entergy Corporation (ETR) based on their recent financial and operational data.
| Criterion | American Electric Power Company, Inc. (AEP) | Entergy Corporation (ETR) |
|---|---|---|
| Diversification | Moderate diversification with strong Transmission & Distribution segment (approx. $5.9B in 2024) plus Generation & Marketing | Moderate diversification focused on Commercial, Industrial, and Residential sectors with electricity and natural gas |
| Profitability | Net margin favorable at 14.9%, ROIC slightly unfavorable at 4.96% but improving | Net margin neutral at 8.93%, ROIC unfavorable at 3.2%, declining trend |
| Innovation | Limited data on innovation; steady improvement in ROIC suggests operational enhancements | Declining ROIC trend indicates challenges in innovation or operational efficiency |
| Global presence | Primarily US-focused with extensive vertically integrated utilities | US-focused utility with emphasis on regulated electricity and natural gas markets |
| Market Share | Strong footprint in Transmission and Distribution | Solid presence in utility markets but facing value destruction |
Key Takeaways: AEP shows a growing profitability trend and a strong position in transmission and distribution, despite currently shedding value. ETR faces more pronounced challenges with declining profitability and value destruction, reflecting a less favorable investment profile. Investors should weigh AEP’s improving returns against ETR’s deteriorating financial health.
Risk Analysis
Below is a comparative overview of key risks for American Electric Power Company, Inc. (AEP) and Entergy Corporation (ETR) based on the most recent data from 2024.
| Metric | American Electric Power Company, Inc. (AEP) | Entergy Corporation (ETR) |
|---|---|---|
| Market Risk | Moderate (Beta 0.615) | Moderate (Beta 0.648) |
| Debt level | High (Debt/Equity 1.7, Interest coverage 2.53) | High (Debt/Equity 1.91, Interest coverage 2.25) |
| Regulatory Risk | Moderate (Utility sector exposure) | Moderate (Utility and nuclear operations) |
| Operational Risk | Elevated (Low asset turnover, diverse energy sources) | Elevated (Low asset turnover, nuclear plant decommissioning) |
| Environmental Risk | Moderate (Coal and natural gas usage) | Moderate to High (Nuclear power and coal) |
| Geopolitical Risk | Low (US-focused operations) | Low (US-focused operations) |
Both companies face significant operational and environmental risks due to reliance on fossil fuels and nuclear energy, with debt levels indicating moderate financial risk. AEP’s slightly better interest coverage provides a modest cushion, but both firms remain in a distress zone per Altman Z-Scores, signaling caution. Regulatory and market risks are typical for regulated utilities operating primarily in the US.
Which Stock to Choose?
American Electric Power Company, Inc. (AEP) shows a favorable income statement with a 14.9% net margin and strong growth in earnings and profitability. Its financial ratios are slightly unfavorable overall, with some concerns on liquidity and leverage. The company is shedding value but improving profitability, rated B+ with moderate overall scores.
Entergy Corporation (ETR) presents a mixed income profile, with a lower net margin of 8.93% and several unfavorable growth indicators, including shrinking net income. Financial ratios are generally unfavorable, especially with high leverage and valuation concerns. The company is destroying value with declining profitability, rated B- with moderate overall scores.
Investors seeking growth and improving profitability might find AEP more appealing given its favorable income trends and higher rating, while those accepting more risk amid value destruction could consider ETR. The choice could depend on risk tolerance and investment strategy preferences.
Disclaimer: Investment carries a risk of loss of initial capital. The past performance is not a reliable indicator of future results. Be sure to understand risks before making an investment decision.
Go Further
I encourage you to read the complete analyses of American Electric Power Company, Inc. and Entergy Corporation to enhance your investment decisions: