American Electric Power Company, Inc. (AEP) and Edison International (EIX) are two leading players in the regulated electric utility sector, each powering millions of customers across distinct U.S. regions. Both companies emphasize innovation in energy generation and grid modernization, competing to shape the future of electricity delivery. This comparison will help investors identify which utility holds the most promise for a balanced and growth-oriented portfolio in 2026.
Table of contents
Companies Overview
I will begin the comparison between American Electric Power Company, Inc. and Edison International by providing an overview of these two companies and their main differences.
American Electric Power Company, Inc. Overview
American Electric Power Company, Inc. is a major electric public utility holding company operating in the United States. Founded in 1906 and headquartered in Columbus, Ohio, AEP focuses on the generation, transmission, and distribution of electricity using diverse sources such as coal, natural gas, nuclear, hydro, solar, and wind. It serves both retail and wholesale customers through multiple business segments and is listed on NASDAQ with a market cap of about 62.6B USD.
Edison International Overview
Edison International, founded in 1886 and based in Rosemead, California, delivers electric power primarily across Southern, Central, and Coastal California to around 15 million customers. The company’s infrastructure includes extensive transmission and distribution systems, supporting residential, commercial, and industrial users. Listed on the NYSE, Edison International has a market capitalization near 23.5B USD, focusing on regulated electric utility services and energy solutions.
Key similarities and differences
Both companies operate in the regulated electric utilities sector in the United States, focusing on electricity generation and distribution. AEP has a broader national footprint and a more diversified energy mix, while Edison International concentrates its operations regionally in California with a large customer base. Market capitalization also differs significantly, with AEP nearly three times larger than Edison International. Both firms maintain stable dividend payments and have beta values under 1, indicating relatively lower volatility.
Income Statement Comparison
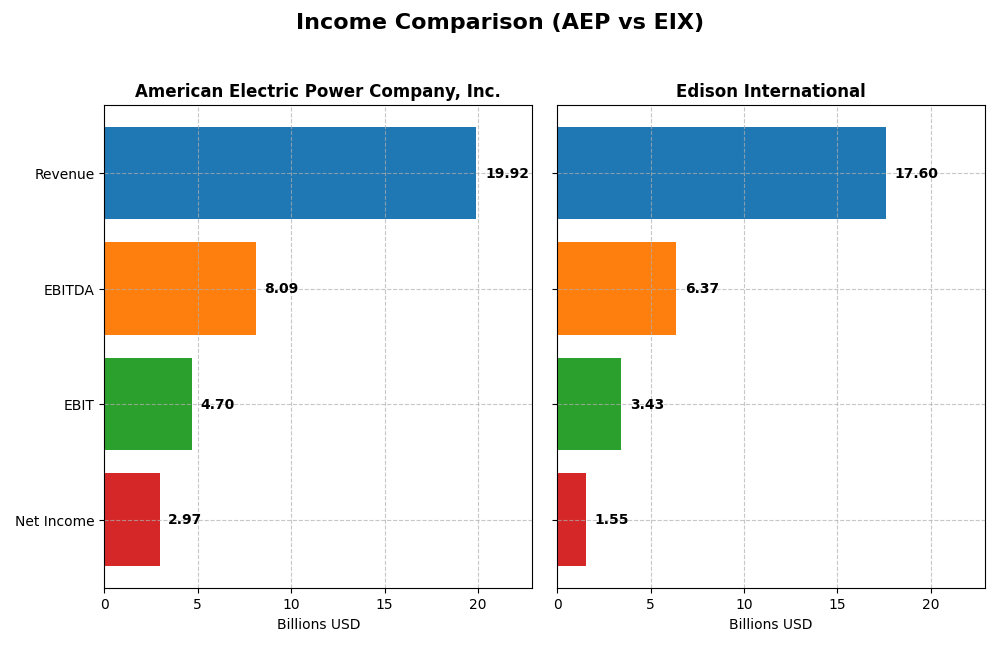
The table below presents a side-by-side income statement comparison for American Electric Power Company, Inc. and Edison International for the fiscal year 2024.
| Metric | American Electric Power Company, Inc. | Edison International |
|---|---|---|
| Market Cap | 62.6B | 23.5B |
| Revenue | 19.9B | 17.6B |
| EBITDA | 8.1B | 6.4B |
| EBIT | 4.7B | 3.4B |
| Net Income | 3.0B | 1.5B |
| EPS | 5.6 | 3.33 |
| Fiscal Year | 2024 | 2024 |
Income Statement Interpretations
American Electric Power Company, Inc.
From 2020 to 2024, American Electric Power Company, Inc. saw steady revenue growth of 33.6%, with net income rising by 34.9%. Gross and EBIT margins remained favorable at 31.9% and 23.6%, respectively. In 2024, revenue growth slowed to 2.8%, but gross profit and net margin improved significantly, reflecting enhanced operational efficiency and profitability.
Edison International
Edison International’s revenue increased by 29.6% over the period 2020-2024, with net income growth outpacing at 77.5%. The company maintained a strong gross margin of 41.0%, though its EBIT margin was lower at 19.5%. In 2024, revenue growth was moderate at 7.7%, supported by favorable gross profit and EBIT growth, while net margin growth remained stable.
Which one has the stronger fundamentals?
Both companies exhibit favorable income statement fundamentals, with Edison International showing higher net income and EPS growth over the period and stronger gross margins. American Electric Power demonstrates more stable margins and a higher EBIT margin. Edison’s higher interest expense ratio is a relative weakness, whereas AEP’s margin improvements in 2024 indicate operational strength.
Financial Ratios Comparison
The table below presents a side-by-side comparison of key financial ratios for American Electric Power Company, Inc. (AEP) and Edison International (EIX) based on their most recent fiscal year data (2024).
| Ratios | American Electric Power Co. (AEP) | Edison International (EIX) |
|---|---|---|
| ROE | 11.0% | 9.9% |
| ROIC | 5.0% | 3.6% |
| P/E | 16.5 | 19.9 |
| P/B | 1.81 | 1.98 |
| Current Ratio | 0.44 | 0.85 |
| Quick Ratio | 0.31 | 0.78 |
| D/E (Debt-to-Equity Ratio) | 1.70 | 2.43 |
| Debt-to-Assets | 44.4% | 44.1% |
| Interest Coverage | 2.56 | 1.57 |
| Asset Turnover | 0.19 | 0.21 |
| Fixed Asset Turnover | 0.24 | 0.29 |
| Payout Ratio | 64.2% | 83.2% |
| Dividend Yield | 3.9% | 4.2% |
Interpretation of the Ratios
American Electric Power Company, Inc.
American Electric Power shows a mixed financial profile with favorable net margin and weighted average cost of capital, but several unfavorable liquidity and efficiency ratios, including a low current ratio of 0.44 and a high debt-to-equity ratio of 1.7. Return on invested capital at 4.96% is also a concern. The company supports shareholders with a 3.89% dividend yield, indicating steady income generation.
Edison International
Edison International’s financial ratios display more weaknesses, with unfavorable returns on equity (9.93%) and invested capital (3.61%), alongside a higher debt-to-equity ratio of 2.43 and a weak interest coverage ratio of 1.84. The current ratio of 0.85 remains below ideal. The company pays a dividend yielding 4.17%, providing reasonable shareholder returns despite its operational challenges.
Which one has the best ratios?
American Electric Power holds a slight advantage due to its stronger net margin and more favorable cost of capital, despite liquidity concerns. Edison International’s ratios reflect greater financial strain with more unfavorable metrics, especially in leverage and profitability, resulting in a generally less favorable ratio profile compared to American Electric Power.
Strategic Positioning
This section compares the strategic positioning of American Electric Power Company, Inc. (AEP) and Edison International (EIX) in terms of market position, key segments, and exposure to technological disruption:
American Electric Power Company, Inc.
- Large market cap of $62.6B, operating in regulated electric utilities with moderate competitive pressure.
- Diverse revenue streams from generation, transmission, distribution, and marketing segments across multiple energy sources.
- Utilizes a mix of coal, natural gas, nuclear, hydro, solar, and wind, indicating moderate exposure to technological shifts.
Edison International
- Smaller market cap of $23.5B, serving regulated electric market in California with moderate competitive pressure.
- Focused on electric utility services and competitive power generation, primarily in Southern California.
- Transmission and distribution infrastructure concentrated regionally, with less detail on technological diversification.
AEP vs EIX Positioning
AEP’s approach is diversified across multiple segments and energy sources, providing broad revenue bases but complex operations. EIX’s more concentrated focus on California utilities and competitive generation limits diversification but may allow operational focus within its region.
Which has the best competitive advantage?
Both companies show a slightly unfavorable MOAT as they are shedding value but improving profitability. AEP’s lower value destruction and larger scale suggest a potentially stronger competitive position relative to EIX.
Stock Comparison
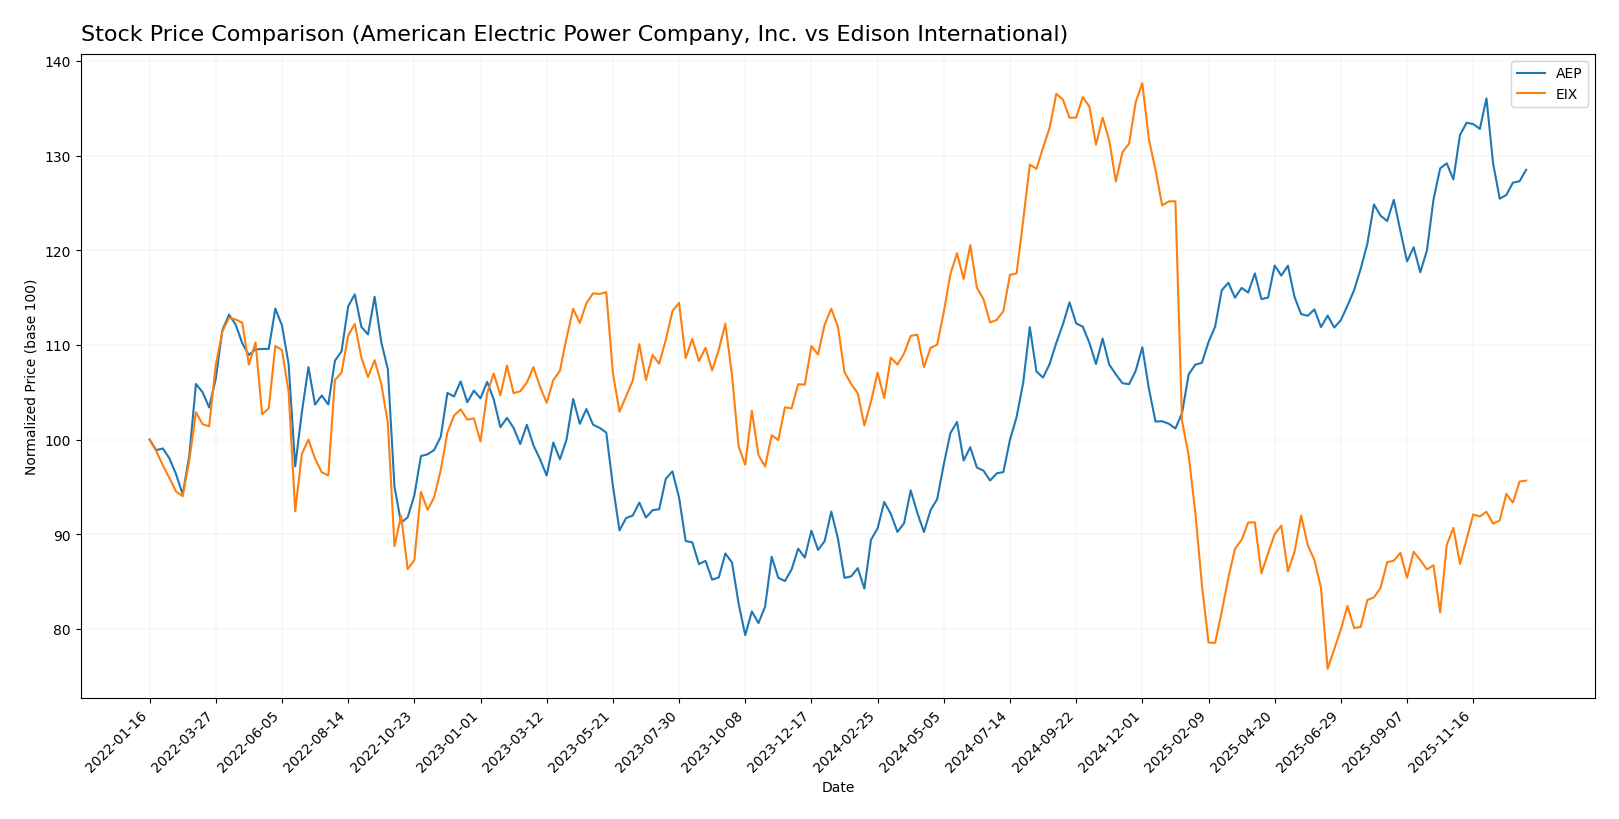
The stock price chart reflects significant divergence in performance between American Electric Power Company, Inc. (AEP) and Edison International (EIX) over the past 12 months, with AEP showing strong gains and EIX experiencing declines amid varying trading volumes.
Trend Analysis
American Electric Power Company, Inc. (AEP) exhibited a bullish trend over the past 12 months with a 43.71% price increase, though the trend shows deceleration and a notable volatility of 10.6%. Recent months indicate a neutral trend with a slight 0.8% rise.
Edison International (EIX) showed a bearish trend over the same period, declining by 8.02% while volatility remained high at 12.11%. Recently, EIX reversed slightly with a 5.5% price increase, suggesting short-term positive momentum.
Comparing both, AEP delivered the highest market performance with substantial overall gains, whereas EIX faced a notable decline despite recent recovery signs.
Target Prices
The consensus target prices from verified analysts suggest moderate upside potential for these utilities stocks.
| Company | Target High | Target Low | Consensus |
|---|---|---|---|
| American Electric Power Company, Inc. | 138 | 107 | 126.82 |
| Edison International | 70 | 56 | 62 |
For American Electric Power (AEP), the consensus target of 126.82 USD implies an upside from the current price of 116.91 USD. Edison International (EIX) shows a target consensus of 62 USD, slightly above its current price of 60.99 USD, indicating modest growth expectations from analysts.
Analyst Opinions Comparison
This section compares analysts’ ratings and grades for American Electric Power Company, Inc. (AEP) and Edison International (EIX):
Rating Comparison
AEP Rating
- Rating: B+, considered Very Favorable by analysts.
- Discounted Cash Flow Score: 4, Favorable, indicating relatively strong valuation.
- ROE Score: 4, Favorable, showing efficient profit generation from equity.
- ROA Score: 4, Favorable, effective asset utilization to generate earnings.
- Debt To Equity Score: 2, Moderate, suggesting moderate financial risk.
- Overall Score: 3, Moderate, reflecting a balanced financial standing.
EIX Rating
- Rating: B+, also rated Very Favorable by analysts.
- Discounted Cash Flow Score: 1, Very Unfavorable, indicating weak valuation.
- ROE Score: 5, Very Favorable, indicating excellent profit generation.
- ROA Score: 4, Favorable, similarly effective asset use for earnings.
- Debt To Equity Score: 1, Very Unfavorable, indicating higher financial risk.
- Overall Score: 3, Moderate, showing a comparable overall financial position.
Which one is the best rated?
Both AEP and EIX share the same overall rating of B+ and an overall score of 3, indicating moderate financial health. However, AEP scores better in discounted cash flow and debt-to-equity, while EIX excels in return on equity, reflecting differing strengths in financial metrics.
Scores Comparison
Here is the comparison of the Altman Z-Score and Piotroski Score for the two companies:
AEP Scores
- Altman Z-Score: 1.00, in distress zone indicating high bankruptcy risk
- Piotroski Score: 6, rated average financial strength
EIX Scores
- Altman Z-Score: 0.72, in distress zone indicating high bankruptcy risk
- Piotroski Score: 6, rated average financial strength
Which company has the best scores?
Both AEP and EIX are in the distress zone for Altman Z-Score, suggesting financial distress risk. They share the same average Piotroski Score of 6, showing comparable financial strength.
Grades Comparison
Here is a comparison of the recent grades assigned to American Electric Power Company, Inc. and Edison International by various grading companies:
American Electric Power Company, Inc. Grades
The table below shows recent grades issued by recognized financial institutions for AEP:
| Grading Company | Action | New Grade | Date |
|---|---|---|---|
| UBS | Maintain | Sell | 2025-12-17 |
| JP Morgan | Maintain | Neutral | 2025-12-12 |
| Jefferies | Upgrade | Buy | 2025-11-17 |
| Citigroup | Maintain | Neutral | 2025-10-31 |
| Wells Fargo | Maintain | Overweight | 2025-10-30 |
| Evercore ISI Group | Maintain | Outperform | 2025-10-30 |
| Morgan Stanley | Maintain | Overweight | 2025-10-30 |
| Mizuho | Maintain | Neutral | 2025-10-30 |
| BMO Capital | Downgrade | Market Perform | 2025-10-30 |
| Scotiabank | Maintain | Sector Perform | 2025-10-30 |
Overall, AEP’s grades show a mixed trend with a majority maintaining neutral to positive ratings but including a few downgrades and a single sell.
Edison International Grades
Below are recent grades provided by reputable grading firms for EIX:
| Grading Company | Action | New Grade | Date |
|---|---|---|---|
| Morgan Stanley | Maintain | Underweight | 2025-12-17 |
| JP Morgan | Maintain | Neutral | 2025-12-12 |
| UBS | Maintain | Buy | 2025-12-02 |
| Ladenburg Thalmann | Maintain | Neutral | 2025-10-30 |
| Barclays | Maintain | Overweight | 2025-10-29 |
| Jefferies | Maintain | Hold | 2025-10-22 |
| Morgan Stanley | Maintain | Underweight | 2025-10-22 |
| Barclays | Maintain | Overweight | 2025-10-21 |
| Jefferies | Downgrade | Hold | 2025-10-02 |
| JP Morgan | Maintain | Neutral | 2025-09-25 |
EIX’s grades largely reflect stable neutral to overweight ratings, with a few underweight and hold ratings maintained over recent months.
Which company has the best grades?
Both American Electric Power Company, Inc. and Edison International have consensus ratings classified as “Buy.” However, AEP shows a wider range of ratings, including some downgrades and a sell rating, whereas EIX’s grades are more consistently neutral to positive with fewer downgrades. This difference could imply varying levels of confidence from analysts and may influence investors seeking stability versus those willing to take more risk for potential upside.
Strengths and Weaknesses
Below is a comparison of American Electric Power Company, Inc. (AEP) and Edison International (EIX) based on key financial and strategic criteria.
| Criterion | American Electric Power Company, Inc. (AEP) | Edison International (EIX) |
|---|---|---|
| Diversification | Moderate diversification across generation, transmission, and distribution segments; revenues well spread | Less diversified, mainly focused on electric utility and competitive power generation |
| Profitability | Net margin favorable at 14.9%; ROIC slightly unfavorable at 4.96% vs WACC 5.52% | Net margin neutral at 8.78%; ROIC unfavorable at 3.61% vs WACC 5.94% |
| Innovation | Incremental improvement in profitability; ROIC trending upward | Strong ROIC growth trend but still shedding value overall |
| Global presence | Primarily US-focused with extensive transmission and distribution operations | US-focused with emphasis on electric utilities |
| Market Share | Large market share in transmission and distribution with steady revenue base (~$5.9B in 2024) | Significant electric utility market presence but smaller scale in generation |
Key takeaways: Both companies face challenges in creating economic value as ROIC remains below WACC, indicating value destruction. However, their improving ROIC trends signal potential profitability recovery. AEP shows stronger profitability metrics and diversification, whereas EIX’s growth is promising but still lagging in efficiency and leverage metrics. Investors should weigh growth prospects against current value erosion risks.
Risk Analysis
The table below summarizes key risks for American Electric Power Company, Inc. (AEP) and Edison International (EIX) as of the latest fiscal year 2024:
| Metric | American Electric Power (AEP) | Edison International (EIX) |
|---|---|---|
| Market Risk | Moderate (Beta 0.615) | Moderate (Beta 0.829) |
| Debt level | High (Debt/Equity 1.7) | Very High (Debt/Equity 2.43) |
| Regulatory Risk | Elevated (Utilities sector) | Elevated (California focus) |
| Operational Risk | Moderate (Asset turnover low) | Moderate (Asset turnover low) |
| Environmental Risk | High (Coal & gas generation) | High (California wildfire concerns) |
| Geopolitical Risk | Low (US-focused) | Low (US-focused) |
The most impactful risks are the high debt levels for both companies, with Edison International showing a notably higher leverage ratio, which increases financial vulnerability. Environmental risk is also significant: AEP’s reliance on fossil fuels poses transition risks, while EIX faces operational disruptions due to wildfire exposure in California. Both firms have moderate market risk but are subject to intense regulatory scrutiny given their utility status. Investors should carefully monitor debt management and environmental strategies.
Which Stock to Choose?
American Electric Power Company, Inc. (AEP) shows favorable income evolution with strong gross and EBIT margins, a growing net margin, and EPS. Despite slightly unfavorable financial ratios and moderate debt levels, its B+ rating is very favorable, reflecting solid profitability and a growing ROIC trend amid some value destruction.
Edison International (EIX) exhibits favorable income growth marked by consistent increases in net income and EPS, though with weaker margins and higher debt ratios. Financial ratios remain mostly unfavorable, and while it shares a B+ rating with AEP, its discounted cash flow and debt-to-equity scores are very unfavorable, indicating elevated financial risk.
Investors seeking growth and improving profitability might find AEP’s growing ROIC and favorable income statement appealing, whereas those tolerating higher risk for potentially higher returns could view EIX’s strong EPS growth and improving profitability trend as attractive. The choice may depend on individual risk appetite and investment strategy.
Disclaimer: Investment carries a risk of loss of initial capital. The past performance is not a reliable indicator of future results. Be sure to understand risks before making an investment decision.
Go Further
I encourage you to read the complete analyses of American Electric Power Company, Inc. and Edison International to enhance your investment decisions: