Home > Comparison > Utilities > DUK vs AEP
The strategic rivalry between Duke Energy Corporation and American Electric Power Company, Inc. shapes the U.S. regulated electric sector’s future. Duke operates a diversified utility model with significant renewable assets, while American Electric Power focuses on vertically integrated generation and transmission. This head-to-head contrasts a broad-based energy transition approach against a streamlined operational structure. This analysis will reveal which trajectory offers superior risk-adjusted returns for a diversified utility portfolio.
Table of contents
Companies Overview
Duke Energy and American Electric Power dominate the U.S. regulated electric utility landscape.
Duke Energy Corporation: Diverse Energy Utility Leader
Duke Energy operates as a regulated electric utility serving 8.2M customers across six states. Its core revenue stems from generating and distributing electricity through coal, natural gas, nuclear, and renewables. In 2026, it prioritizes expanding commercial renewables, managing 23 wind, 178 solar, and energy storage facilities to balance traditional and clean energy sources.
American Electric Power Company, Inc.: Integrated Power Provider
American Electric Power offers vertically integrated electricity generation and transmission services. It generates revenue by selling electricity to retail and wholesale customers using coal, natural gas, nuclear, hydro, solar, and wind. The 2026 strategy emphasizes strengthening transmission infrastructure to improve reliability while expanding renewable generation capacity within its regulated footprint.
Strategic Collision: Similarities & Divergences
Both firms emphasize regulated electric utilities but differ in approach: Duke balances a broad renewable portfolio with legacy fuels, while AEP focuses on transmission upgrades and integrated operations. Their primary battleground is grid modernization and renewable integration to capture regulatory incentives. Investors will find Duke more diversified in renewables; AEP leans on transmission strength and operational efficiency.
Income Statement Comparison
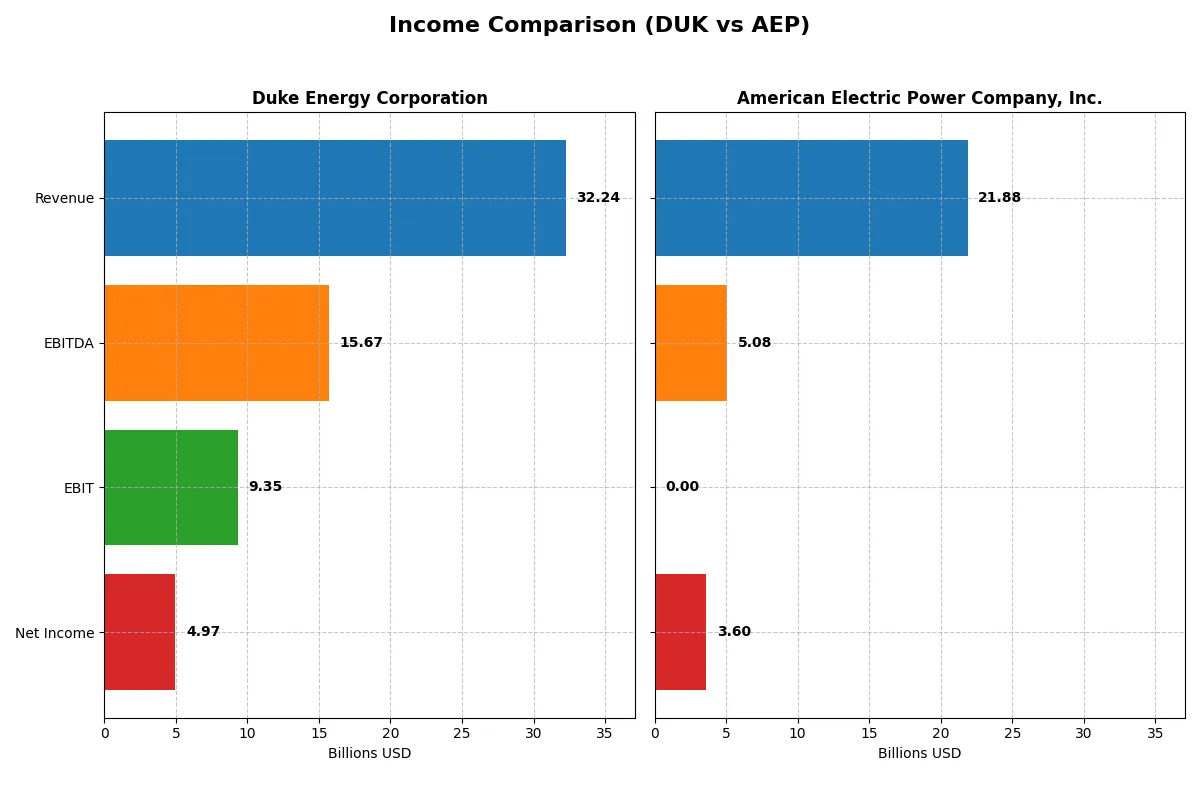
The following data dissects the core profitability and scalability of both corporate engines to reveal who dominates the bottom line:
| Metric | Duke Energy Corporation (DUK) | American Electric Power Company, Inc. (AEP) |
|---|---|---|
| Revenue | 32.2B | 21.9B |
| Cost of Revenue | 22.1B | 0 |
| Operating Expenses | 1.6B | 0 |
| Gross Profit | 10.2B | 0 |
| EBITDA | 15.7B | 5.1B |
| EBIT | 9.3B | 0 |
| Interest Expense | 3.6B | -2.0B |
| Net Income | 5.0B | 3.6B |
| EPS | 6.31 | 6.66 |
| Fiscal Year | 2025 | 2025 |
Income Statement Analysis: The Bottom-Line Duel
The following income statement comparison reveals the true efficiency and profitability trajectory of Duke Energy and American Electric Power’s corporate engines.
Duke Energy Corporation Analysis
Duke Energy’s revenue rose steadily, reaching $32.2B in 2025, with net income climbing to $4.97B, reflecting strong profit growth. Its gross margin slipped to 31.6%, but the net margin held firm at 15.4%, signaling effective cost controls and operational momentum despite rising interest expenses.
American Electric Power Company, Inc. Analysis
American Electric Power’s revenue expanded by nearly 10% to $21.9B in 2025, with net income growing to $3.60B. The absence of gross profit data clouds margin analysis, but a favorable net margin of 16.4% and a 19% EPS growth indicate solid bottom-line efficiency and improving shareholder returns.
Margin Power vs. Revenue Scale
Duke Energy outpaces AEP in total revenue and net income scale, with consistent margin strength despite higher interest costs. AEP’s sharper EPS growth and favorable net margin signal efficiency but on a smaller revenue base. Investors seeking scale and steady margins may prefer Duke; those valuing earnings growth could lean toward AEP’s profile.
Financial Ratios Comparison
These vital ratios act as a diagnostic tool to expose the underlying fiscal health, valuation premiums, and capital efficiency of the companies compared below:
| Ratios | Duke Energy Corporation (DUK) | American Electric Power Company, Inc. (AEP) |
|---|---|---|
| ROE | 9.58% | 11.55% |
| ROIC | 4.13% | -54.56% |
| P/E | 18.33 | 16.64 |
| P/B | 1.76 | 1.92 |
| Current Ratio | 0.55 | 0.00 |
| Quick Ratio | 0.33 | 0.00 |
| D/E | 1.75 | 0.14 |
| Debt-to-Assets | 46.42% | 0.00 |
| Interest Coverage | 2.36 | -2.63 |
| Asset Turnover | 0.16 | 0.00 |
| Fixed Asset Turnover | 0.25 | 0.00 |
| Payout ratio | 66.00% | 55.86% |
| Dividend yield | 3.60% | 3.36% |
| Fiscal Year | 2025 | 2025 |
Efficiency & Valuation Duel: The Vital Signs
Financial ratios serve as a company’s DNA, unveiling hidden risks and operational strengths that raw numbers alone cannot expose.
Duke Energy Corporation
Duke posts a solid net margin of 15.41% but a modest ROE of 9.58%, signaling moderate profitability. Its P/E of 18.33 suggests a fairly valued stock. The company supports shareholders with a 3.6% dividend yield, emphasizing steady income over aggressive growth or buybacks.
American Electric Power Company, Inc.
American Electric Power delivers a slightly higher net margin of 16.43% and a stronger ROE at 11.55%, indicating superior core profitability. The stock trades at a reasonable P/E of 16.64. It maintains a 3.36% dividend yield, balancing shareholder returns with a conservative capital structure marked by low debt.
Dividend Yield and Operational Efficiency Face-Off
While both firms show slightly unfavorable overall ratio profiles, American Electric Power’s higher ROE and lower leverage offer a more attractive risk-reward balance. Duke fits investors favoring consistent dividends and moderate valuation, whereas AEP suits those seeking operational efficiency with conservative debt levels.
Which one offers the Superior Shareholder Reward?
I observe Duke Energy (DUK) and American Electric Power (AEP) take contrasting distribution approaches in 2025. DUK yields 3.6% with a high payout ratio near 66%, signaling a strong dividend focus but limited free cash flow (FCF) coverage due to capex demands. AEP yields slightly less at 3.35%, but with a lower payout ratio of 56% and robust free cash flow coverage, it sustains dividends while aggressively buying back shares (reflected in a 0.25 capex per share vs. DUK’s zero reported capex per share). AEP’s buybacks enhance total shareholder return more sustainably. I judge AEP’s balanced dividend and buyback strategy offers a superior total return profile in 2026.
Comparative Score Analysis: The Strategic Profile
The radar chart reveals the fundamental DNA and trade-offs of Duke Energy Corporation and American Electric Power Company, Inc., highlighting their strategic financial profiles:
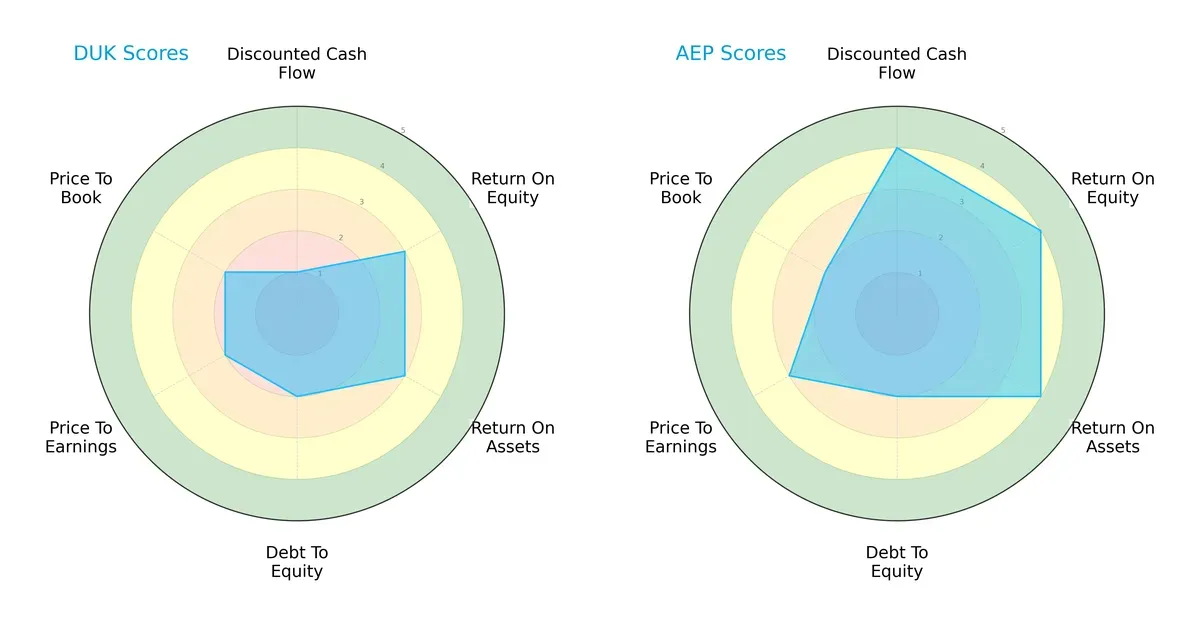
American Electric Power (AEP) demonstrates a more balanced and favorable profile, excelling in discounted cash flow (4 vs. 1), return on equity (4 vs. 3), and return on assets (4 vs. 3). Duke Energy (DUK) lags with weaker valuation metrics and debt management, sharing an unfavorable debt-to-equity score (2) with AEP but trailing in overall financial efficiency.
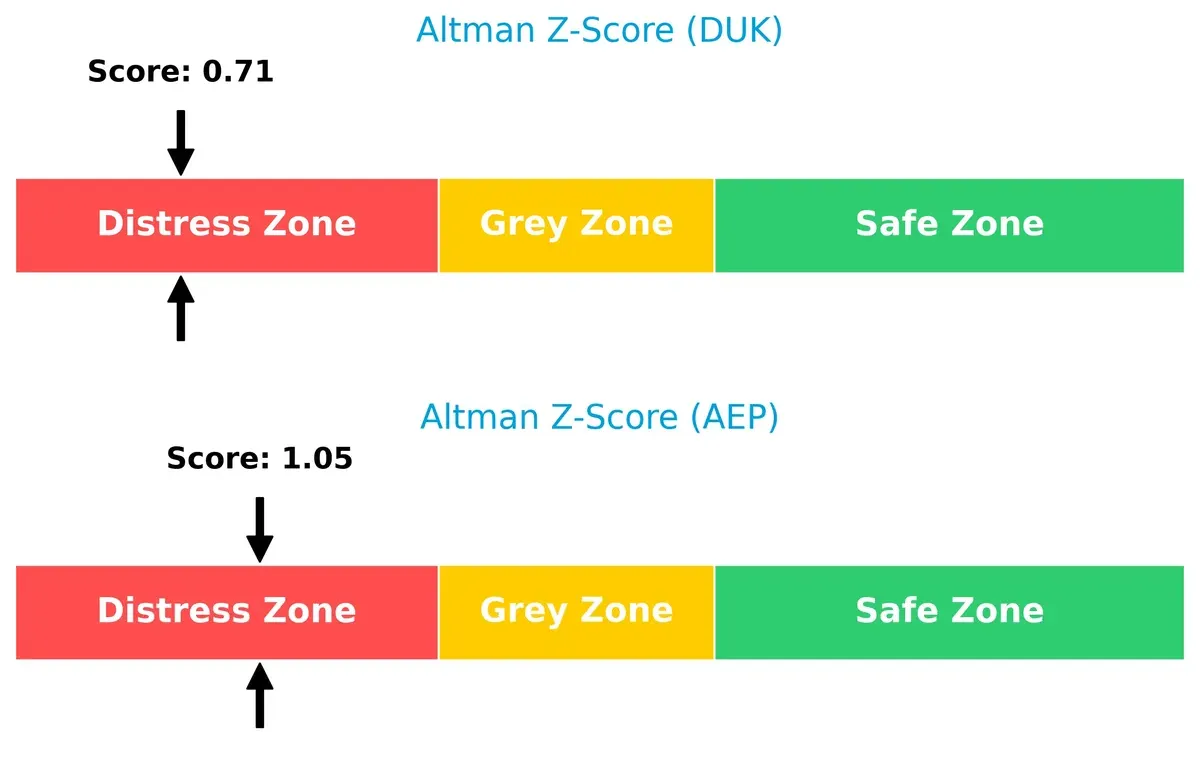
Bankruptcy Risk: Solvency Showdown
Duke Energy’s Altman Z-Score of 0.71 compared to AEP’s 1.05 signals deeper distress risks for both firms, with Duke in a more precarious position amid industry headwinds:
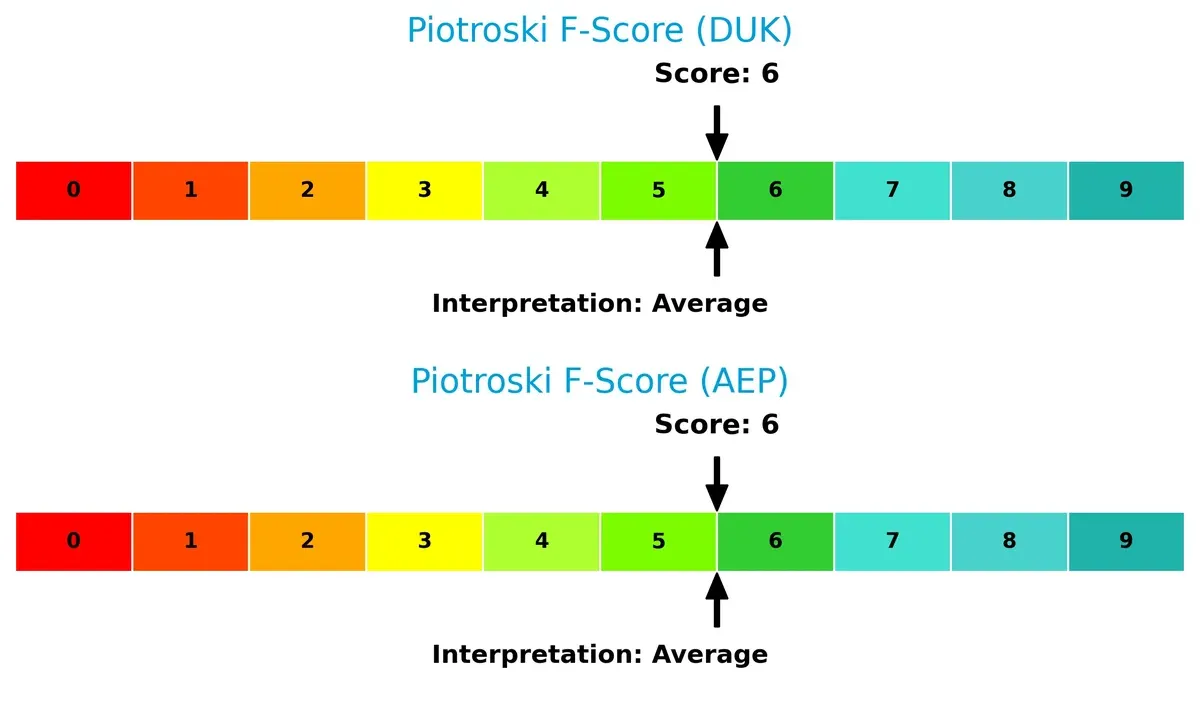
Financial Health: Quality of Operations
Both companies share an average Piotroski F-Score of 6, indicating moderate financial health without clear red flags, but also leaving room for improvement to reach peak operational quality:
How are the two companies positioned?
This section dissects Duke Energy and AEP’s operational DNA by comparing their revenue distribution and internal dynamics. The goal is to confront their economic moats and determine which model offers the most resilient, sustainable competitive advantage today.
Revenue Segmentation: The Strategic Mix
This visual comparison dissects how Duke Energy Corporation and American Electric Power diversify their income streams and where their primary sector bets lie:
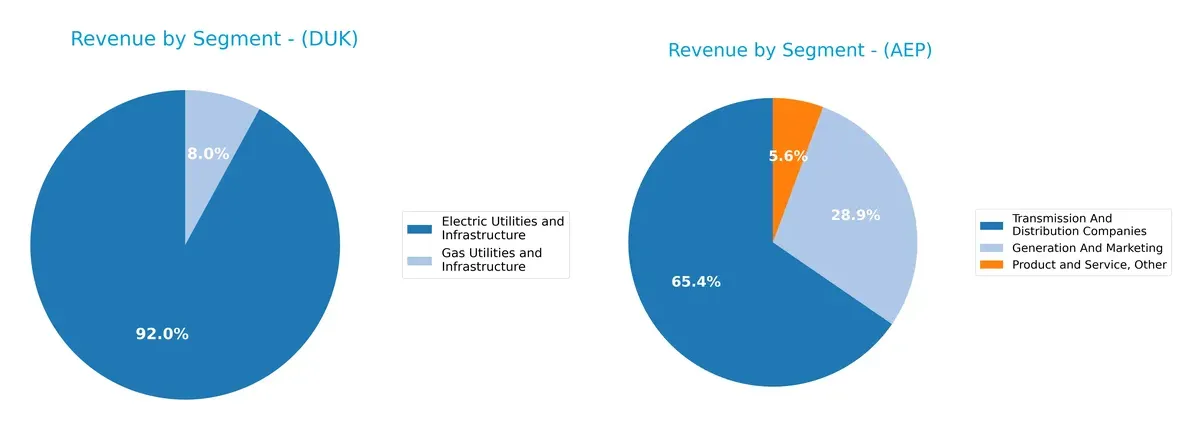
Duke Energy anchors revenue heavily in Electric Utilities and Infrastructure, generating $26.8B in 2024, with Gas Utilities adding $2.3B. This concentration signals strong infrastructure dominance but some exposure to sector shifts. American Electric Power shows a more diversified mix: Transmission and Distribution leads with $5.9B, complemented by Generation and Marketing at $1.9B, and smaller segments. AEP’s blend suggests balanced risk and ecosystem lock-in, while Duke’s focus hints at concentration risk.
Strengths and Weaknesses Comparison
This table compares the Strengths and Weaknesses of Duke Energy Corporation and American Electric Power Company, Inc.:
Duke Energy Corporation Strengths
- Higher net margin at 15.41%
- Favorable WACC at 4.77%
- Consistent dividend yield of 3.6%
- Diverse revenue streams from electric and gas utilities
- Strong U.S. market presence with $29B revenue
American Electric Power Company, Inc. Strengths
- Higher net margin at 16.43%
- Favorable WACC at 6.31%
- Low debt-to-equity ratio at 0.14
- Favorable debt-to-assets ratio at 0%
- Dividend yield of 3.36%
Duke Energy Corporation Weaknesses
- Unfavorable ROE at 9.58% and ROIC at 4.13%
- Low current and quick ratios indicating liquidity issues
- High debt-to-equity ratio at 1.75
- Unfavorable asset and fixed asset turnover ratios
- Slightly unfavorable overall ratio profile
American Electric Power Company, Inc. Weaknesses
- Negative ROIC at -54.56%
- Unfavorable current and quick ratios at 0
- Negative interest coverage ratio
- Zero asset and fixed asset turnover
- Slightly unfavorable overall ratio profile
Duke Energy shows strengths in diversification and stable dividend yield but faces liquidity and efficiency challenges. AEP benefits from low leverage and strong margins but struggles with capital returns and operational efficiency, signaling areas for strategic focus.
The Moat Duel: Analyzing Competitive Defensibility
A structural moat is the only thing protecting long-term profits from the relentless erosion of competition. Here’s how two regulated electric utilities stack up:
Duke Energy Corporation: Infrastructure Scale & Regulatory Favoritism
Duke’s primary moat stems from its vast regulated utility infrastructure and regulatory barriers. Its steady ROIC growth offsets current value destruction, reflecting margin stability. Expansion into renewables in 2026 could deepen its moat.
American Electric Power Company, Inc.: Legacy Network & Market Reach
AEP’s moat relies on its entrenched transmission network and vertically integrated operations, but its sharply declining ROIC signals weakening competitive efficiency. Opportunities in grid modernization may offer some relief in 2026.
Infrastructure Dominance vs. Network Entrenchment: Who Holds the Moat Edge?
Duke’s growing ROIC trend and broad service footprint give it a slightly wider moat than AEP, whose declining profitability erodes value. Duke is better positioned to defend its market share amid rising competition.
Which stock offers better returns?
Over the past year, Duke Energy and American Electric Power showed strong price appreciation with accelerating bullish trends and increasing buyer dominance in trading volumes.
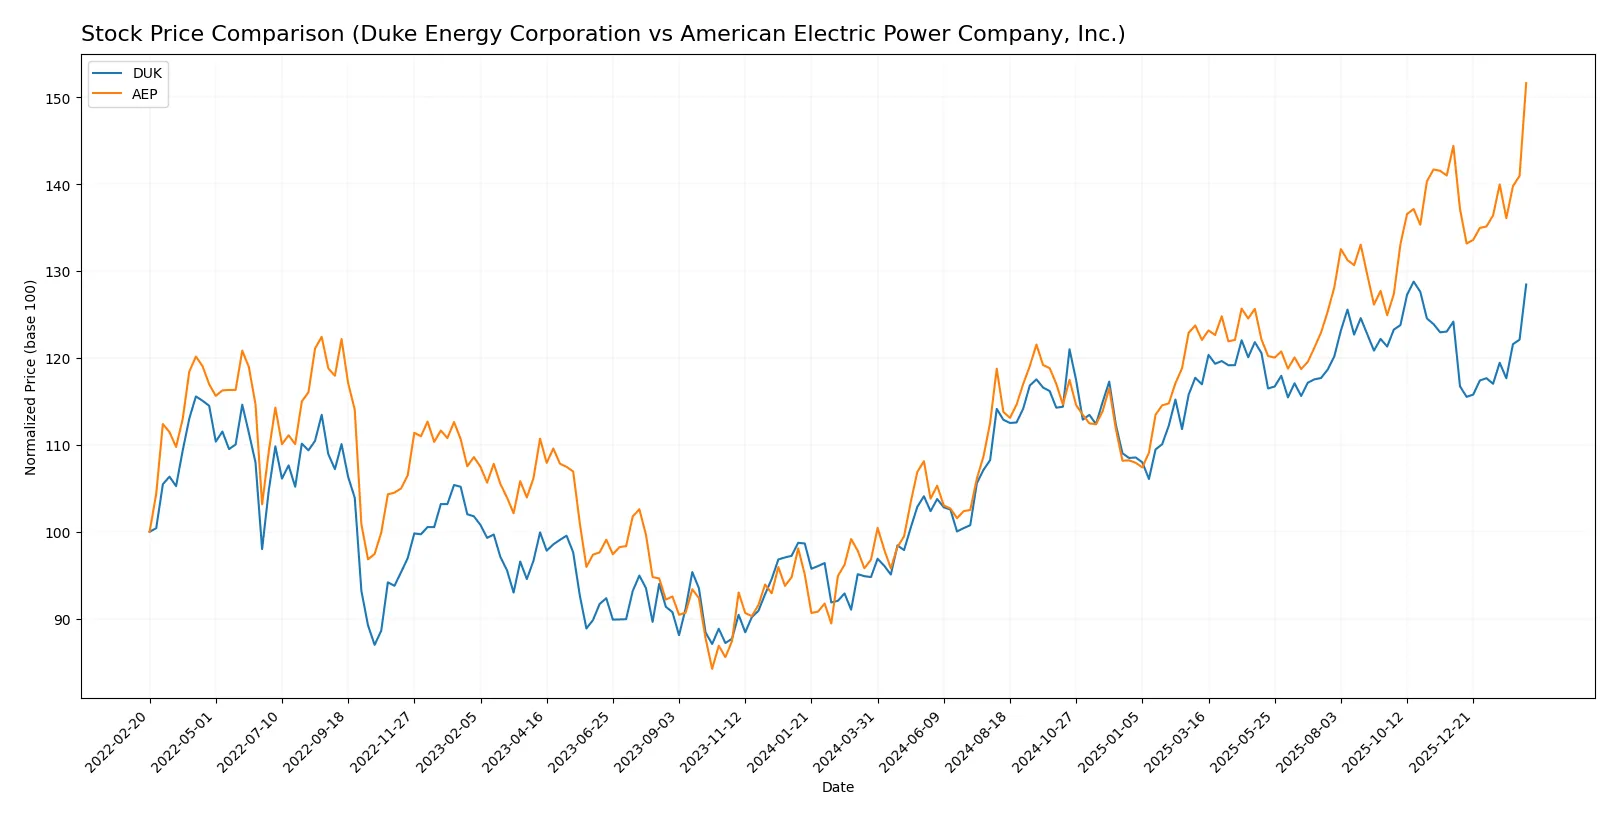
Trend Comparison
Duke Energy’s stock rose 35.5% over the past 12 months, exhibiting a bullish trend with accelerating momentum and moderate volatility (8.1% std deviation). The price ranged between 94.61 and 128.53.
American Electric Power’s stock advanced 56.65% in the same period, also bullish with acceleration. It experienced higher volatility (10.66% std deviation) and traded between 82.1 and 129.94.
American Electric Power outperformed Duke Energy with a larger price gain and stronger buyer dominance, delivering the highest market performance over the last year.
Target Prices
Analysts present a confident target price range for Duke Energy Corporation and American Electric Power Company, Inc.
| Company | Target Low | Target High | Consensus |
|---|---|---|---|
| Duke Energy Corporation | 115 | 143 | 132.64 |
| American Electric Power Company, Inc. | 107 | 142 | 130.17 |
Both utilities trade near their consensus targets, reflecting steady market confidence and aligned expectations with their regulated electric sector positioning.

Don’t Let Luck Decide Your Entry Point
Optimize your entry points with our advanced ProRealTime indicators. You’ll get efficient buy signals with precise price targets for maximum performance. Start outperforming now!
How do institutions grade them?
The following tables summarize recent institutional grades for Duke Energy Corporation and American Electric Power Company, Inc.:
Duke Energy Corporation Grades
This table lists recent grades from major institutions for Duke Energy Corporation.
| Grading Company | Action | New Grade | Date |
|---|---|---|---|
| Wells Fargo | Maintain | Equal Weight | 2026-01-20 |
| Barclays | Maintain | Overweight | 2026-01-15 |
| UBS | Maintain | Neutral | 2025-12-17 |
| JP Morgan | Maintain | Neutral | 2025-12-11 |
| Mizuho | Maintain | Outperform | 2025-10-27 |
| Morgan Stanley | Maintain | Equal Weight | 2025-10-22 |
| Barclays | Maintain | Overweight | 2025-10-14 |
| BMO Capital | Maintain | Outperform | 2025-10-10 |
| UBS | Maintain | Neutral | 2025-10-10 |
| Scotiabank | Upgrade | Sector Outperform | 2025-10-03 |
American Electric Power Company, Inc. Grades
This table presents recent institutional ratings for American Electric Power Company, Inc.
| Grading Company | Action | New Grade | Date |
|---|---|---|---|
| Wells Fargo | Maintain | Overweight | 2026-02-13 |
| Wolfe Research | Upgrade | Outperform | 2026-02-13 |
| Mizuho | Maintain | Neutral | 2026-02-13 |
| Barclays | Maintain | Equal Weight | 2026-01-22 |
| Wells Fargo | Maintain | Overweight | 2026-01-20 |
| B of A Securities | Downgrade | Neutral | 2026-01-12 |
| UBS | Maintain | Sell | 2025-12-17 |
| JP Morgan | Maintain | Neutral | 2025-12-12 |
| Jefferies | Upgrade | Buy | 2025-11-17 |
| Citigroup | Maintain | Neutral | 2025-10-31 |
Which company has the best grades?
American Electric Power Company, Inc. shows a wider range of ratings, including upgrades to Outperform and Buy, but also a Sell rating from UBS. Duke Energy Corporation’s ratings cluster around Neutral to Outperform with consistent maintenance. Investors may view AEP’s grades as more volatile but potentially higher reward, while DUK offers steadier, consensus-driven sentiment.
Risks specific to each company
The following categories identify the critical pressure points and systemic threats facing both firms in the 2026 market environment:
1. Market & Competition
Duke Energy Corporation
- Operates in a highly regulated, competitive electric utility sector with a diverse fuel mix. Faces pressure from renewables and distributed generation trends.
American Electric Power Company, Inc.
- Competes in a similar regulated electric utility market with emphasis on vertically integrated utilities and transmission; also challenged by energy transition demands.
2. Capital Structure & Debt
Duke Energy Corporation
- High debt-to-equity ratio (1.75) signals elevated financial leverage and potential risk in rising rate environments.
American Electric Power Company, Inc.
- Very low debt-to-equity ratio (0.14) indicates conservative leverage, strengthening balance sheet resilience.
3. Stock Volatility
Duke Energy Corporation
- Beta of 0.51 shows lower volatility than the market, appealing to risk-averse investors.
American Electric Power Company, Inc.
- Slightly higher beta at 0.61 reflects moderate sensitivity to market swings but remains below market average.
4. Regulatory & Legal
Duke Energy Corporation
- Subject to regulatory risks in multiple states, with exposure to changing environmental policies.
American Electric Power Company, Inc.
- Faces regulatory challenges across diverse jurisdictions; legal risks tied to energy market reforms and environmental compliance.
5. Supply Chain & Operations
Duke Energy Corporation
- Operates complex infrastructure with coal, nuclear, renewables; supply chain disruptions could affect fuel availability.
American Electric Power Company, Inc.
- Relies on coal, natural gas, nuclear, hydro, and renewables; operational risks from fuel sourcing and transmission infrastructure.
6. ESG & Climate Transition
Duke Energy Corporation
- Transitioning with renewables but still dependent on fossil fuels; ESG pressures may raise compliance costs.
American Electric Power Company, Inc.
- Facing significant ESG scrutiny due to fossil fuel reliance; must accelerate clean energy investments to mitigate transition risk.
7. Geopolitical Exposure
Duke Energy Corporation
- Primarily U.S.-focused, limiting direct geopolitical risk but vulnerable to domestic policy shifts.
American Electric Power Company, Inc.
- Also U.S.-centric with minimal international exposure; geopolitical risks mainly stem from national energy policy changes.
Which company shows a better risk-adjusted profile?
American Electric Power faces its most impactful risk in regulatory and ESG transition challenges, reflecting the sector’s shift to cleaner energy. Duke Energy’s largest risk stems from its high financial leverage, which amplifies vulnerability to interest rate hikes. Despite both having “slightly unfavorable” financial ratios, AEP’s stronger balance sheet and better credit metrics provide a more resilient risk-adjusted profile. Recent data shows Duke’s debt-to-equity at 1.75 versus AEP’s 0.14, justifying concern about Duke’s capital structure under tightening financial conditions.
Final Verdict: Which stock to choose?
Duke Energy’s superpower lies in its improving profitability amid a challenging capital structure. It steadily grows returns despite shedding overall value, signaling operational resilience. The low liquidity ratios remain a point of vigilance. Its profile suits investors focused on steady income with a tolerance for balance sheet risks.
American Electric Power commands a strategic moat through disciplined debt management and solid net margins. Its relatively lower leverage offers better financial stability compared to Duke. Despite a declining ROIC trend, AEP fits well in portfolios seeking Growth at a Reasonable Price with a preference for balance sheet strength.
If you prioritize operational efficiency and growing profitability under pressure, Duke Energy outshines due to its improving returns and dividend yield. However, if you seek better financial stability and a cleaner balance sheet, American Electric Power offers superior safety and steady growth potential. Both carry risks, so alignment with your risk tolerance and investment horizon is key.
Disclaimer: Investment carries a risk of loss of initial capital. The past performance is not a reliable indicator of future results. Be sure to understand risks before making an investment decision.
Go Further
I encourage you to read the complete analyses of Duke Energy Corporation and American Electric Power Company, Inc. to enhance your investment decisions: