American Electric Power Company, Inc. (AEP) and DTE Energy Company (DTE) are two prominent players in the regulated electric utility sector, each serving large U.S. markets with diverse energy portfolios. Both companies emphasize innovation through renewable integration and infrastructure modernization, aiming to meet evolving energy demands sustainably. This comparison explores their strategic strengths and market positions to help you, the investor, decide which utility stock could best enhance your portfolio.
Table of contents
Companies Overview
I will begin the comparison between American Electric Power Company, Inc. (AEP) and DTE Energy Company (DTE) by providing an overview of these two companies and their main differences.
American Electric Power Company, Inc. Overview
American Electric Power Company, Inc. is a leading electric public utility holding company focused on generating, transmitting, and distributing electricity to retail and wholesale customers across the US. Operating through multiple segments, AEP utilizes diverse energy sources including coal, natural gas, nuclear, hydro, solar, and wind. Founded in 1906 and headquartered in Columbus, Ohio, it holds a market cap of $62.6B and employs around 16,330 people.
DTE Energy Company Overview
DTE Energy Company operates utility services primarily in southeastern Michigan, serving roughly 2.3M electricity customers and 1.3M natural gas customers. Its operations include power generation from fossil fuels, nuclear, hydro, and renewables, along with extensive gas distribution infrastructure. Founded in 1903 and based in Detroit, Michigan, DTE has a market cap of $27.0B and employs approximately 4,750 people.
Key similarities and differences
Both AEP and DTE belong to the regulated electric utilities sector, generating electricity using a mix of fossil fuels and renewables. AEP has a broader national footprint and larger scale, with vertically integrated utilities and transmission operations, while DTE focuses more regionally with significant gas distribution and energy trading segments. AEP’s market cap is more than double that of DTE, reflecting its wider operational scope and employee base.
Income Statement Comparison
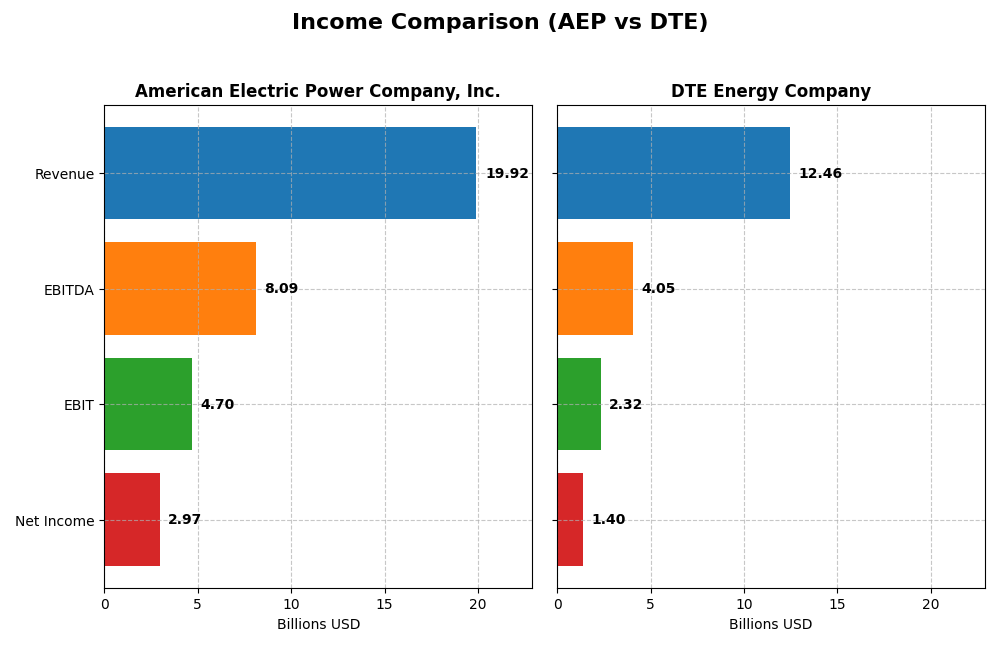
This table presents a side-by-side comparison of key income statement metrics for American Electric Power Company, Inc. (AEP) and DTE Energy Company (DTE) for the fiscal year 2024.
| Metric | American Electric Power Company, Inc. (AEP) | DTE Energy Company (DTE) |
|---|---|---|
| Market Cap | 62.6B | 27.0B |
| Revenue | 19.9B | 12.5B |
| EBITDA | 8.1B | 4.1B |
| EBIT | 4.7B | 2.3B |
| Net Income | 3.0B | 1.4B |
| EPS | 5.60 | 6.78 |
| Fiscal Year | 2024 | 2024 |
Income Statement Interpretations
American Electric Power Company, Inc.
American Electric Power (AEP) demonstrated solid revenue growth of 33.6% over 2020-2024, reaching $19.9B in 2024. Net income increased by 34.9%, supported by favorable gross margin (31.9%) and EBIT margin (23.6%) stability. Despite a slight slowdown in revenue growth last year (2.8%), profitability improved significantly, with net margin rising 30.8% and EPS up 31.6%.
DTE Energy Company
DTE Energy’s revenue grew modestly by 9.1% from 2020 to 2024, totaling $12.5B in 2024, with net income showing a minor 2.4% increase. Margins remained generally stable with a gross margin of 34.8% and EBIT margin of 18.6%. However, the recent year saw a revenue decline of 2.3%, declining EBIT, and neutral EPS growth, reflecting some operational challenges.
Which one has the stronger fundamentals?
AEP’s income statement displays stronger fundamentals, with a predominantly favorable income statement evaluation and notable growth in revenue, net income, and margins. Conversely, DTE’s evaluation is less favorable, marked by recent revenue contraction and declining net margin and EPS over the period. AEP’s more robust profitability and growth metrics highlight its comparative financial strength.
Financial Ratios Comparison
This table summarizes the key financial ratios for American Electric Power Company, Inc. (AEP) and DTE Energy Company (DTE) based on their most recent fiscal year 2024 data.
| Ratios | American Electric Power Company, Inc. (AEP) | DTE Energy Company (DTE) |
|---|---|---|
| ROE | 11.0% | 12.0% |
| ROIC | 5.0% | 4.6% |
| P/E | 16.5 | 17.8 |
| P/B | 1.81 | 2.14 |
| Current Ratio | 0.44 | 0.71 |
| Quick Ratio | 0.31 | 0.46 |
| D/E (Debt-to-Equity) | 1.70 | 1.99 |
| Debt-to-Assets | 44.4% | 47.6% |
| Interest Coverage | 2.56 | 2.20 |
| Asset Turnover | 0.19 | 0.26 |
| Fixed Asset Turnover | 0.24 | 0.40 |
| Payout Ratio | 64.2% | 57.7% |
| Dividend Yield | 3.89% | 3.24% |
Interpretation of the Ratios
American Electric Power Company, Inc.
American Electric Power shows a mixed ratio profile with a favorable net margin of 14.9% and a reasonable dividend yield of 3.89%. However, concerns arise from its low current and quick ratios (0.44 and 0.31), high debt-to-equity ratio (1.7), and weak asset turnover metrics. The dividend appears covered but the leverage and liquidity ratios warrant caution.
DTE Energy Company
DTE Energy presents similarly mixed ratios, including a favorable net margin of 11.27% and a dividend yield of 3.24%. It has better liquidity than AEP with a current ratio of 0.71, though still below 1, and a slightly higher debt-to-equity ratio at 1.99. Asset turnover ratios are also weak, raising concerns about operational efficiency despite stable shareholder returns.
Which one has the best ratios?
Both companies face challenges with liquidity and leverage, each having a slightly unfavorable overall ratio profile. AEP benefits from a higher dividend yield and better net margin, while DTE holds a stronger current ratio but higher debt leverage. Their neutral to unfavorable operational ratios suggest investors should carefully weigh the risks associated with each utility’s financial structure.
Strategic Positioning
This section compares the strategic positioning of American Electric Power Company, Inc. (AEP) and DTE Energy Company (DTE) in terms of market position, key segments, and exposure to technological disruption:
American Electric Power Company, Inc. (AEP)
- Large market cap of 62.6B with moderate beta of 0.615; operates in regulated electric utilities facing competitive pressures.
- Diverse revenue streams from Generation & Marketing, Transmission & Distribution, and Vertically Integrated Utilities segments.
- Generates electricity using coal, natural gas, nuclear, hydro, solar, wind; moderate exposure to energy transition technologies.
DTE Energy Company (DTE)
- Mid-sized market cap of 27B with lower beta of 0.484; operates in regulated electric utilities under competitive market conditions.
- Revenue diversified across Electric, Gas, Energy Trading, and DTE Vantage segments serving residential and industrial customers.
- Uses fossil fuels, hydroelectric, nuclear, wind, and renewables; exposure to energy trading and industrial projects increases disruption risks.
AEP vs DTE Positioning
AEP exhibits a more diversified business model with multiple utility and generation segments, while DTE focuses on electric, gas, and energy trading segments. AEP’s larger scale contrasts with DTE’s concentrated regional customer base. Both face similar technological transformation pressures.
Which has the best competitive advantage?
Both companies show slightly unfavorable MOAT evaluations with ROIC below WACC, indicating value destruction but growing profitability. Neither has a clear competitive advantage based strictly on MOAT data from 2020-2024.
Stock Comparison
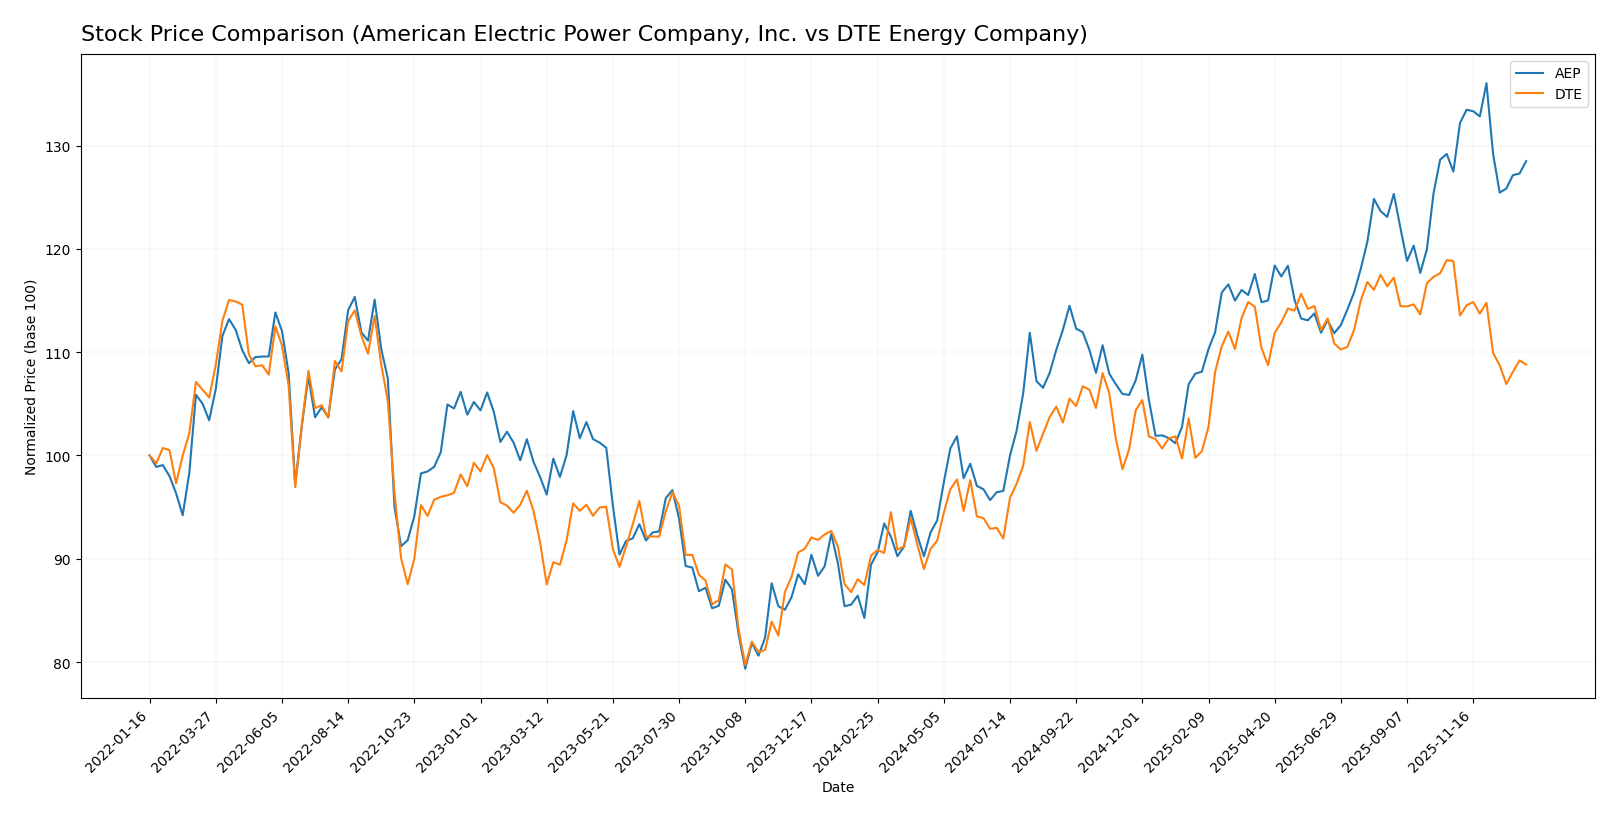
The stock prices of American Electric Power Company, Inc. (AEP) and DTE Energy Company (DTE) have shown significant bullish trends over the past 12 months, with notable deceleration in growth and contrasting recent trading dynamics.
Trend Analysis
American Electric Power Company, Inc. (AEP) experienced a 43.71% price increase over the past year, indicating a bullish trend with decelerating momentum. The stock traded between 81.35 and 123.77, showing moderate volatility (std deviation 10.6). Recent weeks reveal a near-neutral shift with a 0.8% rise but slight downward slope.
DTE Energy Company (DTE) gained 20.49% over the same period, also bullish but with deceleration. The price ranged from 106.25 to 141.95, with a similar volatility level (std deviation 10.2). The recent trend shows a negative 8.42% decline and seller dominance, signaling short-term weakness.
Comparing both stocks, AEP delivered the highest market performance over the last year with a 43.71% gain, outperforming DTE’s 20.49% increase despite recent slowdown.
Target Prices
Analysts present a positive target price consensus for both American Electric Power Company, Inc. and DTE Energy Company.
| Company | Target High | Target Low | Consensus |
|---|---|---|---|
| American Electric Power Company, Inc. | 138 | 107 | 126.82 |
| DTE Energy Company | 157 | 138 | 148.29 |
The consensus target prices suggest upside potential compared to current prices of $116.91 for AEP and $129.89 for DTE, indicating moderate to strong analyst confidence in future gains.
Analyst Opinions Comparison
This section compares analysts’ ratings and grades for American Electric Power Company, Inc. (AEP) and DTE Energy Company (DTE):
Rating Comparison
AEP Rating
- Rated B+ with a very favorable overall evaluation.
- Discounted Cash Flow score of 4 indicates favorable valuation based on future cash flows.
- Return on Equity score of 4 shows strong profit generation from equity.
- Return on Assets score of 4 suggests efficient asset utilization.
- Debt to Equity score of 2 signals moderate financial risk and balance sheet strength.
- Overall score of 3 represents a moderate financial standing.
DTE Rating
- Rated C with a very favorable overall evaluation.
- Discounted Cash Flow score of 1 indicates a very unfavorable valuation.
- Return on Equity score of 3 reflects moderate profit generation from equity.
- Return on Assets score of 2 indicates moderate asset utilization.
- Debt to Equity score of 1 reflects very unfavorable financial risk.
- Overall score of 2 represents a moderate financial standing.
Which one is the best rated?
Based strictly on the provided data, AEP is better rated than DTE. AEP has higher scores in discounted cash flow, ROE, ROA, and a higher overall rating, indicating stronger financial metrics and valuation.
Scores Comparison
The following table compares the Altman Z-Score and Piotroski Score for American Electric Power Company, Inc. (AEP) and DTE Energy Company (DTE):
AEP Scores
- Altman Z-Score: 0.998, indicating financial distress risk.
- Piotroski Score: 6, reflecting average financial strength.
DTE Scores
- Altman Z-Score: 1.033, indicating financial distress risk.
- Piotroski Score: 7, reflecting strong financial strength.
Which company has the best scores?
Based on the provided scores, DTE has a slightly higher Altman Z-Score, though both are in the distress zone. DTE’s Piotroski Score is stronger at 7 compared to AEP’s 6, indicating better financial strength.
Grades Comparison
Here is a comparison of the recent grades assigned to American Electric Power Company, Inc. and DTE Energy Company by major grading firms:
American Electric Power Company, Inc. Grades
This table summarizes the latest grades from reputable financial institutions for American Electric Power Company, Inc.:
| Grading Company | Action | New Grade | Date |
|---|---|---|---|
| UBS | Maintain | Sell | 2025-12-17 |
| JP Morgan | Maintain | Neutral | 2025-12-12 |
| Jefferies | Upgrade | Buy | 2025-11-17 |
| Citigroup | Maintain | Neutral | 2025-10-31 |
| Wells Fargo | Maintain | Overweight | 2025-10-30 |
| Evercore ISI Group | Maintain | Outperform | 2025-10-30 |
| Morgan Stanley | Maintain | Overweight | 2025-10-30 |
| Mizuho | Maintain | Neutral | 2025-10-30 |
| BMO Capital | Downgrade | Market Perform | 2025-10-30 |
| Scotiabank | Maintain | Sector Perform | 2025-10-30 |
Overall, American Electric Power shows a mixed rating pattern, ranging from Sell to Outperform, with most grades clustered around Neutral to Overweight.
DTE Energy Company Grades
This table displays the most recent grades from recognized financial firms for DTE Energy Company:
| Grading Company | Action | New Grade | Date |
|---|---|---|---|
| BMO Capital | Maintain | Market Perform | 2025-12-24 |
| UBS | Maintain | Buy | 2025-12-17 |
| JP Morgan | Maintain | Neutral | 2025-12-11 |
| Jefferies | Upgrade | Buy | 2025-12-11 |
| B of A Securities | Maintain | Buy | 2025-11-05 |
| Scotiabank | Maintain | Sector Perform | 2025-10-31 |
| Morgan Stanley | Maintain | Overweight | 2025-10-22 |
| Barclays | Maintain | Equal Weight | 2025-10-14 |
| UBS | Maintain | Buy | 2025-10-10 |
| Scotiabank | Downgrade | Sector Perform | 2025-10-03 |
DTE Energy’s grades predominantly range from Hold/Neutral to Buy and Overweight, with a recent downgrade from Sector Outperform to Sector Perform.
Which company has the best grades?
American Electric Power Company, Inc. holds a consensus “Buy” with 19 buys and 14 holds, whereas DTE Energy Company has a consensus “Hold” with 20 buys and 25 holds. AEP’s stronger buy consensus may indicate a more favorable outlook, potentially attracting investors seeking growth, while DTE’s more cautious hold consensus reflects a balanced risk-return profile.
Strengths and Weaknesses
Below is a comparison table highlighting the strengths and weaknesses of American Electric Power Company, Inc. (AEP) and DTE Energy Company (DTE) based on recent financial and operational data.
| Criterion | American Electric Power Company, Inc. (AEP) | DTE Energy Company (DTE) |
|---|---|---|
| Diversification | Moderate diversification with focus on Transmission and Distribution (5.88B USD in 2024) and Generation and Marketing (1.94B USD) | Well diversified across Electric (5.82B USD), Gas (1.75B USD), and Energy Trading (4.61B USD) segments |
| Profitability | Net margin 14.9% (favorable), ROIC 4.96% (unfavorable), ROE 11.01% (neutral) | Net margin 11.27% (favorable), ROIC 4.65% (unfavorable), ROE 12.0% (neutral) |
| Innovation | Limited data on innovation; steady growth in ROIC (+28%) but still value destroying | Growing ROIC (+34%) suggesting improving operational efficiency despite value destruction |
| Global presence | Primarily U.S.-focused utility operations, limited global exposure | Mainly U.S. operations, with significant energy trading activities that may have wider reach |
| Market Share | Large market share in utility transmission and distribution | Strong presence in electric and gas markets with significant trading operations |
Key takeaways: Both AEP and DTE show strengths in diversified utility operations and solid net margins. However, both companies currently destroy value as ROIC remains below WACC, albeit with improving profitability trends. Investors should weigh steady income from dividends against the cautious outlook on value creation.
Risk Analysis
The table below summarizes key risks for American Electric Power Company, Inc. (AEP) and DTE Energy Company (DTE) as of 2024, helping investors understand their risk exposures.
| Metric | American Electric Power Company, Inc. (AEP) | DTE Energy Company (DTE) |
|---|---|---|
| Market Risk | Moderate beta (0.615) indicating lower volatility vs. market | Low beta (0.484), relatively stable market sensitivity |
| Debt Level | High debt-to-equity ratio (1.7), moderate interest coverage | Higher debt-to-equity ratio (1.99), moderate interest coverage |
| Regulatory Risk | Significant due to heavy regulation in utilities sector | Similarly high regulatory exposure in Michigan utility market |
| Operational Risk | Exposure to multiple energy sources; asset turnover low | Diverse operations, including gas and power trading; asset turnover low |
| Environmental Risk | Coal and fossil fuel reliance pose transition risks | Fossil fuels and nuclear generation, with ongoing renewables integration |
| Geopolitical Risk | Low, primarily US-focused operations | Low, US domestic operations centered in Michigan |
The most impactful risks for both companies are their high debt levels and regulatory exposure, as utilities face evolving environmental regulations and market shifts toward renewables. Both AEP and DTE are in financial distress zones per Altman Z-scores, signaling caution. Their operational risks are tempered by diversification, but environmental transition poses a growing challenge.
Which Stock to Choose?
American Electric Power Company, Inc. (AEP) shows a favorable income statement with strong net and EBIT margins, positive growth in earnings per share, and a slightly unfavorable financial ratios profile marked by low liquidity and high debt levels. Its rating is very favorable (B+), though its Altman Z-Score indicates financial distress.
DTE Energy Company (DTE) has a less favorable income statement with declining revenue and EPS growth, combined with a similar slightly unfavorable financial ratios profile including moderate liquidity and high debt. Its rating is very favorable (C), with a slightly better Piotroski Score but also a distress zone Altman Z-Score.
For investors, AEP might appear more suitable for those prioritizing growth and profitability given its stronger income performance and rating, while DTE could be considered by those focusing on financial strength and stability despite mixed income trends. Both companies exhibit signs of value destruction but with improving profitability, implying a cautious approach.
Disclaimer: Investment carries a risk of loss of initial capital. The past performance is not a reliable indicator of future results. Be sure to understand risks before making an investment decision.
Go Further
I encourage you to read the complete analyses of American Electric Power Company, Inc. and DTE Energy Company to enhance your investment decisions: