In the evolving landscape of the regulated electric utility sector, American Electric Power Company, Inc. (AEP) and Consolidated Edison, Inc. (ED) stand out as prominent players. Both companies operate extensive electricity networks and invest in renewable energy, serving millions of customers across key U.S. regions. Their innovation strategies and market footprints overlap significantly, making them natural comparables. This article will help you determine which company offers the most compelling investment opportunity in 2026.
Table of contents
Companies Overview
I will begin the comparison between American Electric Power Company, Inc. and Consolidated Edison, Inc. by providing an overview of these two companies and their main differences.
American Electric Power Company, Inc. Overview
American Electric Power Company, Inc. is a leading electric public utility holding company focused on the generation, transmission, and distribution of electricity across the United States. It operates through several business segments, including Vertically Integrated Utilities and Transmission & Distribution Utilities. The company utilizes a diverse energy mix, including coal, natural gas, nuclear, hydro, solar, and wind, aiming to supply electricity to both retail and wholesale customers.
Consolidated Edison, Inc. Overview
Consolidated Edison, Inc. operates primarily in regulated electric, gas, and steam delivery businesses serving around 3.5M electric customers in New York City and Westchester County. It also provides gas and steam services to millions of customers in the region, maintaining extensive infrastructure such as transmission lines, substations, and distribution networks. The company invests in renewable energy projects and energy infrastructure while serving industrial, commercial, residential, and government clients.
Key similarities and differences
Both companies operate within the regulated electric utility sector in the US, focusing on electricity delivery and infrastructure management. While AEP has a broader national footprint and a diversified generation portfolio including renewables, ED concentrates on electric, gas, and steam services primarily in the New York metropolitan area. AEP’s business is vertically integrated with generation and marketing, whereas ED places more emphasis on distribution and transmission alongside energy-related services.
Income Statement Comparison
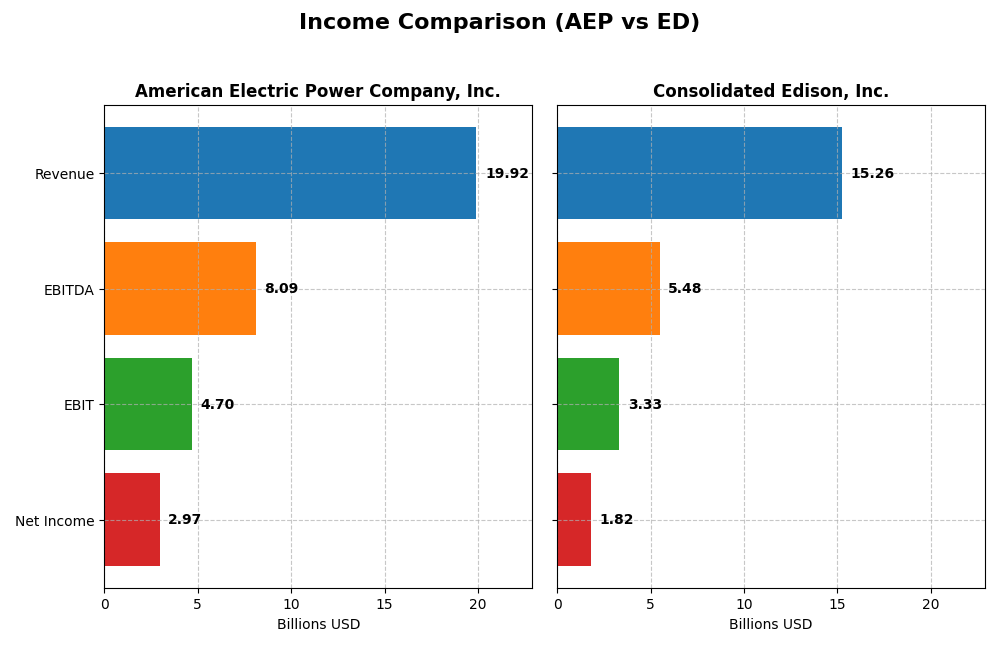
This table presents a side-by-side comparison of key income statement metrics for American Electric Power Company, Inc. (AEP) and Consolidated Edison, Inc. (ED) for the fiscal year 2024.
| Metric | American Electric Power Company, Inc. (AEP) | Consolidated Edison, Inc. (ED) |
|---|---|---|
| Market Cap | 62.6B | 35.8B |
| Revenue | 19.9B | 15.3B |
| EBITDA | 8.1B | 5.5B |
| EBIT | 4.7B | 3.3B |
| Net Income | 3.0B | 1.8B |
| EPS | 5.60 | 5.26 |
| Fiscal Year | 2024 | 2024 |
Income Statement Interpretations
American Electric Power Company, Inc.
American Electric Power has shown consistent revenue growth from 2020 to 2024, reaching $19.9B in 2024. Net income increased steadily, with a notable rise to $2.97B in 2024. Margins remain stable and favorable, with gross margin at 31.9% and net margin at 14.9%. The recent year saw slower revenue growth but improvements in gross profit and net margin, suggesting enhanced operational efficiency.
Consolidated Edison, Inc.
Consolidated Edison’s revenue rose moderately to $15.3B in 2024, with net income reaching $1.82B. Gross margin is high at 64.0%, though net margin is lower than AEP at 11.9%. Recent performance showed neutral revenue growth but declines in EBIT, net margin, and EPS, indicating some pressure on profitability despite overall positive long-term growth in net income and margins.
Which one has the stronger fundamentals?
American Electric Power demonstrates stronger fundamentals with higher net margin and more consistent improvements in profitability metrics, including EPS growth. Consolidated Edison, while enjoying a superior gross margin and strong net income growth over the period, faces recent unfavorable trends in EBIT and net margin. Both have favorable income statements overall, but AEP’s recent margin stability and profit growth provide a more balanced financial profile.
Financial Ratios Comparison
The table below presents the key financial ratios for American Electric Power Company, Inc. (AEP) and Consolidated Edison, Inc. (ED) for the fiscal year 2024, enabling a direct comparison of their financial performance and stability.
| Ratios | American Electric Power Company, Inc. (AEP) | Consolidated Edison, Inc. (ED) |
|---|---|---|
| ROE | 11.0% | 8.3% |
| ROIC | 5.0% | 3.5% |
| P/E | 16.5 | 17.0 |
| P/B | 1.81 | 1.41 |
| Current Ratio | 0.44 | 1.04 |
| Quick Ratio | 0.31 | 0.96 |
| D/E | 1.70 | 1.27 |
| Debt-to-Assets | 44.4% | 39.4% |
| Interest Coverage | 2.56 | 2.30 |
| Asset Turnover | 0.19 | 0.22 |
| Fixed Asset Turnover | 0.24 | 0.29 |
| Payout ratio | 64.2% | 60.4% |
| Dividend yield | 3.9% | 3.6% |
Interpretation of the Ratios
American Electric Power Company, Inc.
American Electric Power (AEP) shows a mixed ratio profile, with a favorable net margin of 14.9% but an unfavorable return on invested capital of 4.96% and weak liquidity indicated by a current ratio of 0.44. Its debt-to-equity ratio of 1.7 and low asset turnover ratios also raise concerns. The dividend yield of 3.89% is favorable, supported by a stable payout, though coverage by free cash flow appears strained, suggesting caution.
Consolidated Edison, Inc.
Consolidated Edison (ED) presents generally better liquidity with a current ratio near 1.04, though its return on equity at 8.29% and return on invested capital of 3.48% are unfavorable. The price-to-book ratio of 1.41 is favorable, reflecting modest valuation. ED pays a dividend yielding 3.56%, which is sustainable given its balance sheet, but some leverage ratios remain a concern, and operating efficiency ratios are weak.
Which one has the best ratios?
Both companies are evaluated as slightly unfavorable overall, yet ED has a higher proportion of favorable ratios (28.57%) compared to AEP’s 21.43%. ED benefits from stronger liquidity and valuation metrics, while AEP has a better net margin and dividend yield. However, both face challenges in returns and asset efficiency, leaving neither distinctly superior in financial ratios.
Strategic Positioning
This section compares the strategic positioning of American Electric Power Company, Inc. (AEP) and Consolidated Edison, Inc. (ED) including market position, key segments, and exposure to disruption:
American Electric Power Company, Inc. (AEP)
- Large market cap of 62.6B USD with moderate beta, facing regulated electric industry competition.
- Diverse revenue from generation, transmission, distribution, and marketing segments.
- Uses multiple energy sources including coal, natural gas, nuclear, hydro, solar, and wind.
Consolidated Edison, Inc. (ED)
- Smaller market cap of 35.8B USD, lower beta, operating in regulated electric and gas delivery.
- Revenue concentrated in electricity, oil and gas purchasing, steam, and non-utility services.
- Invests in energy infrastructure and renewables but focused on regulated delivery services.
American Electric Power Company, Inc. vs Consolidated Edison, Inc. Positioning
AEP’s strategy is more diversified across generation and transmission, leveraging multiple energy sources, while ED concentrates on regulated electric, gas, and steam delivery with infrastructure investments. AEP’s broader scope offers varied revenue streams, ED focuses on dense urban markets.
Which has the best competitive advantage?
Both companies are shedding value as ROIC is below WACC; however, AEP shows a growing ROIC trend, indicating improving profitability, whereas ED’s ROIC is declining, suggesting a weaker competitive advantage.
Stock Comparison
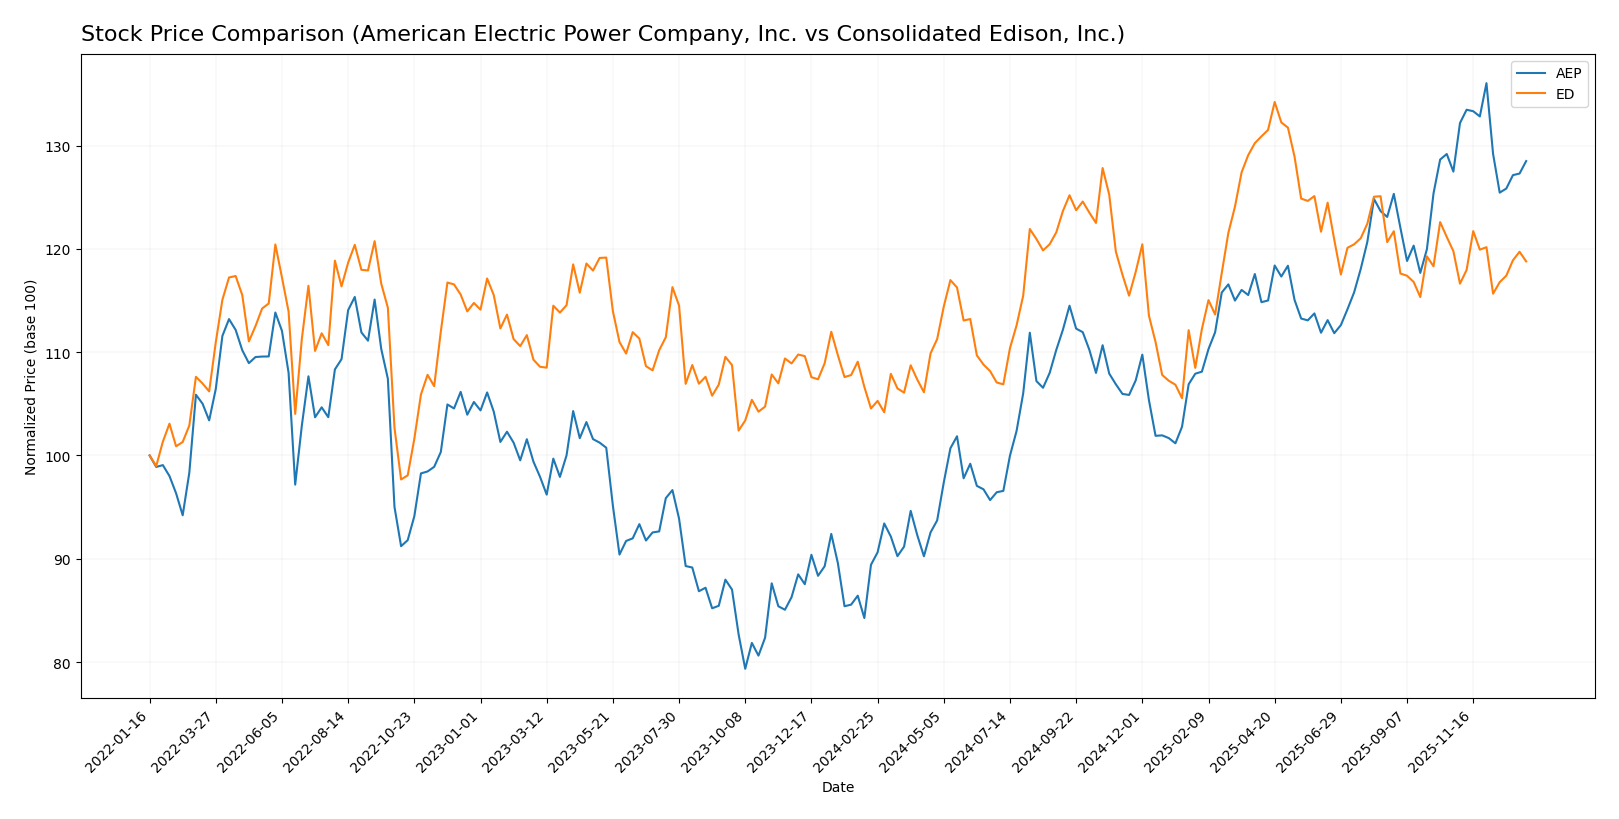
The stock price chart highlights significant bullish trends for American Electric Power Company, Inc. (AEP) and Consolidated Edison, Inc. (ED) over the past 12 months, with notable deceleration and divergent recent short-term movements.
Trend Analysis
American Electric Power Company, Inc. (AEP) experienced a strong bullish trend over the past year with a 43.71% price increase, despite deceleration and a recent slight negative slope of -0.46. Volatility remains elevated with a 10.6 standard deviation.
Consolidated Edison, Inc. (ED) showed a bullish trend with a 13.62% gain over the year and deceleration, alongside a mild recent decline of -0.83% and lower volatility at a 6.0 standard deviation.
Comparing both, AEP delivered the highest market performance with a substantially larger price increase than ED during the past 12 months.
Target Prices
Analysts present a clear target price consensus for these utilities stocks, reflecting moderate upside potential.
| Company | Target High | Target Low | Consensus |
|---|---|---|---|
| American Electric Power Company, Inc. | 138 | 107 | 126.82 |
| Consolidated Edison, Inc. | 106 | 86 | 99.86 |
The target consensus for American Electric Power at 126.82 suggests a solid upside from the current price of 116.91. Consolidated Edison’s consensus of 99.86 is close to its current price of 99.21, indicating a relatively stable valuation outlook.
Analyst Opinions Comparison
This section compares analysts’ ratings and grades for American Electric Power Company, Inc. (AEP) and Consolidated Edison, Inc. (ED):
Rating Comparison
AEP Rating
- Rating: B+, considered very favorable by analysts.
- Discounted Cash Flow Score: 4, indicating favorable valuation.
- ROE Score: 4, showing strong efficiency in generating profit.
- ROA Score: 4, demonstrating effective asset usage.
- Debt To Equity Score: 2, moderate financial risk.
- Overall Score: 3, a moderate overall financial standing.
ED Rating
- Rating: B-, also considered very favorable by analysts.
- Discounted Cash Flow Score: 1, indicating very unfavorable valuation.
- ROE Score: 3, reflecting moderate efficiency.
- ROA Score: 3, demonstrating moderate asset usage.
- Debt To Equity Score: 2, moderate financial risk.
- Overall Score: 2, a moderate but lower overall standing.
Which one is the best rated?
Based strictly on the provided data, AEP has a higher overall score (3 vs. 2) and stronger individual financial scores, particularly in discounted cash flow, ROE, and ROA. ED scores lower in these key metrics despite a very favorable rating status.
Scores Comparison
The scores comparison between American Electric Power Company, Inc. (AEP) and Consolidated Edison, Inc. (ED) is as follows:
AEP Scores
- Altman Z-Score: 0.998, indicating distress zone risk level.
- Piotroski Score: 6, categorized as average financial health.
ED Scores
- Altman Z-Score: 1.195, indicating distress zone risk level.
- Piotroski Score: 7, categorized as strong financial health.
Which company has the best scores?
Based strictly on the provided data, ED has a slightly higher Altman Z-Score and a stronger Piotroski Score than AEP, indicating better financial health scores overall.
Grades Comparison
Here is a comparison of recent grades assigned to American Electric Power Company, Inc. and Consolidated Edison, Inc.:
American Electric Power Company, Inc. Grades
The table below shows the latest grades from reputable financial institutions for American Electric Power Company, Inc.:
| Grading Company | Action | New Grade | Date |
|---|---|---|---|
| UBS | Maintain | Sell | 2025-12-17 |
| JP Morgan | Maintain | Neutral | 2025-12-12 |
| Jefferies | Upgrade | Buy | 2025-11-17 |
| Citigroup | Maintain | Neutral | 2025-10-31 |
| Wells Fargo | Maintain | Overweight | 2025-10-30 |
| Evercore ISI Group | Maintain | Outperform | 2025-10-30 |
| Morgan Stanley | Maintain | Overweight | 2025-10-30 |
| Mizuho | Maintain | Neutral | 2025-10-30 |
| BMO Capital | Downgrade | Market Perform | 2025-10-30 |
| Scotiabank | Maintain | Sector Perform | 2025-10-30 |
Overall, the grades for American Electric Power are generally positive, with multiple firms rating the stock as Overweight, Outperform, or Buy, despite some Sell and Neutral opinions.
Consolidated Edison, Inc. Grades
The table below presents recent grades from established grading companies for Consolidated Edison, Inc.:
| Grading Company | Action | New Grade | Date |
|---|---|---|---|
| UBS | Maintain | Neutral | 2026-01-07 |
| UBS | Maintain | Neutral | 2025-12-17 |
| Keybanc | Maintain | Underweight | 2025-12-12 |
| JP Morgan | Maintain | Underweight | 2025-12-12 |
| Barclays | Maintain | Underweight | 2025-11-10 |
| Barclays | Maintain | Underweight | 2025-10-22 |
| Morgan Stanley | Maintain | Underweight | 2025-10-22 |
| Barclays | Maintain | Underweight | 2025-10-21 |
| Keybanc | Maintain | Underweight | 2025-10-15 |
| Morgan Stanley | Maintain | Underweight | 2025-09-25 |
The grades for Consolidated Edison indicate a consistent trend towards Underweight or Neutral ratings, reflecting cautious or negative sentiment among analysts.
Which company has the best grades?
American Electric Power has received significantly stronger and more positive grades compared to Consolidated Edison, which mostly holds Underweight or Neutral ratings. This suggests that investors might perceive American Electric Power as having better growth or value prospects, while Consolidated Edison faces more skepticism.
Strengths and Weaknesses
Below is a comparative overview of key strengths and weaknesses for American Electric Power Company, Inc. (AEP) and Consolidated Edison, Inc. (ED) based on their recent financial and operational data.
| Criterion | American Electric Power Company, Inc. (AEP) | Consolidated Edison, Inc. (ED) |
|---|---|---|
| Diversification | Moderate; strong in transmission & distribution, generation, and marketing segments | Moderate; electricity-focused with significant oil & gas purchasing and steam services |
| Profitability | Net margin at 14.9% (favorable); ROIC 4.96% (unfavorable) with growing trend but still value-destructive | Net margin at 11.93% (favorable); ROIC 3.48% (unfavorable) with declining trend and value destruction |
| Innovation | Limited indicators; steady ROIC growth suggests some operational improvements | Limited innovation signals; declining ROIC points to challenges in efficiency gains |
| Global presence | Primarily US-focused with extensive vertically integrated utilities | US-centric utility with diversified non-utility services but limited global reach |
| Market Share | Strong in transmission and distribution with revenues ~5.9B in 2024 | Strong regional player with electricity revenues over 10.8B in 2023 |
In summary, both companies show strengths in their core utility operations and maintain favorable net margins. However, they both face challenges with ROIC below WACC, indicating value destruction. AEP shows improving profitability trends, while ED’s profitability is declining, warranting cautious consideration for investors. Diversification and innovation remain moderate in both cases, with a strong US market focus.
Risk Analysis
Below is a comparative risk table for American Electric Power Company, Inc. (AEP) and Consolidated Edison, Inc. (ED) based on the most recent 2024 data:
| Metric | American Electric Power Company, Inc. (AEP) | Consolidated Edison, Inc. (ED) |
|---|---|---|
| Market Risk | Moderate (Beta 0.615) | Lower (Beta 0.379) |
| Debt Level | High (Debt/Equity 1.7, Interest Coverage 2.53) | Moderate (Debt/Equity 1.27, Interest Coverage 2.8) |
| Regulatory Risk | Elevated—Utility sector heavily regulated | Elevated—Strong regulatory environment in NYC area |
| Operational Risk | Moderate—Diverse energy sources, but asset turnover low | Moderate—Complex infrastructure, moderate asset turnover |
| Environmental Risk | Medium—Coal and natural gas use impacts | Medium—Focus on renewables but urban infrastructure challenges |
| Geopolitical Risk | Low—US domestic operations primarily | Low—US domestic operations primarily |
In synthesis, both companies face significant regulatory and environmental risks given their utility sector roles. AEP’s higher debt and lower liquidity ratios increase financial risk, while ED’s urban infrastructure exposure presents operational challenges. The Altman Z-Scores place both in the distress zone, signaling caution due to potential financial stress. Investors should weigh these risks carefully against dividend yields and sector stability.
Which Stock to Choose?
American Electric Power Company, Inc. (AEP) shows a favorable income statement with strong net margin growth of 30.76% in one year and a 34.86% increase over five years. Its financial ratios are slightly unfavorable overall, with concerns on liquidity and debt levels, though dividend yield and net margin are positive. The company’s debt-to-equity is high and Altman Z-Score indicates distress, but the rating is very favorable (B+), reflecting moderate overall financial health.
Consolidated Edison, Inc. (ED) presents a favorable income statement with a mixed recent trend, having negative net margin growth and EPS decline in the last year but strong five-year net income and EPS growth. Its financial ratios are slightly unfavorable but better balanced than AEP, with neutral liquidity and moderate debt. The Altman Z-Score also signals distress, though Piotroski Score is stronger at 7, and its rating is slightly lower (B-), indicating moderate financial standing.
Investors focused on growth might find AEP’s improving profitability and favorable income growth more appealing despite liquidity and debt concerns. Meanwhile, those prioritizing stability and balanced financial ratios could view ED as a more moderate option, though its declining profitability trend may signal caution. The ratings and income evaluations suggest differing risk profiles depending on investment objectives.
Disclaimer: Investment carries a risk of loss of initial capital. The past performance is not a reliable indicator of future results. Be sure to understand risks before making an investment decision.
Go Further
I encourage you to read the complete analyses of American Electric Power Company, Inc. and Consolidated Edison, Inc. to enhance your investment decisions: