Home > Comparison > Utilities > AEP vs CMS
The strategic rivalry between American Electric Power Company, Inc. and CMS Energy Corporation shapes the utilities sector’s evolution. AEP operates as a vertically integrated utility, managing generation, transmission, and distribution with diverse energy sources. CMS Energy combines electric and gas utilities with a significant focus on renewables and infrastructure. This analysis examines which business model delivers superior risk-adjusted returns, crucial for investors seeking resilience and growth in regulated electric markets.
Table of contents
Companies Overview
American Electric Power Company, Inc. and CMS Energy Corporation both dominate the regulated electric utility sector in the United States.
American Electric Power Company, Inc.: Vertically Integrated Electric Utility Leader
American Electric Power Company, Inc. operates as a vertically integrated utility, generating, transmitting, and distributing electricity across multiple states. Its core revenue stems from diversified energy sources, including coal, natural gas, nuclear, and renewables. In 2026, the company strategically prioritizes expanding its transmission infrastructure and increasing renewable energy capacity to adapt to evolving market demands.
CMS Energy Corporation: Regional Energy Provider with Diverse Utility Segments
CMS Energy Corporation focuses on regulated electric and gas utilities primarily in Michigan. It generates revenue through electricity and gas sales, supported by a vast distribution network and independent renewable generation. In 2026, CMS emphasizes strengthening its gas utility operations and expanding renewable energy projects to meet regulatory and customer sustainability goals.
Strategic Collision: Similarities & Divergences
Both companies operate in the regulated electric utility space but differ in scale and diversification. American Electric Power emphasizes a large-scale integrated model with substantial transmission assets, while CMS balances electric and gas utilities with a regional focus. Their primary market battle centers on renewable integration and infrastructure modernization. Investors will find distinct profiles: one favors broad scale and asset base, the other a concentrated, dual-utility approach.
Income Statement Comparison
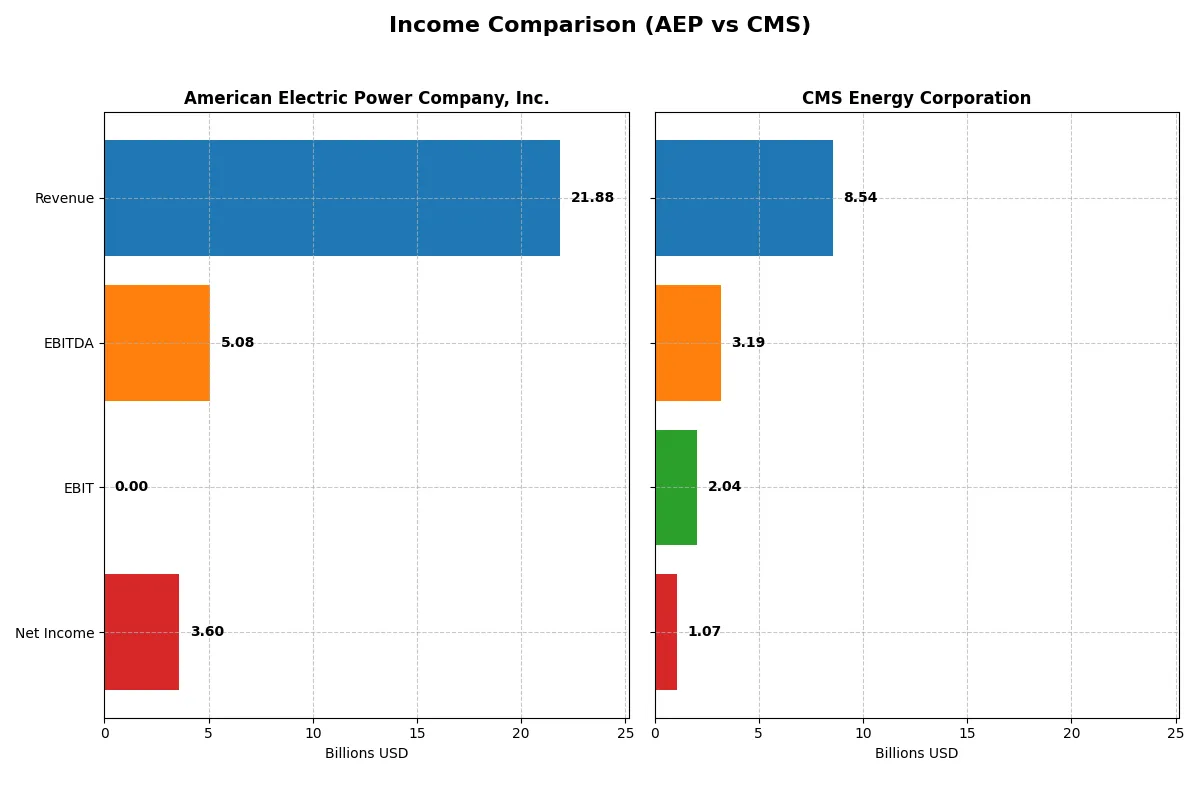
This data dissects the core profitability and scalability of both corporate engines to reveal who dominates the bottom line:
| Metric | American Electric Power Company, Inc. (AEP) | CMS Energy Corporation (CMS) |
|---|---|---|
| Revenue | 21.9B | 8.5B |
| Cost of Revenue | 0 | 3.3B |
| Operating Expenses | 0 | 3.5B |
| Gross Profit | 0 | 5.2B |
| EBITDA | 5.1B | 3.2B |
| EBIT | 0 | 2.0B |
| Interest Expense | -2.0B | 0.8B |
| Net Income | 3.6B | 1.1B |
| EPS | 6.66 | 3.53 |
| Fiscal Year | 2025 | 2025 |
Income Statement Analysis: The Bottom-Line Duel
This income statement comparison reveals which company runs a more efficient and profitable corporate engine through revenue and net income dynamics.
American Electric Power Company, Inc. Analysis
American Electric Power’s revenue climbed steadily from 16.6B in 2021 to 21.9B in 2025, marking a 31.6% growth over five years. Net income advanced 44.5% over the same period, reaching 3.6B in 2025. Despite a zero gross margin reported in 2025, net margin held strong at 16.4%, reflecting effective cost management and growing earnings per share momentum.
CMS Energy Corporation Analysis
CMS grew revenue from 7.3B in 2021 to 8.5B in 2025, a more modest 16.5% increase. Net income declined over five years by 20.8%, finishing at 1.07B in 2025. CMS maintains a solid gross margin near 61% and an EBIT margin of 23.9%, but net margin slipped to 12.5%. Recent revenue and earnings growth slowed, signaling operational pressures despite steady cash flow generation.
Growth Scale vs. Margin Strength
American Electric Power displays superior revenue and net income growth, paired with improving net margins and EPS gains. CMS boasts healthier gross and EBIT margins but struggles with declining net income and margin contraction over time. For investors, AEP’s profile offers stronger growth and profitability momentum, while CMS emphasizes margin quality but faces earnings headwinds.
Financial Ratios Comparison
These vital ratios act as a diagnostic tool to expose the underlying fiscal health, valuation premiums, and capital efficiency of the companies compared below:
| Ratios | American Electric Power Company, Inc. (AEP) | CMS Energy Corporation (CMS) |
|---|---|---|
| ROE | 11.5% | 11.7% |
| ROIC | -54.6% | 3.7% |
| P/E | 16.6 | 19.6 |
| P/B | 1.92 | 2.30 |
| Current Ratio | 0 | 0.98 |
| Quick Ratio | 0 | 0.76 |
| D/E (Debt-to-Equity) | 0.144 | 2.07 |
| Debt-to-Assets | 0 | 0.47 |
| Interest Coverage | -2.63 | 2.19 |
| Asset Turnover | 0 | 0.21 |
| Fixed Asset Turnover | 0 | 0.28 |
| Payout ratio | 56% | 61% |
| Dividend yield | 3.36% | 3.10% |
| Fiscal Year | 2025 | 2025 |
Efficiency & Valuation Duel: The Vital Signs
Financial ratios act as a company’s DNA, revealing hidden risks and operational excellence behind headline figures.
American Electric Power Company, Inc.
AEP posts a solid 11.55% ROE and a favorable 16.43% net margin, signaling decent profitability. Its P/E of 16.64 and P/B of 1.92 mark the stock as fairly valued but not cheap. The 3.36% dividend yield rewards shareholders, balancing moderate efficiency with steady income.
CMS Energy Corporation
CMS delivers a comparable 11.71% ROE but with a slimmer 12.54% net margin. The stock trades at a slightly higher P/E of 19.63 and P/B of 2.3, indicating a more stretched valuation. Its 3.1% dividend yield offers steady returns, though higher leverage and weaker asset turnover flag operational challenges.
Balanced Profitability vs. Valuation Stretch
Both companies share slightly unfavorable global ratio profiles. AEP offers a better risk-reward balance with stronger margins and lower valuation multiples. Investors seeking yield with operational safety may prefer AEP’s profile, while CMS suits those tolerant of valuation risk for growth potential.
Which one offers the Superior Shareholder Reward?
American Electric Power Company, Inc. (AEP) delivers a higher dividend yield near 3.36% with a payout ratio of 56%, supported by strong free cash flow coverage (~98%). Its modest buybacks complement dividends, sustaining shareholder returns. CMS Energy Corporation (CMS) yields slightly lower at ~3.1%, with a 61% payout ratio and solid free cash flow backing. CMS’s buyback activity is less pronounced, focusing more on dividends. I see AEP’s balanced distribution—robust dividend and steady buybacks—as more sustainable. For 2026, AEP offers a superior total return profile, blending income and capital return prudently.
Comparative Score Analysis: The Strategic Profile
The radar chart reveals the fundamental DNA and trade-offs of American Electric Power and CMS Energy Corporation, highlighting their core financial strengths and weaknesses:
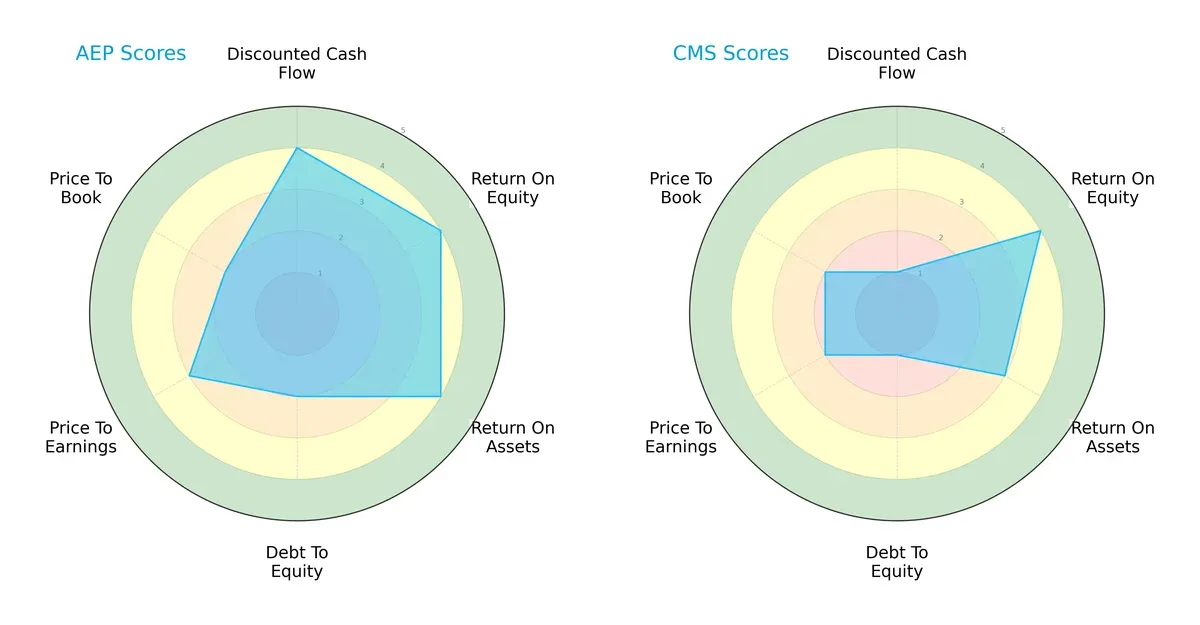
American Electric Power (AEP) shows solid profitability with favorable ROE and ROA scores (4 each), supported by a strong DCF score (4). However, its debt-to-equity and price-to-book scores are weaker (2), signaling leverage concerns. CMS Energy (CMS) lags in DCF (1) and debt management (1) but maintains a decent ROE (4) and moderate ROA (3). AEP presents a more balanced financial profile, while CMS relies heavily on operational efficiency rather than valuation or financial stability.
Bankruptcy Risk: Solvency Showdown
The Altman Z-Scores place both firms in the distress zone, indicating significant solvency risks this cycle:
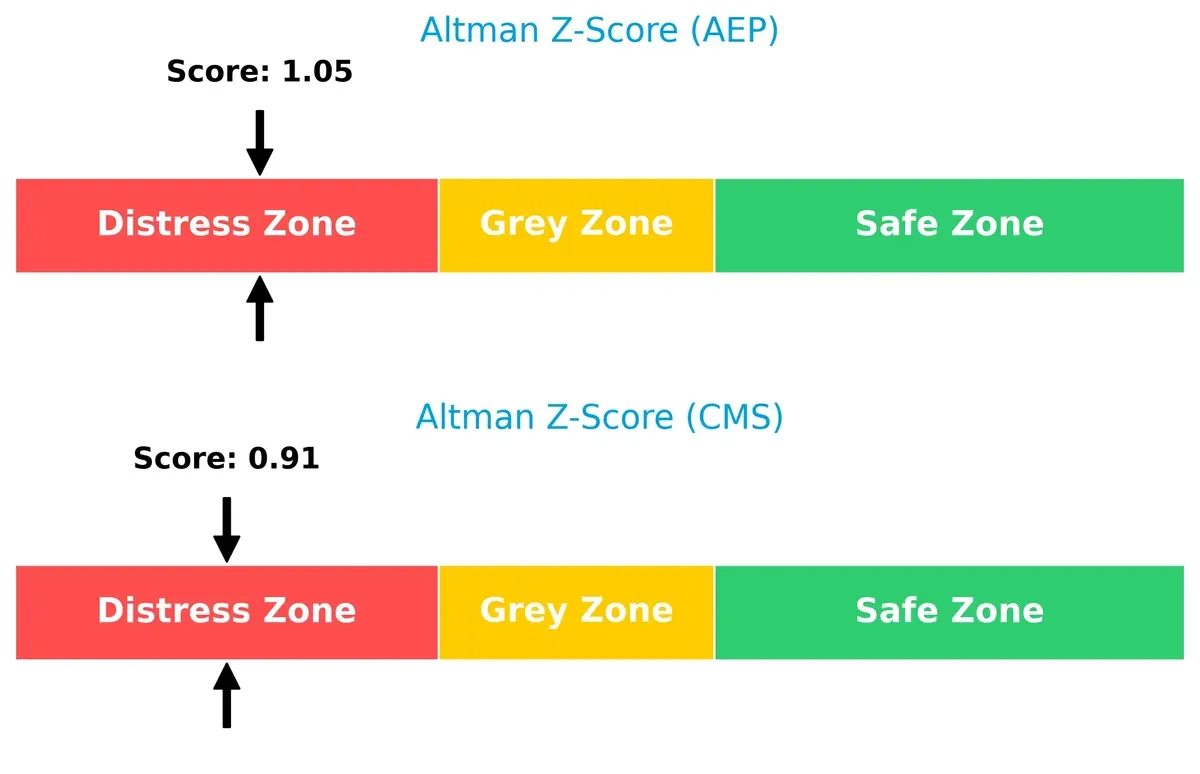
AEP’s score of 1.05 is slightly better than CMS’s 0.91, but both are well below the safe threshold of 3. This suggests elevated bankruptcy risk and stresses the need for cautious capital allocation and deleveraging strategies going forward.
Financial Health: Quality of Operations
CMS edges out AEP in financial health with a stronger Piotroski F-Score, signaling better internal operational quality:
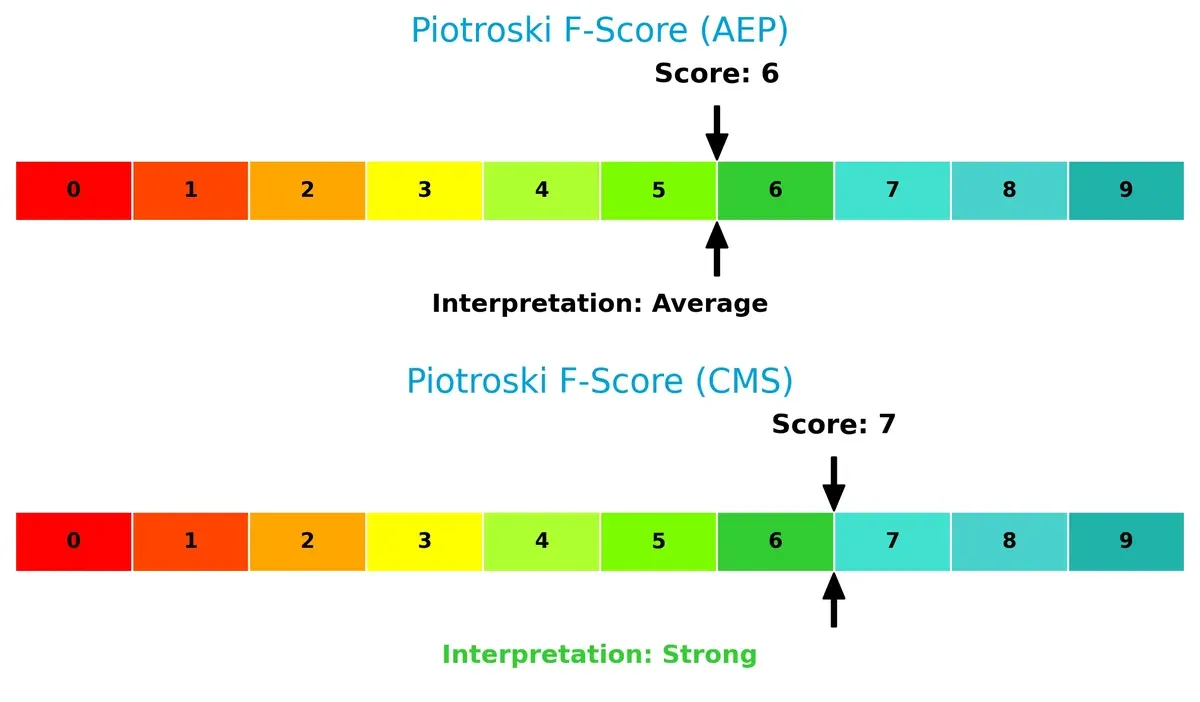
CMS scores a 7 (strong), reflecting solid profitability, liquidity, and efficiency metrics. AEP’s 6 (average) indicates reasonable health but with some red flags in operational consistency. Investors should weigh CMS’s stronger fundamentals against its solvency challenges.
How are the two companies positioned?
This section dissects the operational DNA of AEP and CMS by comparing their revenue distribution and internal strengths and weaknesses. The goal is to confront their economic moats to identify which business model offers the most resilient and sustainable competitive advantage today.
Revenue Segmentation: The Strategic Mix
This visual comparison dissects how American Electric Power Company, Inc. and CMS Energy Corporation diversify their income streams and where their primary sector bets lie:
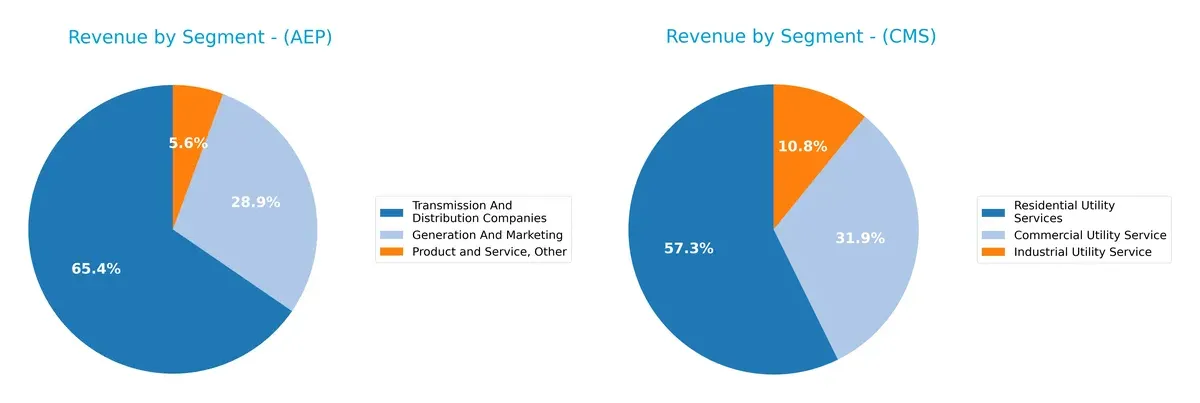
American Electric Power anchors its revenue on Transmission and Distribution Companies at $6.1B, complemented by $2.7B from Generation and Marketing. Its blend shows moderate diversification but a clear infrastructure dominance. CMS Energy pivots on Residential Utility Services, generating $4.4B, with Commercial and Industrial Utility Services adding $2.4B and $0.8B respectively, indicating a more balanced retail-focused mix. AEP’s reliance on infrastructure risks regulatory shifts, while CMS’s consumer segmentation offers resilience but exposes it to demand fluctuations.
Strengths and Weaknesses Comparison
This table compares the strengths and weaknesses of American Electric Power Company, Inc. (AEP) and CMS Energy Corporation (CMS):
AEP Strengths
- Higher net margin at 16.43%
- Favorable debt-to-equity ratio at 0.14
- Dividend yield of 3.36% supports shareholder returns
- Wide revenue streams from generation, transmission, and services
CMS Strengths
- Favorable net margin at 12.54%
- Lower WACC at 4.96% indicating cheaper capital
- Balanced revenue from commercial, industrial, and residential utilities
- Dividend yield of 3.1% provides consistent income
AEP Weaknesses
- Negative ROIC at -54.56% far below WACC
- Unfavorable current and quick ratios indicate liquidity risks
- Negative interest coverage ratio signals financial stress
- Poor asset turnover metrics affect efficiency
CMS Weaknesses
- Low ROIC at 3.67%, below WACC
- Unfavorable high debt-to-equity at 2.07
- Current and quick ratios below 1 suggest liquidity constraints
- Asset turnover ratios remain weak
Both companies show slightly unfavorable overall financial ratios, with AEP having stronger profitability but significant liquidity and efficiency concerns. CMS displays more balanced capital costs but suffers from higher leverage and moderate efficiency. These patterns suggest each firm must address specific financial challenges to optimize their strategic positioning.
The Moat Duel: Analyzing Competitive Defensibility
A structural moat is the only reliable shield protecting long-term profits from relentless competitive erosion in utilities:
American Electric Power Company, Inc. (AEP): Capital-Intensive Infrastructure Moat
I see AEP’s moat rooted in its vast, capital-heavy electric transmission and generation assets. Despite a declining ROIC, its steady net margin growth signals margin resilience. New renewables investments in 2026 could reinforce this moat but require careful capital allocation to halt value erosion.
CMS Energy Corporation (CMS): Integrated Utility Service Moat
CMS leverages a diversified utility model combining electric and gas services, contrasting AEP’s pure electric focus. Its higher gross and EBIT margins reflect operational efficiency. However, declining net income and ROIC warn of weakening competitive advantage. Expansion into renewables offers upside if profitability stabilizes.
Infrastructure Scale vs. Service Integration: Who Holds the Moat Edge?
Both companies face declining ROICs, indicating value destruction. Yet, AEP’s scale and ongoing margin improvements suggest a deeper moat. I conclude AEP is better positioned to defend market share through infrastructure dominance, while CMS must address profitability challenges to keep pace.
Which stock offers better returns?
Over the past 12 months, both stocks gained ground with notable price acceleration, reflecting strong buyer dominance and increasing trading volumes.
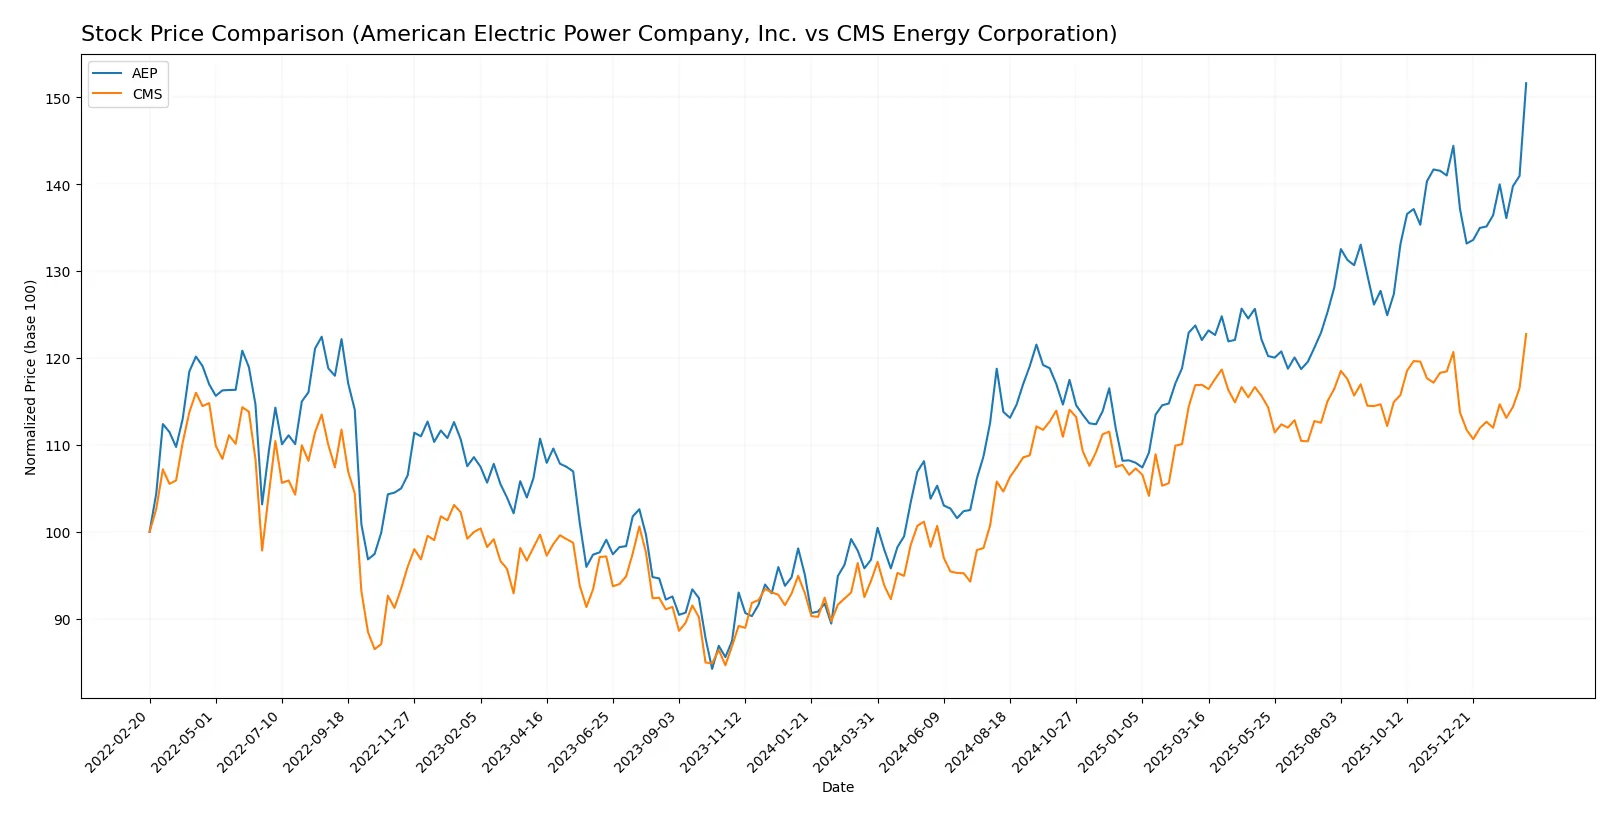
Trend Comparison
American Electric Power Company, Inc. (AEP) shows a 56.65% price increase over the past year, indicating a bullish trend with acceleration and high volatility (std dev 10.66). Its price ranged from 82.1 to 129.94.
CMS Energy Corporation (CMS) recorded a 30.13% gain over the same period, also bullish with acceleration but lower volatility (std dev 4.65). The stock’s price fluctuated between 57.66 and 76.74.
AEP’s trend outperforms CMS with a stronger price rise and higher buyer dominance, delivering the highest market performance in this comparison.
Target Prices
Analysts present a clear target consensus for American Electric Power and CMS Energy, reflecting moderate upside potential.
| Company | Target Low | Target High | Consensus |
|---|---|---|---|
| American Electric Power Company, Inc. | 107 | 142 | 130.17 |
| CMS Energy Corporation | 74 | 82 | 78.38 |
The target consensus for AEP slightly exceeds its current price of 129.94, indicating modest growth expectations. CMS’s consensus of 78.38 also suggests moderate upside from its 76.74 current price.

Don’t Let Luck Decide Your Entry Point
Optimize your entry points with our advanced ProRealTime indicators. You’ll get efficient buy signals with precise price targets for maximum performance. Start outperforming now!
How do institutions grade them?
The following tables summarize recent institutional grades for American Electric Power Company, Inc. and CMS Energy Corporation:
American Electric Power Company, Inc. Grades
The table below shows recent grades assigned by reputable financial institutions:
| Grading Company | Action | New Grade | Date |
|---|---|---|---|
| Wells Fargo | maintain | Overweight | 2026-02-13 |
| Wolfe Research | upgrade | Outperform | 2026-02-13 |
| Mizuho | maintain | Neutral | 2026-02-13 |
| Barclays | maintain | Equal Weight | 2026-01-22 |
| Wells Fargo | maintain | Overweight | 2026-01-20 |
| B of A Securities | downgrade | Neutral | 2026-01-12 |
| UBS | maintain | Sell | 2025-12-17 |
| JP Morgan | maintain | Neutral | 2025-12-12 |
| Jefferies | upgrade | Buy | 2025-11-17 |
| Citigroup | maintain | Neutral | 2025-10-31 |
CMS Energy Corporation Grades
Below is a summary of recent grades from established grading firms:
| Grading Company | Action | New Grade | Date |
|---|---|---|---|
| BMO Capital | maintain | Outperform | 2026-02-09 |
| Mizuho | maintain | Neutral | 2026-02-06 |
| Morgan Stanley | maintain | Equal Weight | 2026-02-02 |
| Jefferies | maintain | Buy | 2026-01-28 |
| Wells Fargo | maintain | Equal Weight | 2026-01-20 |
| JP Morgan | maintain | Overweight | 2026-01-15 |
| Jefferies | maintain | Buy | 2026-01-15 |
| Barclays | maintain | Overweight | 2026-01-15 |
| UBS | maintain | Neutral | 2025-12-17 |
| JP Morgan | maintain | Overweight | 2025-12-11 |
Which company has the best grades?
American Electric Power shows a mixed grade profile, ranging from Sell to Outperform. CMS Energy maintains more consistent positive ratings, including multiple Buy and Overweight grades. This consistency may signal stronger institutional confidence in CMS, potentially influencing investor sentiment.
Risks specific to each company
The following categories identify the critical pressure points and systemic threats facing both firms in the 2026 market environment:
1. Market & Competition
American Electric Power Company, Inc.
- Operates in a highly regulated, competitive utility market with diversified generation sources.
CMS Energy Corporation
- Focuses primarily on Michigan, facing regional competition and regulatory constraints.
2. Capital Structure & Debt
American Electric Power Company, Inc.
- Maintains low debt-to-equity (0.14) and favorable debt metrics, signaling financial conservatism.
CMS Energy Corporation
- Exhibits high debt-to-equity (2.07) and moderate interest coverage, increasing financial risk.
3. Stock Volatility
American Electric Power Company, Inc.
- Beta of 0.61 indicates lower volatility versus market, appealing for risk-averse investors.
CMS Energy Corporation
- Beta of 0.48 suggests even lower volatility but combined with financial risks.
4. Regulatory & Legal
American Electric Power Company, Inc.
- Faces regulatory pressures linked to emissions and energy transition policies nationwide.
CMS Energy Corporation
- Subject to Michigan-specific regulations and compliance costs affecting utility operations.
5. Supply Chain & Operations
American Electric Power Company, Inc.
- Vertically integrated operations mitigate supplier risks but require capital-intensive maintenance.
CMS Energy Corporation
- Extensive electric and gas infrastructure increases exposure to operational disruptions.
6. ESG & Climate Transition
American Electric Power Company, Inc.
- Transitioning energy mix with coal and nuclear exposure poses ESG transition challenges.
CMS Energy Corporation
- Greater focus on renewables but still reliant on fossil fuels, creating transition risk.
7. Geopolitical Exposure
American Electric Power Company, Inc.
- Primarily domestic US exposure limits geopolitical risk.
CMS Energy Corporation
- Also US-focused, with minimal direct geopolitical vulnerability.
Which company shows a better risk-adjusted profile?
American Electric Power faces its greatest risk in operational and ESG transition pressures, with a weak Altman Z-score signaling financial distress. CMS Energy’s most impactful risk lies in its elevated leverage and weaker capital structure, exacerbating bankruptcy risk despite a stronger Piotroski score. Between the two, American Electric Power’s lower leverage and more diversified operations suggest a marginally better risk-adjusted profile, but both show distress-zone signals that warrant caution. The recent data reveal AEP’s distress-zone Altman Z-score at 1.05 underscores urgent financial stability concerns.
Final Verdict: Which stock to choose?
American Electric Power Company, Inc. (AEP) impresses with its robust cash generation and steady revenue growth, reflecting operational resilience. Its key point of vigilance lies in inefficient capital utilization, signaling potential value destruction. AEP fits investors seeking aggressive growth with a tolerance for financial complexity.
CMS Energy Corporation (CMS) boasts a strategic moat grounded in consistent earnings and operational efficiency, supported by a recurring revenue base. It offers a relatively safer profile than AEP, though it carries higher leverage risks. CMS suits portfolios focused on growth at a reasonable price with moderate stability.
If you prioritize aggressive growth and can withstand some capital allocation inefficiencies, AEP outshines with superior cash flow momentum. However, if you seek better stability and a clearer operating moat in a more conservative setup, CMS offers a safer analytical scenario despite its financial leverage challenges. Both require cautious monitoring of their value creation metrics.
Disclaimer: Investment carries a risk of loss of initial capital. The past performance is not a reliable indicator of future results. Be sure to understand risks before making an investment decision.
Go Further
I encourage you to read the complete analyses of American Electric Power Company, Inc. and CMS Energy Corporation to enhance your investment decisions: