Home > Comparison > Utilities > XEL vs AEE
The strategic rivalry between Xcel Energy Inc. and Ameren Corporation shapes the competitive landscape of the regulated electric utilities sector. Xcel Energy operates as a diversified utility with a broad energy mix and extensive geographic footprint. Ameren focuses on regulated electric and natural gas distribution primarily in the Midwest. This head-to-head contrasts scale and diversification against regional specialization. This analysis will identify which company offers a superior risk-adjusted profile for a diversified portfolio in 2026.
Table of contents
Companies Overview
Xcel Energy and Ameren Corporation anchor the regulated electric utility landscape in the US Midwest and beyond.
Xcel Energy Inc.: Diverse Energy Portfolio Leader
Xcel Energy operates as a regulated electric utility, generating and distributing electricity and natural gas. Its revenue stems from serving 3.7M electricity and 2.1M natural gas customers across eight states. In 2026, Xcel emphasizes expanding its renewable generation capacity alongside traditional sources, reinforcing its competitive edge in clean energy transition.
Ameren Corporation: Integrated Utility Holding Company
Ameren Corporation functions as a rate-regulated electric and natural gas utility with four operational segments. It profits from generation, transmission, and distribution primarily in Missouri and Illinois. Ameren’s 2026 strategy focuses on strengthening infrastructure reliability while increasing investment in renewable energy sources to meet evolving regulatory and customer demands.
Strategic Collision: Similarities & Divergences
Both companies share a regulated utility framework with a strong emphasis on renewable energy growth. However, Xcel’s broader geographic footprint contrasts with Ameren’s concentrated regional focus. The primary battleground lies in infrastructure modernization and clean energy integration. Their distinct scales and strategic priorities create unique risk-return profiles for investors navigating the utilities sector.
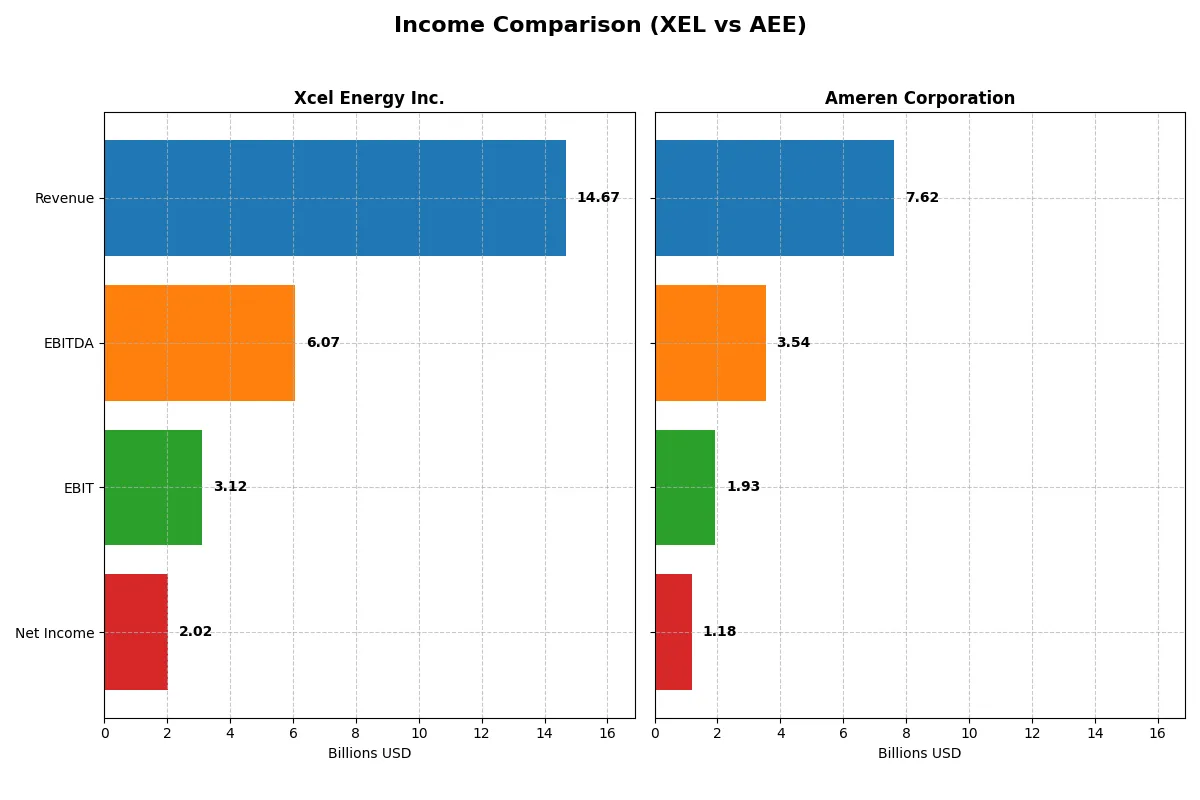
Income Statement Comparison
The following data dissects the core profitability and scalability of both corporate engines to reveal who dominates the bottom line:
| Metric | Xcel Energy Inc. (XEL) | Ameren Corporation (AEE) |
|---|---|---|
| Revenue | 14.7B | 7.6B |
| Cost of Revenue | 11.1B | 4.0B |
| Operating Expenses | 686M | 2.1B |
| Gross Profit | 3.6B | 3.7B |
| EBITDA | 6.1B | 3.5B |
| EBIT | 3.1B | 1.9B |
| Interest Expense | 1.3B | 663M |
| Net Income | 2.0B | 1.2B |
| EPS | 3.44 | 4.43 |
| Fiscal Year | 2025 | 2024 |
Income Statement Analysis: The Bottom-Line Duel
This income statement comparison reveals which company runs its corporate engine more efficiently through revenue growth and margin management.
Xcel Energy Inc. Analysis
Xcel Energy’s revenue grew steadily to 14.7B in 2025, with net income rising to 2.0B, showing solid profit expansion. Its gross margin contracted sharply in 2025 but remains healthy at 24.3%. EBIT margin holds firm at 21.2%, reflecting strong operational control despite a slight dip in net margin. The company shows momentum in expanding net income and EPS over five years.
Ameren Corporation Analysis
Ameren’s revenue reached 7.6B in 2024, growing modestly with net income at 1.18B. The firm enjoys a robust gross margin near 48% and an EBIT margin over 25%, signaling excellent cost efficiency. Net margin stands at a solid 15.5%. Although recent revenue growth is slow, Ameren maintains consistent profitability with steady EPS gains over the medium term.
Margin Efficiency vs. Revenue Scale
Xcel Energy demonstrates impressive top-line growth and expanding net income, but its margins face pressure. Ameren boasts superior margins and operational efficiency, although revenue growth is more subdued. For investors, Xcel’s profile suits those favoring scale and growth momentum, whereas Ameren appeals to those prioritizing margin strength and consistent profitability.
Financial Ratios Comparison
These vital ratios act as a diagnostic tool to expose underlying fiscal health, valuation premiums, and capital efficiency across companies:
| Ratios | Xcel Energy Inc. (XEL) | Ameren Corporation (AEE) |
|---|---|---|
| ROE | 9.9% | 9.8% |
| ROIC | 3.6% | 3.3% |
| P/E | 19.6 | 20.1 |
| P/B | 1.95 | 1.96 |
| Current Ratio | 0.67 | 0.66 |
| Quick Ratio | 0.57 | 0.44 |
| D/E | 1.55 | 1.55 |
| Debt-to-Assets | 43.1% | 41.98% |
| Interest Coverage | 2.02 | 2.29 |
| Asset Turnover | 0.19 | 0.17 |
| Fixed Asset Turnover | 0.23 | 0.21 |
| Payout ratio | 61% | 60% |
| Dividend yield | 3.1% | 3.0% |
| Fiscal Year | 2024 | 2024 |
Efficiency & Valuation Duel: The Vital Signs
Financial ratios serve as a company’s DNA, unlocking insights into hidden risks and operational excellence that raw numbers alone cannot reveal.
Xcel Energy Inc.
Xcel shows a favorable net margin of 13.76% but struggles with zero reported ROE and ROIC, signaling weak profitability efficiency. Its P/E ratio at 21.48 is neutral, suggesting valuation is fairly priced, while a solid 3.83% dividend yield rewards shareholders amid limited reinvestment signals.
Ameren Corporation
Ameren posts a stronger net margin of 15.51% yet faces unfavorable ROE at 9.76% and modest ROIC of 3.32%. The P/E of 20.12 is neutral, with a lower 3.0% dividend yield. Debt levels and liquidity ratios show caution, reflecting a heavier leverage profile and operational constraints.
Margin Strength vs. Profitability and Leverage
Both companies carry slightly unfavorable overall ratios, but Xcel’s higher dividend yield and better debt stance offer a steadier risk-reward balance. Ameren’s stronger margin contrasts with its higher leverage, fitting investors more tolerant of financial risk seeking margin resilience.
Which one offers the Superior Shareholder Reward?
I compare Xcel Energy Inc. (XEL) and Ameren Corporation (AEE) on dividends and buybacks. XEL yields 3.8% with a payout ratio of 82%, reflecting strong cash return to shareholders. AEE offers a slightly lower 3.0% yield and a 60% payout, indicating more retained earnings. Both companies face free cash flow deficits, pressuring buybacks: XEL’s buyback intensity is moderate, while AEE’s is constrained by larger capex needs. Historically, I observe utilities with higher payout ratios and stable dividends like XEL deliver more consistent total returns. I find XEL’s distribution model more sustainable and rewarding for 2026 investors.
Comparative Score Analysis: The Strategic Profile
The radar chart reveals the fundamental DNA and trade-offs shaping Xcel Energy Inc. and Ameren Corporation’s financial profiles:
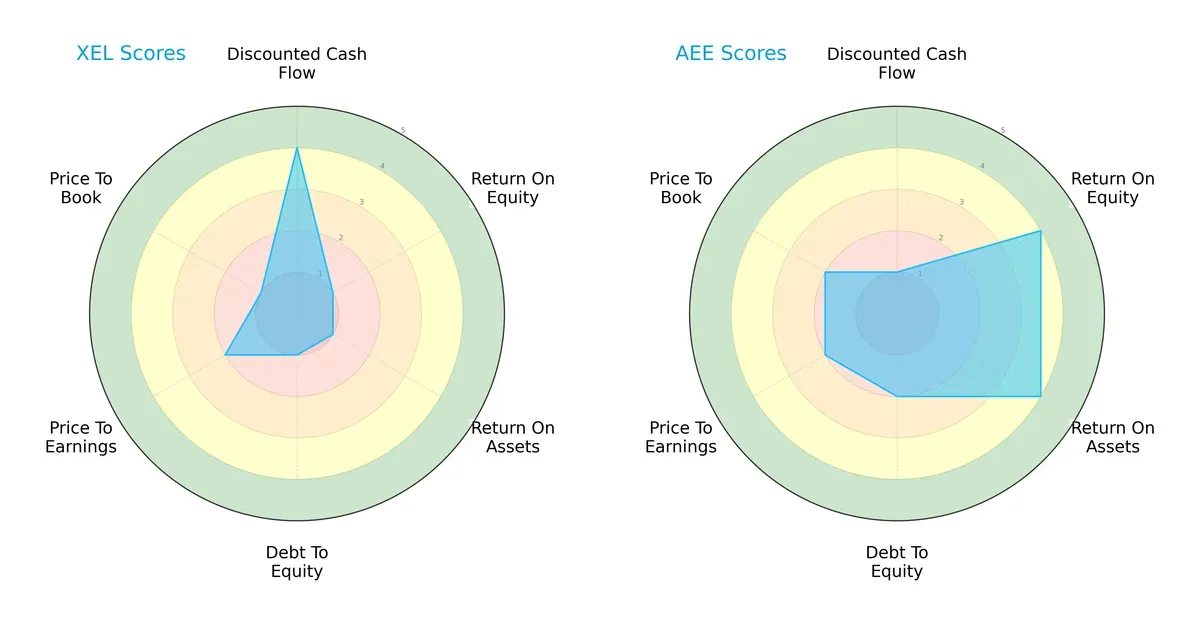
Xcel Energy shines in discounted cash flow (DCF) with a favorable score of 4 but struggles in profitability and leverage, scoring very unfavorably on ROE, ROA, and debt-to-equity. Ameren, conversely, posts strong profitability metrics (ROE and ROA at 4) and moderate financial stability but lags in DCF valuation. Ameren offers a more balanced profile. Xcel relies heavily on its valuation edge, but its financial risks are notable.
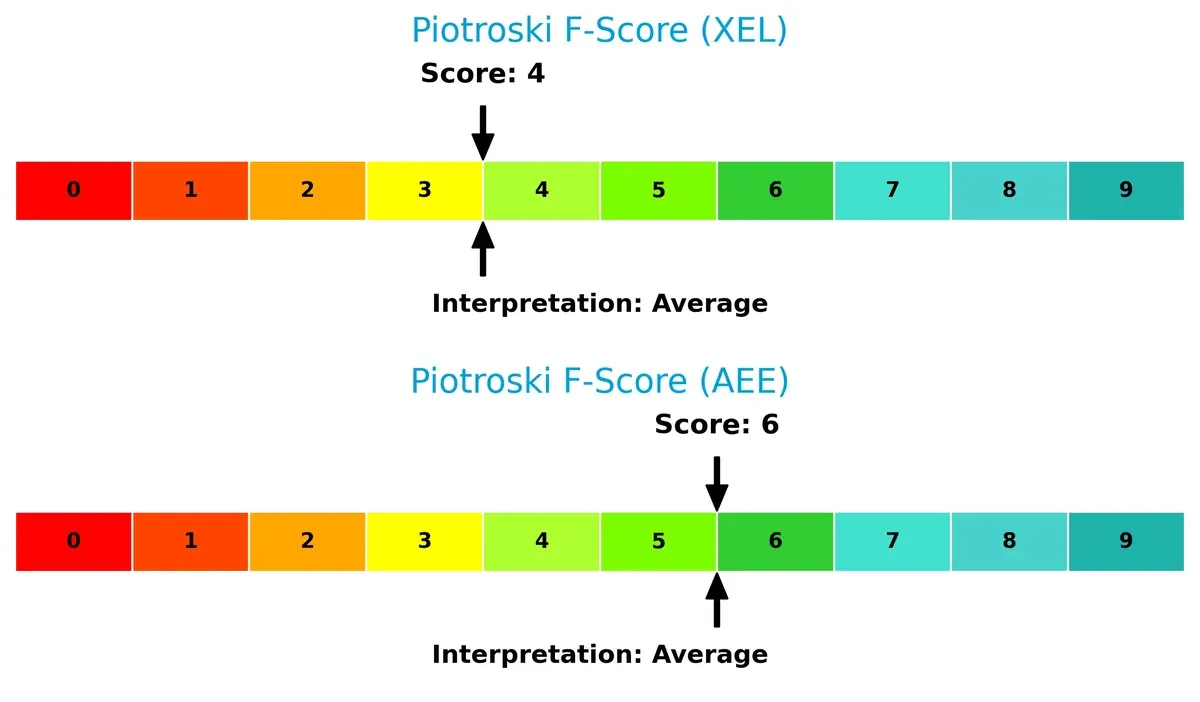
Financial Health: Quality of Operations
Ameren edges out Xcel with a Piotroski F-Score of 6 versus 4, indicating stronger internal financial health. Both firms fall into average territory, but Xcel’s lower score flags potential operational weaknesses relative to Ameren:
How are the two companies positioned?
This section dissects Xcel Energy and Ameren’s operational DNA by comparing their revenue distribution and internal dynamics. The goal is to confront their economic moats to identify which model offers the most resilient competitive advantage today.
Revenue Segmentation: The Strategic Mix
This visual comparison dissects how Xcel Energy Inc. and Ameren Corporation diversify their income streams and highlights their primary sector bets:
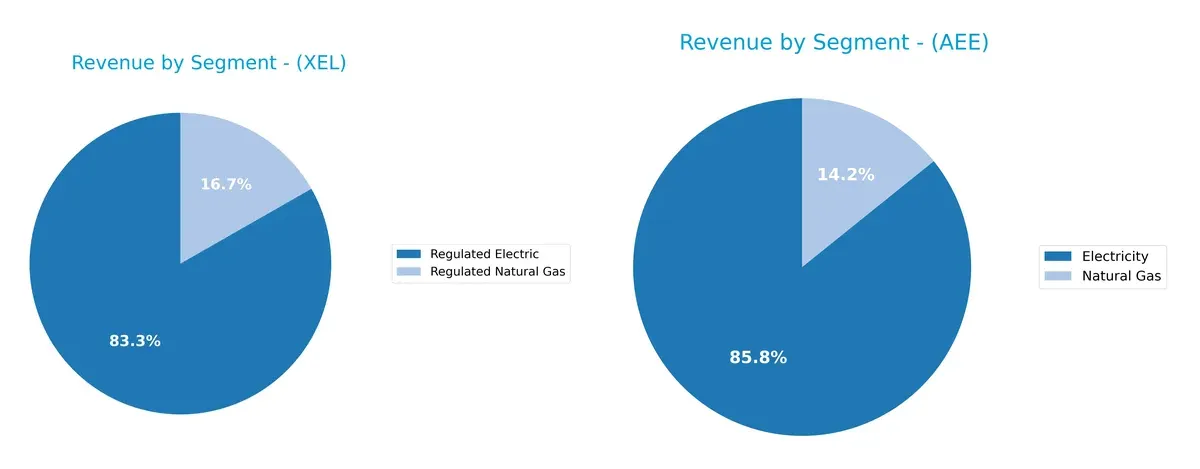
Xcel Energy leans heavily on Regulated Electric, generating $22.3B in 2024 and anchoring its strategy in stable utility infrastructure. Ameren shows more balance, with $6.54B from Electricity and $1.08B from Natural Gas. Xcel’s concentrated electric focus signals infrastructure dominance but poses sector risk. Ameren’s diversified mix reduces vulnerability but may dilute competitive moats compared to Xcel’s electric stronghold.
Strengths and Weaknesses Comparison
This table compares the strengths and weaknesses of Xcel Energy Inc. and Ameren Corporation:
Xcel Energy Inc. Strengths
- Higher net margin at 13.76%
- Favorable debt to equity and debt to assets ratios
- Strong dividend yield at 3.83%
- Larger regulated electric revenue base
Ameren Corporation Strengths
- Higher net margin at 15.51%
- Favorable WACC at 5.22%
- Neutral P/E ratio slightly lower at 20.12
- Consistent natural gas and electricity revenue streams
Xcel Energy Inc. Weaknesses
- Zero ROE and ROIC indicate poor capital efficiency
- Unfavorable liquidity ratios (current and quick ratios)
- Unavailable WACC data restricts full financial assessment
- Low asset and fixed asset turnover ratios
Ameren Corporation Weaknesses
- Unfavorable ROE and ROIC show suboptimal returns
- Unfavorable debt to equity ratio at 1.55
- Weak liquidity ratios below 1
- Unfavorable asset turnover and fixed asset turnover ratios
Both companies show slightly unfavorable overall financial ratio profiles, with strengths in profitability and dividend yield. Each faces challenges in capital efficiency and liquidity, which may impact strategic financial management.
The Moat Duel: Analyzing Competitive Defensibility
A structural moat is the only reliable shield protecting long-term profits from relentless competitive erosion:
Xcel Energy Inc.: Diversified Asset Base with Regulatory Backing
Xcel’s moat stems from its regulated utility status and broad energy mix. Financials show stable margins despite some profit growth volatility. Expansion into renewables may strengthen resilience in 2026.
Ameren Corporation: Focused Regulatory Franchise with Operational Efficiency
Ameren’s moat relies on its regulated electric and gas franchises, delivering higher margins than Xcel. Despite a declining ROIC, operational discipline supports modest growth and potential for regional expansion.
Regulatory Scale and Margin Stability: The Key Moat Battle
Xcel’s diverse energy portfolio offers a wider moat, balancing regulatory protections with innovation. Ameren’s deeper margin profile is offset by value destruction signals. Xcel is better positioned to defend market share long term.
Which stock offers better returns?
Over the past 12 months, both stocks showed strong gains with decelerating momentum, while recent trading dynamics diverged, reflecting shifts in buyer dominance and price direction.
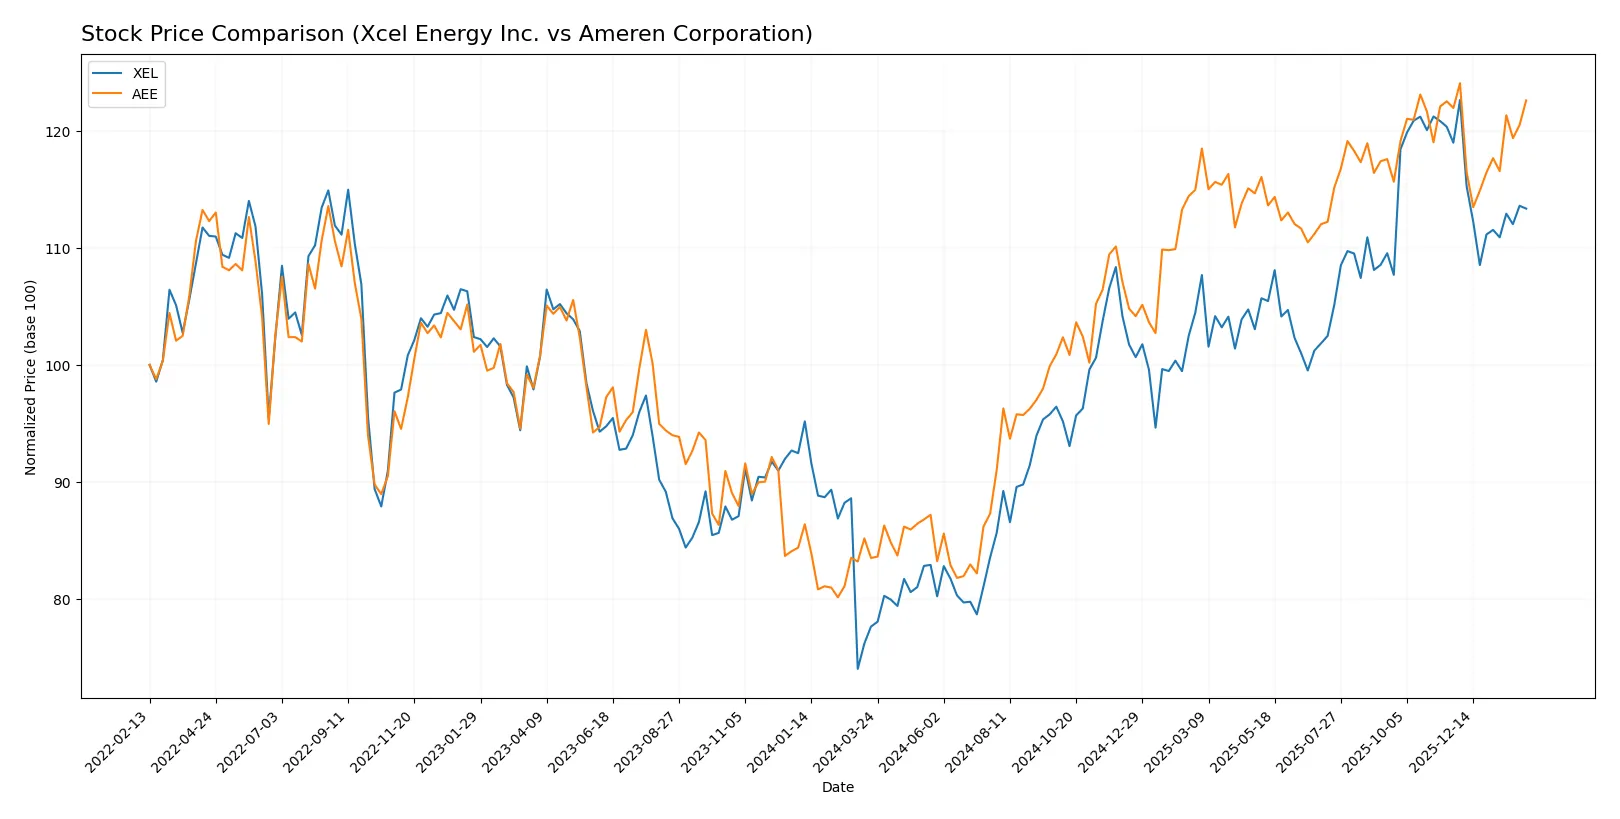
Trend Comparison
Xcel Energy Inc. (XEL) recorded a 46.0% price increase over the last year, marking a bullish trend with decelerating acceleration. The stock ranged between $52 and $82, but recent months show a slight bearish reversal of -4.7%.
Ameren Corporation (AEE) posted a 46.8% gain over the same period, also bullish with decelerating momentum. It traded between $70 and $106. Recent performance is neutral, with a minor 0.5% price rise and modest buyer dominance.
AEE slightly outperformed XEL over the year, maintaining positive recent trends, while XEL faced a recent price pullback amid seller dominance.
Target Prices
Analysts present a confident target price consensus for both Xcel Energy Inc. and Ameren Corporation.
| Company | Target Low | Target High | Consensus |
|---|---|---|---|
| Xcel Energy Inc. | 81 | 95 | 88 |
| Ameren Corporation | 104 | 116 | 111 |
The consensus targets for XEL and AEE imply upside potential of approximately 16% and 6% respectively versus current prices. Analysts expect steady growth in these regulated utilities.

Don’t Let Luck Decide Your Entry Point
Optimize your entry points with our advanced ProRealTime indicators. You’ll get efficient buy signals with precise price targets for maximum performance. Start outperforming now!
How do institutions grade them?
Institutional grades for Xcel Energy Inc. and Ameren Corporation show their current analyst sentiment:
Xcel Energy Inc. Grades
The following table summarizes recent analyst grades for Xcel Energy Inc.:
| Grading Company | Action | New Grade | Date |
|---|---|---|---|
| Barclays | maintain | Overweight | 2026-01-15 |
| UBS | maintain | Neutral | 2025-12-17 |
| Keybanc | maintain | Overweight | 2025-12-12 |
| JP Morgan | maintain | Overweight | 2025-12-11 |
| Barclays | maintain | Overweight | 2025-11-05 |
| Citigroup | maintain | Buy | 2025-11-03 |
| UBS | maintain | Neutral | 2025-10-31 |
| Mizuho | maintain | Outperform | 2025-10-27 |
| Jefferies | maintain | Buy | 2025-10-16 |
| Keybanc | maintain | Overweight | 2025-10-15 |
Ameren Corporation Grades
The following table summarizes recent analyst grades for Ameren Corporation:
| Grading Company | Action | New Grade | Date |
|---|---|---|---|
| Wells Fargo | maintain | Overweight | 2026-01-20 |
| Barclays | maintain | Equal Weight | 2026-01-15 |
| JP Morgan | maintain | Neutral | 2026-01-15 |
| UBS | maintain | Buy | 2025-12-17 |
| Keybanc | downgrade | Sector Weight | 2025-12-12 |
| Mizuho | maintain | Outperform | 2025-10-27 |
| Morgan Stanley | maintain | Equal Weight | 2025-10-22 |
| Barclays | maintain | Equal Weight | 2025-10-21 |
| Keybanc | maintain | Overweight | 2025-10-15 |
| Morgan Stanley | maintain | Equal Weight | 2025-09-25 |
Which company has the best grades?
Xcel Energy holds generally stronger grades, predominantly Overweight and Buy, signaling more favorable analyst sentiment. Ameren’s grades lean toward Equal Weight and Neutral, with one recent downgrade. This divergence may affect investor confidence and perceived upside potential.
Risks specific to each company
The following categories identify critical pressure points and systemic threats facing Xcel Energy Inc. and Ameren Corporation in the 2026 market environment:
1. Market & Competition
Xcel Energy Inc.
- Operates in diverse energy sources, balancing renewables and traditional fuels, defending regulated market share.
Ameren Corporation
- Focuses on rate-regulated electric and gas markets with steady demand but faces competition from emerging clean energy players.
2. Capital Structure & Debt
Xcel Energy Inc.
- Favorable debt-to-equity metrics; low financial leverage supports stability and creditworthiness.
Ameren Corporation
- Higher debt-to-equity ratio (1.55) elevates financial risk, potentially pressuring interest coverage in rising rate environments.
3. Stock Volatility
Xcel Energy Inc.
- Beta of 0.476 indicates lower volatility, offering defensive positioning in turbulent markets.
Ameren Corporation
- Beta of 0.586 shows moderate volatility; stock more sensitive to market swings than Xcel.
4. Regulatory & Legal
Xcel Energy Inc.
- Subject to multi-state regulatory frameworks with evolving renewable mandates increasing compliance complexity.
Ameren Corporation
- Operates under Missouri and Illinois regulations; potential regulatory risk from carbon emission policies and rate case outcomes.
5. Supply Chain & Operations
Xcel Energy Inc.
- Broad energy mix requires complex supply chain management; transition to renewables demands capital-intensive upgrades.
Ameren Corporation
- Reliant on coal, nuclear, gas, and renewables; operational efficiency challenged by aging assets and infrastructure modernization needs.
6. ESG & Climate Transition
Xcel Energy Inc.
- Actively investing in renewable projects; ESG efforts align with sector trends but transition costs pressure margins.
Ameren Corporation
- Faces pressure to accelerate clean energy adoption; ESG ratings impacted by slower transition pace and legacy coal assets.
7. Geopolitical Exposure
Xcel Energy Inc.
- Primarily US-focused with limited direct geopolitical risks; indirect impacts from federal energy policies.
Ameren Corporation
- Similar US-centric exposure; vulnerable to regional political shifts impacting energy regulation and infrastructure funding.
Which company shows a better risk-adjusted profile?
Xcel Energy’s strongest advantage is its conservative capital structure and lower stock volatility, cushioning it against market shocks. Ameren faces heightened financial leverage and regulatory risks but shows stronger profitability metrics. Xcel’s low beta and solid dividend yield make it more attractive for risk-conscious investors. However, Ameren’s higher ROE and moderate Piotroski score suggest operational resilience despite its distress-zone Altman Z-Score. The critical risks are Ameren’s debt load and Xcel’s operational challenges in asset turnover. Overall, Xcel exhibits a better risk-adjusted profile with a more robust balance sheet and defensive market position. The recent divergence in debt-to-equity ratios (0 vs. 1.55) justifies cautious optimism favoring Xcel.
Final Verdict: Which stock to choose?
Xcel Energy Inc. (XEL) shines as a resilient cash generator in a capital-intensive industry. Its strength lies in steady income and a solid dividend yield, though its declining ROIC and liquidity issues warrant caution. XEL suits investors targeting aggressive growth with a tolerance for operational complexity.
Ameren Corporation (AEE) leverages a strategic moat through robust gross margins and a more conservative capital structure. It offers relative safety with a more stable income profile, making it appealing for those seeking growth at a reasonable price and moderate risk exposure.
If you prioritize growth with a higher income yield, XEL is compelling due to its strong dividend and revenue growth despite some operational headwinds. However, if you seek better stability and a clearer moat, AEE outshines with its margin strength and balance sheet discipline, albeit at a modest premium. Each fits distinct investor profiles navigating the utility sector’s evolving landscape.
Disclaimer: Investment carries a risk of loss of initial capital. The past performance is not a reliable indicator of future results. Be sure to understand risks before making an investment decision.
Go Further
I encourage you to read the complete analyses of Xcel Energy Inc. and Ameren Corporation to enhance your investment decisions: