WEC Energy Group, Inc. and Ameren Corporation are two prominent players in the regulated electric utilities sector, each serving millions of customers with a mix of traditional and renewable energy sources. Both companies focus on innovation in energy transmission, distribution, and sustainability, operating across overlapping Midwestern U.S. markets. This article will carefully analyze their strategies and financial health to identify which presents the most compelling opportunity for investors like you.
Table of contents
Companies Overview
I will begin the comparison between WEC Energy Group and Ameren Corporation by providing an overview of these two companies and their main differences.
WEC Overview
WEC Energy Group, Inc. focuses on providing regulated natural gas, electricity, and renewable energy services across the United States. Operating through six segments, it generates and distributes electricity from diverse sources including coal, natural gas, hydroelectric, wind, and solar. The company manages extensive infrastructure with over 35,800 miles of overhead lines and 50,900 miles of natural gas distribution mains, positioning itself as a key player in the regulated electric utility sector.
Ameren Overview
Ameren Corporation operates as a public utility holding company, serving residential, commercial, and industrial customers primarily in Missouri and Illinois. Its operations include rate-regulated electric generation, transmission, and distribution, alongside natural gas distribution and transmission. Ameren generates electricity from coal, nuclear, natural gas, and renewable sources such as hydroelectric and wind, managing business through four main segments focused on regional utility services.
Key similarities and differences
Both WEC and Ameren operate in the regulated electric utility industry, providing electricity and natural gas services with a mix of fossil fuel and renewable energy generation. Each maintains a regional focus through segmented operations and offers transmission and distribution services. However, WEC has a broader geographic reach with six segments and larger infrastructure, while Ameren concentrates on fewer segments primarily covering Missouri and Illinois, with a notable inclusion of nuclear energy in its generation mix.
Income Statement Comparison
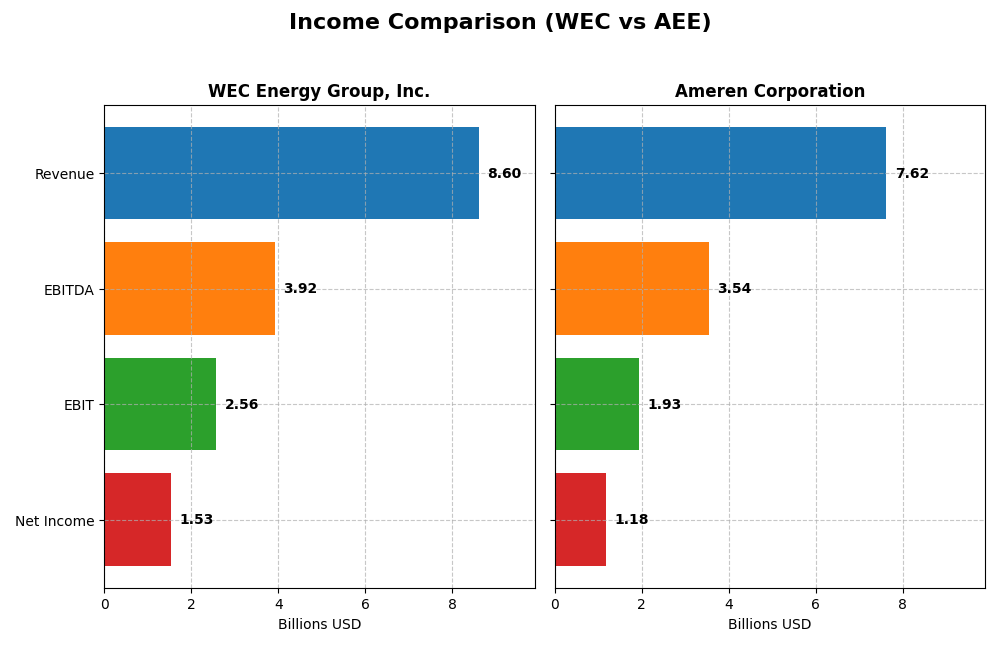
The table below presents a side-by-side comparison of key income statement metrics for WEC Energy Group, Inc. and Ameren Corporation for the fiscal year 2024.
| Metric | WEC Energy Group, Inc. | Ameren Corporation |
|---|---|---|
| Market Cap | 33.5B | 27.0B |
| Revenue | 8.60B | 7.62B |
| EBITDA | 3.92B | 3.54B |
| EBIT | 2.56B | 1.93B |
| Net Income | 1.53B | 1.18B |
| EPS | 4.81 | 4.43 |
| Fiscal Year | 2024 | 2024 |
Income Statement Interpretations
WEC Energy Group, Inc.
WEC Energy Group experienced an overall revenue growth of 18.76% from 2020 to 2024, with net income rising 27.25% over the same period. Margins show strength, especially with a favorable gross margin of 44.02% and net margin at 17.77%. Despite a 3.3% revenue decline in 2024, improved gross profit and EBIT margins signaled operational efficiency gains.
Ameren Corporation
Ameren’s revenue grew 31.57% from 2020 to 2024, with net income up 35.71%, reflecting solid top-line and bottom-line expansion. The company maintained a favorable gross margin of 47.92% and a net margin of 15.51%. However, recent growth slowed slightly in 2024, with modest EBIT and net margin improvements, and some unfavorable trends in operating expense growth relative to revenue.
Which one has the stronger fundamentals?
Both companies show favorable income statement fundamentals, but WEC’s higher net margin (17.77% vs. 15.51%) and more pronounced margin improvements suggest stronger profitability resilience. Ameren’s superior revenue growth (31.57% vs. 18.76%) and net income gains are offset by less margin expansion and some unfavorable recent expense trends, indicating a cautiously favorable outlook for both.
Financial Ratios Comparison
The table below presents key financial ratios for WEC Energy Group, Inc. and Ameren Corporation for the fiscal year 2024, allowing a side-by-side evaluation of their recent financial performance.
| Ratios | WEC Energy Group, Inc. | Ameren Corporation |
|---|---|---|
| ROE | 12.30% | 9.76% |
| ROIC | 4.14% | 3.32% |
| P/E | 19.46 | 20.12 |
| P/B | 2.39 | 1.96 |
| Current Ratio | 0.60 | 0.66 |
| Quick Ratio | 0.43 | 0.44 |
| D/E | 1.64 | 1.55 |
| Debt-to-Assets | 42.92% | 41.98% |
| Interest Coverage | 2.64 | 2.29 |
| Asset Turnover | 0.18 | 0.17 |
| Fixed Asset Turnover | 0.25 | 0.21 |
| Payout Ratio | 69.10% | 60.41% |
| Dividend Yield | 3.55% | 3.00% |
Interpretation of the Ratios
WEC Energy Group, Inc.
WEC shows a mixed ratio profile with a strong net margin at 17.77% and a favorable dividend yield of 3.55%, reflecting reliable shareholder returns. However, concerns arise from a low current ratio of 0.6 and high debt-to-equity at 1.64, indicating liquidity and leverage risks. The payout appears sustainable given the coverage by free cash flow.
Ameren Corporation
Ameren posts a favorable net margin of 15.51% and a dividend yield of 3.0%, demonstrating consistent shareholder value. Its current ratio of 0.66 and debt-to-equity of 1.55 are slightly better but still unfavorable, signaling moderate liquidity pressure and leverage. The dividend payout is supported but free cash flow remains negative, suggesting caution.
Which one has the best ratios?
Both companies have slightly unfavorable overall ratio evaluations, with WEC showing a marginally better return on equity and dividend yield. Ameren has a slightly lower leverage ratio but weaker returns. Given the balance of favorable and unfavorable metrics, neither company decisively outperforms the other in financial ratio strength.
Strategic Positioning
This section compares the strategic positioning of WEC Energy Group, Inc. and Ameren Corporation, focusing on Market position, Key segments, and Exposure to disruption:
WEC Energy Group, Inc.
- Market position in regulated electric utilities with moderate competitive pressure.
- Diversified across Wisconsin, Illinois, other states, and non-utility energy infrastructure.
- Exposure to technological disruption includes diverse energy sources including renewables.
Ameren Corporation
- Market position in regulated electric utilities with similar competitive pressure.
- Concentrated in electricity and natural gas segments primarily in Missouri and Illinois.
- Exposure to disruption through coal, nuclear, natural gas, and renewable energy generation sources.
WEC vs Ameren Positioning
WEC presents a diversified regional and business segment approach, including non-utility infrastructure, offering broader revenue streams. Ameren is more concentrated in electric and natural gas utilities, which may imply more focused but less diversified operations.
Which has the best competitive advantage?
Both companies are shedding value as ROIC is below WACC. WEC shows a growing ROIC trend, indicating improving profitability, whereas Ameren faces declining ROIC and worsening profitability, implying WEC has a relatively stronger competitive advantage.
Stock Comparison
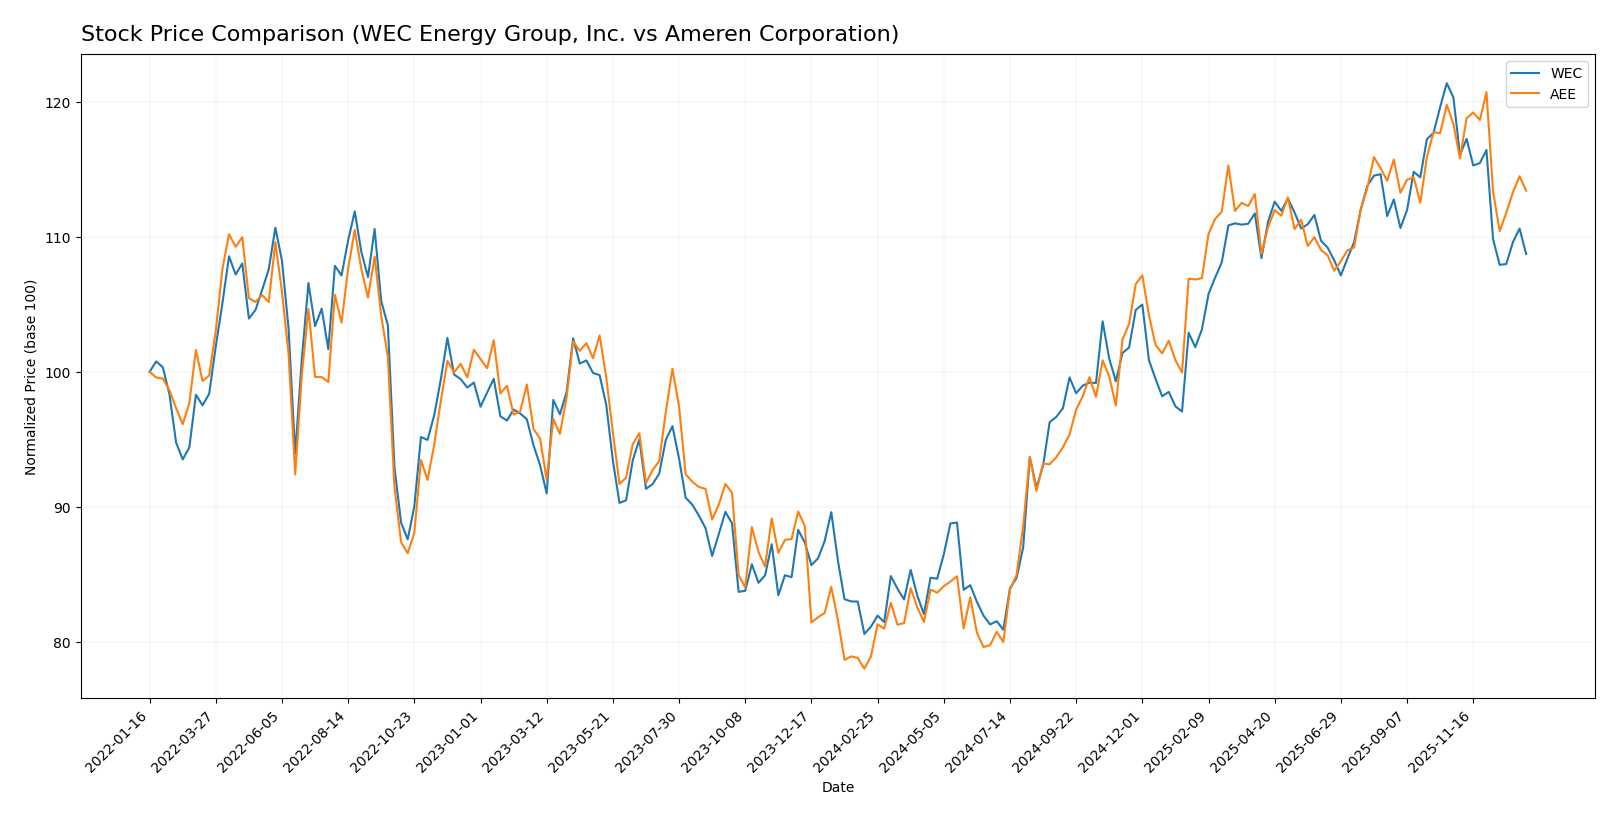
The past year reveals distinct bullish trends for both WEC Energy Group, Inc. and Ameren Corporation, marked by significant price gains followed by a recent deceleration phase and mild downward momentum in trading dynamics.
Trend Analysis
WEC Energy Group, Inc. showed a bullish trend over the past 12 months with a 34.05% price increase, though the trend exhibited deceleration. Recent weeks saw a 9.65% decline with a slight negative slope, signaling short-term weakness.
Ameren Corporation posted a stronger annual bullish trend with a 43.73% price rise, also decelerating. In the recent period, the price fell 4.19% with a moderate negative slope, indicating some short-term pressure.
Comparing both stocks, Ameren Corporation delivered the highest market performance over the last year, outperforming WEC by nearly 10 percentage points despite similar deceleration and recent declines.
Target Prices
Analysts present a clear consensus on target prices for WEC Energy Group, Inc. and Ameren Corporation.
| Company | Target High | Target Low | Consensus |
|---|---|---|---|
| WEC Energy Group, Inc. | 136 | 105 | 122.67 |
| Ameren Corporation | 119 | 103 | 111.86 |
The consensus target prices suggest upside potential for both stocks compared to their current prices of $104.65 for WEC and $99.91 for Ameren. Analysts expect moderate growth within the regulated electric sector.
Analyst Opinions Comparison
This section compares analysts’ ratings and grades for WEC Energy Group, Inc. (WEC) and Ameren Corporation (AEE):
Rating Comparison
WEC Rating
- Rating: B-, considered very favorable by analysts.
- Discounted Cash Flow Score: 1, indicating very unfavorable valuation.
- ROE Score: 4, reflecting favorable efficiency in equity use.
- ROA Score: 4, showing favorable asset utilization.
- Debt To Equity Score: 2, moderate financial risk.
- Overall Score: 3, a moderate summary rating.
AEE Rating
- Rating: B-, also regarded as very favorable by analysts.
- Discounted Cash Flow Score: 1, signaling very unfavorable valuation.
- ROE Score: 4, similarly favorable in generating profit from equity.
- ROA Score: 3, indicating moderate effectiveness in asset use.
- Debt To Equity Score: 2, also moderate financial risk.
- Overall Score: 2, a moderate but slightly lower summary rating.
Which one is the best rated?
Both WEC and AEE share the same overall rating of B- and very favorable analyst status. WEC has a slightly higher overall score and a better ROA score, while AEE’s scores are mostly moderate, placing WEC marginally above AEE based strictly on the provided data.
Scores Comparison
Here is a comparison of the Altman Z-Score and Piotroski Score for WEC and AEE:
WEC Scores
- Altman Z-Score: 1.14, indicating distress zone
- Piotroski Score: 6, classified as average
AEE Scores
- Altman Z-Score: 0.97, indicating distress zone
- Piotroski Score: 6, classified as average
Which company has the best scores?
Both WEC and AEE are in the distress zone based on Altman Z-Scores and have average Piotroski Scores of 6. Neither company shows a clear advantage in financial strength from these scores.
Grades Comparison
The following presents a detailed comparison of recent grades assigned to WEC Energy Group, Inc. and Ameren Corporation by reputable grading companies:
WEC Energy Group, Inc. Grades
The table below summarizes recent grades from recognized grading firms for WEC Energy Group, Inc.:
| Grading Company | Action | New Grade | Date |
|---|---|---|---|
| B of A Securities | Maintain | Neutral | 2025-12-31 |
| UBS | Maintain | Neutral | 2025-12-17 |
| Barclays | Maintain | Underweight | 2025-12-16 |
| Keybanc | Maintain | Overweight | 2025-12-12 |
| JP Morgan | Maintain | Neutral | 2025-12-11 |
| Scotiabank | Maintain | Sector Outperform | 2025-10-31 |
| BMO Capital | Maintain | Market Perform | 2025-10-21 |
| Barclays | Maintain | Equal Weight | 2025-10-21 |
| Keybanc | Maintain | Overweight | 2025-10-15 |
| UBS | Maintain | Neutral | 2025-10-10 |
WEC’s grades predominantly reflect a neutral to slightly positive stance, with a mix of Neutral, Overweight, and Sector Outperform ratings.
Ameren Corporation Grades
The table below summarizes recent grades from recognized grading firms for Ameren Corporation:
| Grading Company | Action | New Grade | Date |
|---|---|---|---|
| UBS | Maintain | Buy | 2025-12-17 |
| Keybanc | Downgrade | Sector Weight | 2025-12-12 |
| Mizuho | Maintain | Outperform | 2025-10-27 |
| Morgan Stanley | Maintain | Equal Weight | 2025-10-22 |
| Barclays | Maintain | Equal Weight | 2025-10-21 |
| Keybanc | Maintain | Overweight | 2025-10-15 |
| Morgan Stanley | Maintain | Equal Weight | 2025-09-25 |
| Keybanc | Maintain | Overweight | 2025-07-16 |
| UBS | Maintain | Buy | 2025-07-11 |
| Barclays | Maintain | Equal Weight | 2025-07-10 |
Ameren shows a generally positive outlook with several Buy and Outperform ratings, although some recent downgrades to Sector Weight and multiple Equal Weight ratings indicate moderate caution.
Which company has the best grades?
Ameren Corporation has received comparatively stronger grades, including multiple Buy and Outperform ratings, while WEC Energy Group’s ratings lean more toward Neutral and Hold. This difference could affect investor sentiment by reflecting slightly higher confidence in Ameren’s near-term prospects.
Strengths and Weaknesses
Below is a comparative table summarizing key strengths and weaknesses of WEC Energy Group, Inc. (WEC) and Ameren Corporation (AEE) based on their latest financial and operational data.
| Criterion | WEC Energy Group, Inc. (WEC) | Ameren Corporation (AEE) |
|---|---|---|
| Diversification | Moderate: Revenue spread across Illinois, Wisconsin, other states, and non-utility infrastructure segments. | Moderate: Primarily electricity and natural gas segments with some regional focus. |
| Profitability | Moderate: Net margin 17.77%, ROE neutral at 12.3%, but ROIC unfavorable at 4.14%. | Moderate to low: Net margin 15.51%, ROE unfavorable at 9.76%, ROIC unfavorable at 3.32%. |
| Innovation | Slightly unfavorable economic moat but improving ROIC trend suggests growing operational efficiency. | Very unfavorable economic moat with declining ROIC, indicating challenges in sustaining competitive advantage. |
| Global presence | Limited: Mainly regional within the US Midwest states. | Limited: Focused on US Midwest region, no significant global footprint. |
| Market Share | Strong presence in Wisconsin and Illinois utility markets, with steady revenue growth. | Strong regional presence in electricity and natural gas, but profitability and efficiency declining. |
Key takeaways: WEC demonstrates a stronger operational footprint with improving profitability trends despite a slightly unfavorable economic moat. Ameren faces more challenges with declining profitability and competitive position. Both companies have moderate diversification but are regionally focused, which limits global exposure. Investors should weigh WEC’s upward profitability trend against AEE’s downward trajectory when considering risk and growth potential.
Risk Analysis
Below is a comparative overview of key risk factors for WEC Energy Group, Inc. (WEC) and Ameren Corporation (AEE) based on the most recent 2024 data.
| Metric | WEC Energy Group, Inc. (WEC) | Ameren Corporation (AEE) |
|---|---|---|
| Market Risk | Beta 0.57 — low volatility, moderate market sensitivity | Beta 0.59 — low volatility, moderate market sensitivity |
| Debt level | Debt-to-Equity 1.64 (unfavorable), Debt-to-Assets 42.9% (neutral) | Debt-to-Equity 1.55 (unfavorable), Debt-to-Assets 42.0% (neutral) |
| Regulatory Risk | High, due to regulated electric and gas operations in multiple states | High, similar regulated utility exposure in Missouri and Illinois |
| Operational Risk | Moderate, with extensive infrastructure (70K miles of lines), aging assets risk | Moderate, with diverse energy generation sources and extensive grid |
| Environmental Risk | Significant, reliance on fossil fuels and renewables; transitioning challenges | Significant, includes coal, nuclear, gas, and renewables; regulatory pressure |
| Geopolitical Risk | Low to moderate, mostly US-based operations but sensitive to energy policies | Low to moderate, US operations but exposed to regional policy shifts |
WEC and Ameren both face considerable regulatory and environmental risks, given their regulated utility status and energy mix including fossil fuels. Debt levels are moderately high, posing financial risk, while low beta values indicate limited market volatility exposure. Notably, both companies have Altman Z-Scores in the distress zone, signaling potential financial vulnerability despite average Piotroski scores, highlighting the need for cautious risk management.
Which Stock to Choose?
WEC Energy Group, Inc. shows a favorable income statement with strong margins and steady income growth over 2020-2024. Its financial ratios reveal mixed signals, with several unfavorable liquidity and efficiency metrics but a favorable dividend yield. The company carries moderate debt and holds a very favorable B- rating, although its Altman Z-Score indicates financial distress.
Ameren Corporation also presents a favorable income statement with positive revenue and net income growth. However, its financial ratios are slightly less favorable than WEC’s, with a higher proportion of unfavorable indicators and moderate debt levels. Ameren shares the same very favorable B- rating but has a lower Altman Z-Score, suggesting greater financial risk.
Investors prioritizing income statement strength and dividend stability might view WEC as more favorable due to better profitability and a stable rating, despite its financial distress signals. Conversely, those with a higher risk tolerance or seeking growth could find Ameren’s recent revenue gains appealing, though its declining profitability might caution more conservative profiles.
Disclaimer: Investment carries a risk of loss of initial capital. The past performance is not a reliable indicator of future results. Be sure to understand risks before making an investment decision.
Go Further
I encourage you to read the complete analyses of WEC Energy Group, Inc. and Ameren Corporation to enhance your investment decisions: