In the evolving landscape of regulated electric utilities, The Southern Company (SO) and Ameren Corporation (AEE) stand out as major players shaping the future of energy. Both operate across electricity generation, transmission, and distribution, with growing investments in renewable energy and infrastructure innovation. Their market overlap and strategic approaches to sustainable power make this comparison essential. Join me as we analyze which company offers the most compelling opportunity for investors today.
Table of contents
Companies Overview
I will begin the comparison between The Southern Company and Ameren Corporation by providing an overview of these two companies and their main differences.
The Southern Company Overview
The Southern Company, based in Atlanta, Georgia, is a major player in the regulated electric utility sector. It focuses on electricity generation, transmission, and distribution, along with natural gas operations across several states. The company manages a diverse energy portfolio including fossil fuel, nuclear, hydroelectric, solar, wind, and battery storage facilities, serving approximately 8.7M customers.
Ameren Corporation Overview
Ameren Corporation, headquartered in St. Louis, Missouri, operates as a public utility holding company with a focus on rate-regulated electric and natural gas distribution and transmission. It generates electricity from coal, nuclear, natural gas, and renewable sources such as hydroelectric, wind, methane gas, and solar. Ameren serves residential, commercial, and industrial clients primarily in Missouri and Illinois.
Key similarities and differences
Both companies operate in the regulated electric utility industry with integrated electricity and natural gas services. They share a commitment to renewable energy sources alongside traditional generation methods. However, Southern Company is larger by market cap and customer base, with a broader geographic reach and more diverse energy assets, while Ameren operates mainly in two states with fewer employees and a smaller market capitalization.
Income Statement Comparison
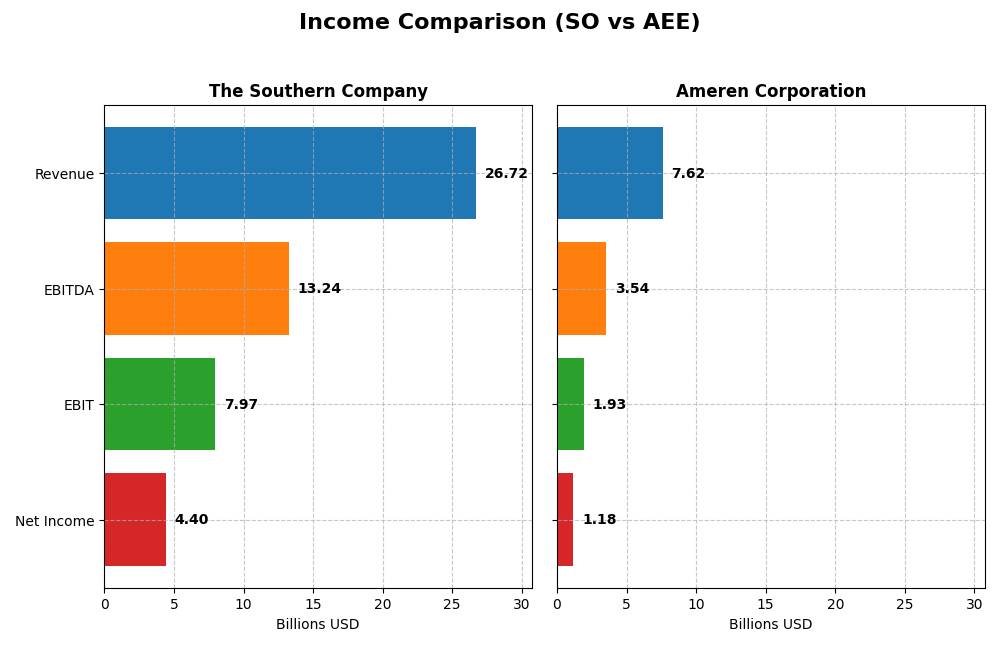
The following table compares the most recent fiscal year income statement figures for The Southern Company and Ameren Corporation, highlighting key financial metrics for 2024.
| Metric | The Southern Company (SO) | Ameren Corporation (AEE) |
|---|---|---|
| Market Cap | 95.7B | 27.0B |
| Revenue | 26.7B | 7.6B |
| EBITDA | 13.2B | 3.5B |
| EBIT | 8.0B | 1.9B |
| Net Income | 4.4B | 1.2B |
| EPS | 4.02 | 4.43 |
| Fiscal Year | 2024 | 2024 |
Income Statement Interpretations
The Southern Company
The Southern Company showed steady revenue growth from 20.4B in 2020 to 26.7B in 2024, with net income rising from 3.1B to 4.4B over the same period. Gross and EBIT margins remained favorable, around 50% and 30% respectively. In 2024, revenue growth slowed moderately, but profitability improved with a 17.4% EBIT increase and a slight net margin expansion.
Ameren Corporation
Ameren’s revenue increased from 5.8B in 2020 to 7.6B in 2024, while net income grew from 871M to 1.18B. Gross margin stood at a favorable 47.9%, with EBIT margin at 25.4%. However, 2024 showed a modest 1.6% revenue growth and nearly flat net margin, reflecting slower top-line growth but stable profitability metrics.
Which one has the stronger fundamentals?
The Southern Company exhibits stronger fundamentals with higher revenue and net income growth rates, coupled with superior gross and EBIT margins. Ameren maintains favorable margins but shows slower recent growth and more neutral margin trends. Both companies have favorable income statements, yet Southern’s more robust profitability and growth metrics suggest comparatively stronger financial health.
Financial Ratios Comparison
Below is a comparison of key financial ratios for The Southern Company (SO) and Ameren Corporation (AEE) based on their most recent fiscal year 2024 data.
| Ratios | The Southern Company (SO) | Ameren Corporation (AEE) |
|---|---|---|
| ROE | 13.3% | 9.8% |
| ROIC | 4.3% | 3.3% |
| P/E | 20.5 | 20.1 |
| P/B | 2.72 | 1.96 |
| Current Ratio | 0.67 | 0.66 |
| Quick Ratio | 0.46 | 0.44 |
| D/E (Debt-to-Equity) | 2.00 | 1.55 |
| Debt-to-Assets | 45.7% | 42.0% |
| Interest Coverage | 2.58 | 2.29 |
| Asset Turnover | 0.18 | 0.17 |
| Fixed Asset Turnover | 0.25 | 0.21 |
| Payout ratio | 67.1% | 60.4% |
| Dividend yield | 3.27% | 3.00% |
Interpretation of the Ratios
The Southern Company
The Southern Company shows a mixed ratio profile with a favorable net margin of 16.47% and a dividend yield of 3.27%, indicating solid profitability and shareholder returns. However, several weaknesses exist, including a low current ratio of 0.67 and high debt-to-equity at 2.0, suggesting liquidity and leverage concerns. The payout appears sustainable, supported by dividends and moderate buybacks.
Ameren Corporation
Ameren Corporation’s financial ratios reveal a favorable net margin of 15.51% and a dividend yield of 3.0%, reflecting reasonable profitability and shareholder income. Yet, the company faces challenges with a low current ratio of 0.66 and an unfavorable return on equity of 9.76%. Debt levels are slightly lower than The Southern Company but still raise caution about leverage and liquidity.
Which one has the best ratios?
Both companies present slightly unfavorable overall ratios, with The Southern Company and Ameren showing similar dividend yields and profitability. The Southern Company has a marginally better return on equity but higher leverage, while Ameren’s leverage is lower but with weaker returns. Each company exhibits strengths and weaknesses, requiring careful consideration of specific ratio impacts.
Strategic Positioning
This section compares the strategic positioning of The Southern Company and Ameren Corporation across market position, key segments, and exposure to technological disruption:
The Southern Company
- Leading regulated electric utility with 8.7M customers, facing typical competitive pressures in the US utilities sector.
- Diverse segments including gas distribution, pipeline investments, wholesale gas, renewable energy, and electric utilities.
- Significant investments in renewable energy, hydro, wind, solar, nuclear, and battery storage mitigate tech disruption risk.
Ameren Corporation
- Mid-sized regulated electric and gas utility serving residential, commercial, and industrial customers.
- Operates through four regulated segments focused on electricity and natural gas generation and delivery.
- Generates electricity from coal, nuclear, gas, and renewable sources; exposure to evolving energy mix risks.
The Southern Company vs Ameren Corporation Positioning
The Southern Company adopts a more diversified approach, spanning multiple energy sources and services, while Ameren concentrates on regulated electric and natural gas segments. Southern’s scale and renewables focus offer broad exposure, whereas Ameren is more regionally concentrated.
Which has the best competitive advantage?
Both companies are currently shedding value with ROIC below WACC, but Southern shows a growing ROIC trend indicating improving profitability, while Ameren’s declining ROIC suggests worsening financial efficiency. Southern’s moat status is slightly unfavorable versus Ameren’s very unfavorable.
Stock Comparison
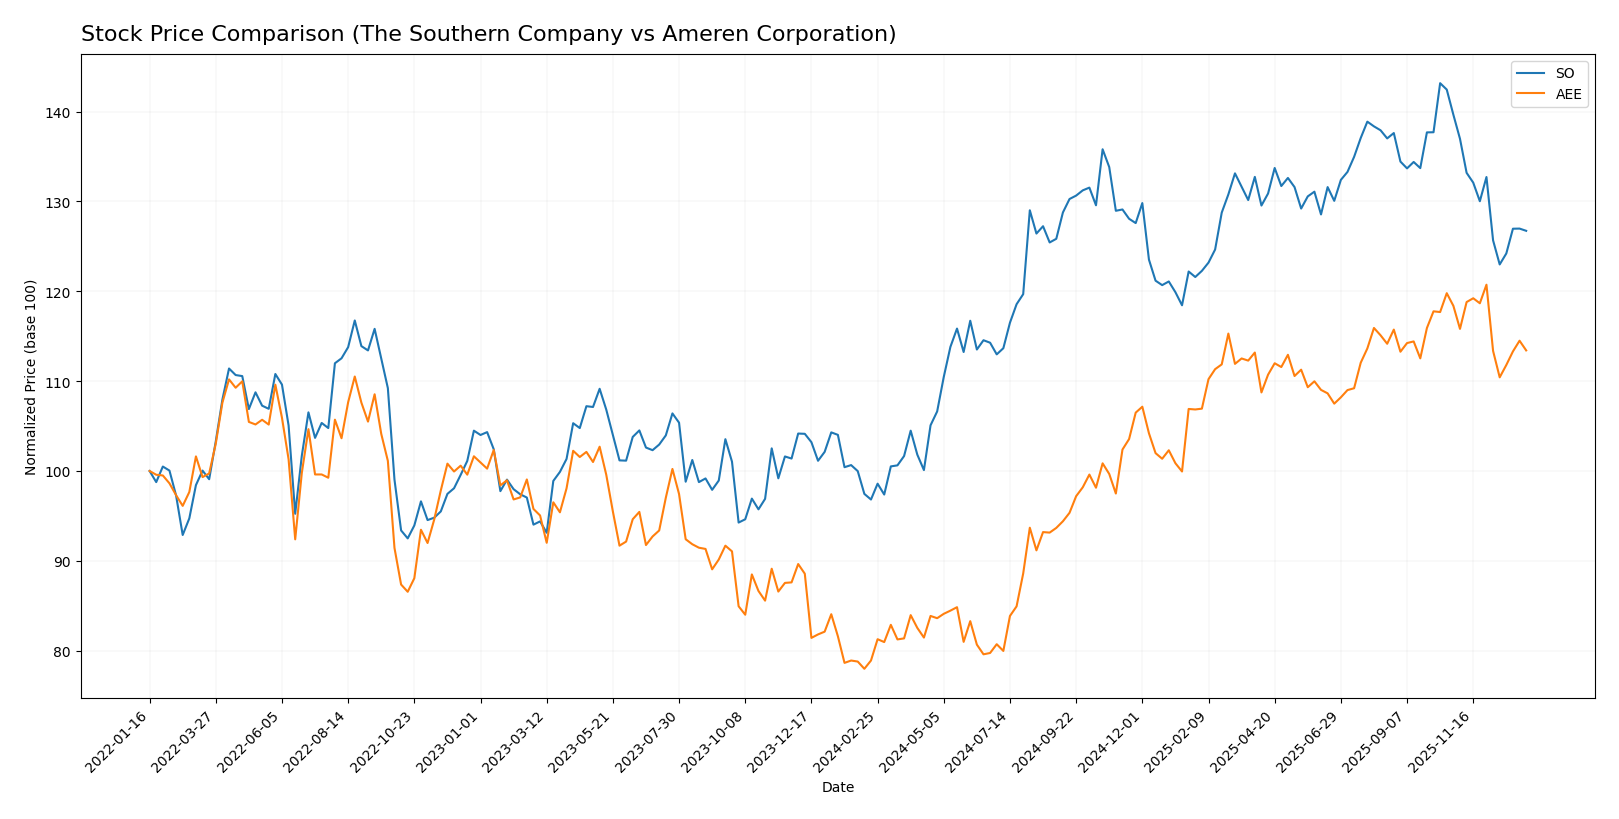
The past year has seen The Southern Company (SO) and Ameren Corporation (AEE) exhibit strong bullish trends overall, with both stocks experiencing deceleration in upward momentum and recent downward corrections in price.
Trend Analysis
The Southern Company’s stock rose 30.88% over the past 12 months, indicating a bullish trend with decelerating momentum. It reached a high of 98.29 and a low of 66.48, showing moderate volatility with a standard deviation of 7.54.
Ameren Corporation’s stock gained 43.73% over the same period, also bullish with deceleration. It showed higher volatility (std deviation 11.4), hitting a peak of 106.35 and a low of 69.51, reflecting stronger price swings.
Comparing both, Ameren delivered the highest market performance over the past year with a 43.73% gain versus Southern Company’s 30.88%, despite both experiencing recent short-term declines.
Target Prices
Analysts provide a clear target price consensus indicating potential upside for both companies.
| Company | Target High | Target Low | Consensus |
|---|---|---|---|
| The Southern Company | 103 | 76 | 93.1 |
| Ameren Corporation | 119 | 103 | 111.86 |
The Southern Company’s consensus target of 93.1 suggests moderate upside from its current price of 87.01. Ameren’s consensus target of 111.86 indicates a stronger expected appreciation compared to its current price of 99.91.
Analyst Opinions Comparison
This section compares analysts’ ratings and grades for The Southern Company (SO) and Ameren Corporation (AEE):
Rating Comparison
SO Rating
- Rating: B-, considered Very Favorable by analysts.
- Discounted Cash Flow Score: 3, indicating a moderate valuation outlook.
- ROE Score: 4, a favorable indicator of efficient profit generation.
- ROA Score: 3, moderate effectiveness in utilizing assets.
- Debt To Equity Score: 1, very unfavorable, indicating higher financial risk.
- Overall Score: 3, categorized as moderate financial standing.
AEE Rating
- Rating: B-, also rated Very Favorable by analysts.
- Discounted Cash Flow Score: 1, suggesting a very unfavorable valuation.
- ROE Score: 4, equally favorable showing efficient equity use.
- ROA Score: 3, same moderate asset utilization score.
- Debt To Equity Score: 2, moderate score indicating lower financial risk.
- Overall Score: 2, also considered moderate but lower than SO’s score.
Which one is the best rated?
Both SO and AEE share the same overall rating of B- and a favorable ROE score of 4. SO outperforms AEE in discounted cash flow and overall scores but has a weaker debt-to-equity score, indicating higher financial risk. AEE has a better debt position but lower overall and DCF scores.
Scores Comparison
Here is a comparison of the financial scores for The Southern Company and Ameren Corporation:
The Southern Company Scores
- Altman Z-Score: 0.98, indicating financial distress
- Piotroski Score: 6, reflecting average financial strength
Ameren Corporation Scores
- Altman Z-Score: 0.97, indicating financial distress
- Piotroski Score: 6, reflecting average financial strength
Which company has the best scores?
Both companies have Altman Z-Scores in the distress zone, signaling potential financial risk. Their Piotroski Scores are identical at 6, indicating average financial health. Neither company shows a clear advantage based on these scores.
Grades Comparison
The following presents a detailed comparison of the recent grades for The Southern Company and Ameren Corporation:
The Southern Company Grades
This table summarizes recent grades assigned to The Southern Company by reputable grading firms.
| Grading Company | Action | New Grade | Date |
|---|---|---|---|
| UBS | Maintain | Neutral | 2025-12-17 |
| JP Morgan | Maintain | Neutral | 2025-12-15 |
| Jefferies | Maintain | Neutral | 2025-12-15 |
| RBC Capital | Maintain | Sector Perform | 2025-12-12 |
| Keybanc | Maintain | Underweight | 2025-12-12 |
| Mizuho | Maintain | Neutral | 2025-12-11 |
| Barclays | Maintain | Equal Weight | 2025-11-20 |
| Jefferies | Downgrade | Neutral | 2025-11-05 |
| Ladenburg Thalmann | Downgrade | Neutral | 2025-10-17 |
| Keybanc | Maintain | Underweight | 2025-10-15 |
Overall, The Southern Company’s grades show a consistent neutral to underweight stance with recent downgrades from buy positions, indicating a cautious outlook from analysts.
Ameren Corporation Grades
This table shows recent grades awarded to Ameren Corporation by recognized grading firms.
| Grading Company | Action | New Grade | Date |
|---|---|---|---|
| UBS | Maintain | Buy | 2025-12-17 |
| Keybanc | Downgrade | Sector Weight | 2025-12-12 |
| Mizuho | Maintain | Outperform | 2025-10-27 |
| Morgan Stanley | Maintain | Equal Weight | 2025-10-22 |
| Barclays | Maintain | Equal Weight | 2025-10-21 |
| Keybanc | Maintain | Overweight | 2025-10-15 |
| Morgan Stanley | Maintain | Equal Weight | 2025-09-25 |
| Keybanc | Maintain | Overweight | 2025-07-16 |
| UBS | Maintain | Buy | 2025-07-11 |
| Barclays | Maintain | Equal Weight | 2025-07-10 |
Ameren Corporation’s grades generally trend positive with multiple buy and outperform ratings, although a recent downgrade to sector weight from overweight suggests some moderation in enthusiasm.
Which company has the best grades?
Comparing both, Ameren Corporation has received stronger and more consistently positive grades than The Southern Company, which predominantly holds neutral or underweight ratings. This disparity could influence investors’ perspectives on growth potential and risk exposure between the two utilities.
Strengths and Weaknesses
Below is a comparative table of key strengths and weaknesses for The Southern Company (SO) and Ameren Corporation (AEE) based on the latest financial and operational data.
| Criterion | The Southern Company (SO) | Ameren Corporation (AEE) |
|---|---|---|
| Diversification | Broad energy portfolio including gas distribution ($4.46B in 2024) and electric utilities | Focused on electricity ($6.54B) and natural gas ($1.08B) |
| Profitability | Net margin 16.47% (favorable), ROIC 4.25% (unfavorable), slight value destruction but improving ROIC trend | Net margin 15.51% (favorable), ROIC 3.32% (unfavorable), value destruction with declining ROIC |
| Innovation | Moderate, with gradual ROIC improvement indicating operational progress | Limited innovation as indicated by declining profitability metrics |
| Global presence | Primarily US-focused utilities, limited global reach | Primarily US regional utility, no significant global exposure |
| Market Share | Large scale in gas and electric utilities markets, strong revenue base | Smaller scale than SO but consistent growth in electricity revenues |
Key takeaways: Southern Company shows a more diversified energy mix and improving profitability trends despite current value destruction, while Ameren struggles with declining returns and less diversification. Both face challenges in ROIC, signaling cautious investment consideration.
Risk Analysis
Below is a comparative table summarizing key risk factors for The Southern Company (SO) and Ameren Corporation (AEE) based on the latest data from 2024.
| Metric | The Southern Company (SO) | Ameren Corporation (AEE) |
|---|---|---|
| Market Risk | Low beta (0.447) suggests lower volatility | Moderate beta (0.592), slightly higher volatility |
| Debt level | High debt-to-equity ratio (2.0), unfavorable | Elevated debt-to-equity (1.55), unfavorable but lower than SO |
| Regulatory Risk | Moderate, utilities are highly regulated | Moderate, similar regulatory exposure |
| Operational Risk | Diverse generation mix including nuclear and renewables | Coal, nuclear, gas, renewables; operational complexity moderate |
| Environmental Risk | Exposure from fossil fuel and nuclear assets | Similar exposure with coal and nuclear reliance |
| Geopolitical Risk | Low, primarily US-focused | Low, primarily US-focused |
In synthesis, both companies face significant debt-related risks, with Southern Company carrying a heavier debt burden, raising financial risk concerns. Operational and environmental risks stem from their fossil fuel and nuclear assets, which are increasingly scrutinized. Market risk is relatively low for both, but Ameren’s slightly higher beta indicates more price sensitivity. Regulatory risks remain consistent due to their utility sector nature. Investors should weigh debt levels and environmental transition risks carefully.
Which Stock to Choose?
The Southern Company (SO) shows a favorable income evolution with 71% positive income statement metrics, a mixed financial ratios profile slightly unfavorable overall, profitability marked by a 13.25% ROE and 16.47% net margin, elevated debt levels with a 2.0 debt-to-equity ratio, and a very favorable B- rating reflecting moderate strengths and weaknesses.
Ameren Corporation (AEE) also demonstrates favorable income growth with 50% favorable income metrics, a slightly more unfavorable financial ratios profile, lower profitability at 9.76% ROE and 15.51% net margin, somewhat lower debt leverage with a 1.55 debt-to-equity ratio, and a similarly rated B- score though with a very unfavorable discounted cash flow score.
Considering the ratings and financial evaluations, SO might appear more suitable for investors seeking higher profitability and income growth potential despite leverage risks, while AEE could be interpreted as fitting for those prioritizing moderate stability with somewhat lower profitability but less aggressive debt. Growth-focused investors may lean toward SO, whereas those with a cautious profile might see AEE as relatively more conservative.
Disclaimer: Investment carries a risk of loss of initial capital. The past performance is not a reliable indicator of future results. Be sure to understand risks before making an investment decision.
Go Further
I encourage you to read the complete analyses of The Southern Company and Ameren Corporation to enhance your investment decisions: