Public Service Enterprise Group Incorporated (PEG) and Ameren Corporation (AEE) are two prominent players in the regulated electric utility sector in the United States. Both companies operate extensive transmission and distribution networks while advancing renewable energy initiatives, making them key competitors in a transforming energy landscape. This comparison will help investors understand which company offers a more compelling opportunity in terms of growth, stability, and innovation. Let’s explore their strengths to identify the best fit for your portfolio.
Table of contents
Companies Overview
I will begin the comparison between Public Service Enterprise Group Incorporated and Ameren Corporation by providing an overview of these two companies and their main differences.
Public Service Enterprise Group Incorporated Overview
Public Service Enterprise Group Incorporated (PEG) operates as an energy company primarily in the Northeastern and Mid-Atlantic United States. It focuses on electricity transmission, distribution of electricity and gas, solar generation projects, and energy efficiency programs. The company manages extensive electric and gas infrastructure, serving residential, commercial, and industrial customers, and is headquartered in Newark, New Jersey.
Ameren Corporation Overview
Ameren Corporation (AEE) is a public utility holding company operating mainly in Missouri and Illinois. It generates, transmits, and distributes electricity and natural gas through four segments, using coal, nuclear, natural gas, and renewable sources. Ameren serves residential, commercial, and industrial clients and is based in St. Louis, Missouri. It has a diversified energy generation portfolio including hydroelectric and wind power.
Key similarities and differences
Both PEG and AEE operate in the regulated electric utility sector, serving a mix of residential, commercial, and industrial customers. They focus on electricity distribution and natural gas services, with investments in renewable energy. PEG has a larger market cap and employee base, and its operations are concentrated in the Northeast and Mid-Atlantic, while AEE covers Missouri and Illinois with a more diversified energy generation mix including coal and nuclear.
Income Statement Comparison
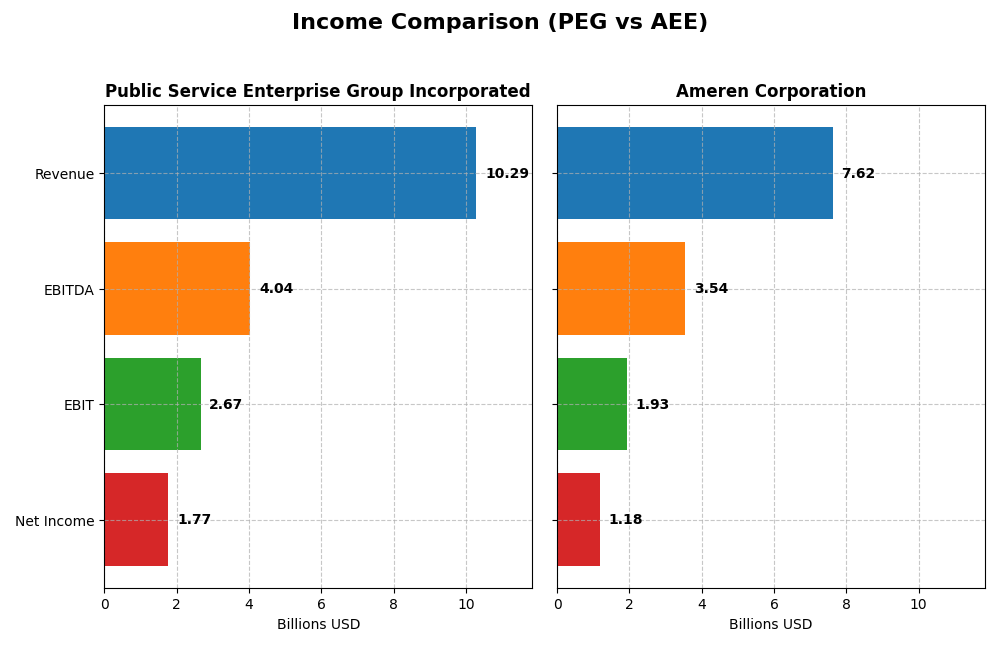
This table compares the key income statement metrics for Public Service Enterprise Group Incorporated and Ameren Corporation for the fiscal year 2024.
| Metric | Public Service Enterprise Group Incorporated (PEG) | Ameren Corporation (AEE) |
|---|---|---|
| Market Cap | 39.3B | 27.0B |
| Revenue | 10.3B | 7.6B |
| EBITDA | 4.0B | 3.5B |
| EBIT | 2.7B | 1.9B |
| Net Income | 1.8B | 1.2B |
| EPS | 3.56 | 4.43 |
| Fiscal Year | 2024 | 2024 |
Income Statement Interpretations
Public Service Enterprise Group Incorporated
Public Service Enterprise Group (PEG) experienced modest revenue growth of 7.15% over 2020-2024 but faced a net income decline of 6.98%. Margins showed a favorable gross margin at 34.41% and net margin at 17.22%, yet both contracted over the period. In 2024, revenue dropped 8.43% and net income declined sharply by 30.99%, indicating recent profitability pressures.
Ameren Corporation
Ameren Corporation (AEE) posted solid revenue growth of 31.57% and net income growth of 35.71% over 2020-2024. Margins were consistently strong with a favorable gross margin of 47.92% and net margin of 15.51%. In 2024, revenue grew slightly by 1.64% and net income increased by 0.91%, reflecting stable and improving profitability metrics amid a steady operational environment.
Which one has the stronger fundamentals?
Ameren Corporation demonstrates stronger fundamentals with robust revenue and net income growth over the period, alongside consistently favorable margin trends. Conversely, Public Service Enterprise Group shows weaker recent performance with declining profitability and less margin stability. Ameren’s favorable overall income statement evaluation contrasts with PEG’s predominantly unfavorable assessment.
Financial Ratios Comparison
This table presents a side-by-side comparison of key financial ratios for Public Service Enterprise Group Incorporated (PEG) and Ameren Corporation (AEE) based on their most recent fiscal year data (2024).
| Ratios | Public Service Enterprise Group Incorporated (PEG) | Ameren Corporation (AEE) |
|---|---|---|
| ROE | 10.9966% | 9.7573% |
| ROIC | 4.4015% | 3.3226% |
| P/E | 23.74 | 20.12 |
| P/B | 2.61 | 1.96 |
| Current Ratio | 0.65 | 0.66 |
| Quick Ratio | 0.48 | 0.44 |
| D/E (Debt to Equity) | 1.42 | 1.55 |
| Debt-to-Assets | 41.89% | 41.98% |
| Interest Coverage | 2.80 | 2.29 |
| Asset Turnover | 0.19 | 0.17 |
| Fixed Asset Turnover | 0.26 | 0.21 |
| Payout ratio | 67.49% | 60.41% |
| Dividend yield | 2.84% | 3.00% |
Interpretation of the Ratios
Public Service Enterprise Group Incorporated
Public Service Enterprise Group shows a mix of ratio strengths and weaknesses. Its net margin is favorable at 17.22%, but return on invested capital (ROIC) and liquidity ratios like current and quick ratios are unfavorable, indicating potential operational efficiency and short-term solvency concerns. Debt-to-equity is also unfavorable, suggesting higher leverage risk. The company offers a dividend with a 2.84% yield, supported by stable payouts but with caution advised due to some coverage challenges.
Ameren Corporation
Ameren Corporation’s net margin and weighted average cost of capital (WACC) are favorable, but key returns such as ROE and ROIC are unfavorable, reflecting weaker profitability and capital efficiency. Liquidity ratios are below one, signaling possible short-term liquidity issues, while debt levels remain high. Ameren maintains a dividend yield of 3.0%, indicating consistent shareholder returns, though leverage and coverage metrics warrant monitoring.
Which one has the best ratios?
Both companies exhibit slightly unfavorable overall ratio profiles with comparable favorable ratios around 21%, but Ameren has a higher proportion of unfavorable ratios at 50% versus Public Service’s 42.86%. Public Service Enterprise Group’s ROE and net margin are marginally stronger, while Ameren’s dividend yield is slightly higher. Neither company distinctly outperforms across all metrics, reflecting trade-offs in operational and financial risk factors.
Strategic Positioning
This section compares the strategic positioning of Public Service Enterprise Group Incorporated (PEG) and Ameren Corporation (AEE), focusing on market position, key segments, and exposure to technological disruption:
Public Service Enterprise Group Incorporated (PEG)
- Leading utility in Northeastern and Mid-Atlantic US, facing regulated electric industry competition.
- Revenue driven by electric and gas distribution, transmission, and solar projects, serving residential and commercial customers.
- Moderate exposure through investments in solar generation and energy efficiency programs in regulated markets.
Ameren Corporation (AEE)
- Regional utility in Missouri and Illinois, operating in regulated electric and natural gas markets.
- Revenue mainly from electric generation and natural gas distribution, including coal, nuclear, and renewable sources.
- Exposure includes diverse generation sources with renewables and traditional fuels, facing industry transitions.
PEG vs AEE Positioning
PEG shows a diversified business model with strong regional presence and investments in solar and energy efficiency. AEE has a more concentrated regional focus on electric and gas utilities with a mix of generation sources, balancing traditional and renewable energy.
Which has the best competitive advantage?
Both PEG and AEE are shedding value relative to their cost of capital. PEG’s slightly unfavorable moat benefits from a growing ROIC trend, while AEE’s very unfavorable moat reflects declining profitability, indicating weaker competitive advantage for AEE.
Stock Comparison
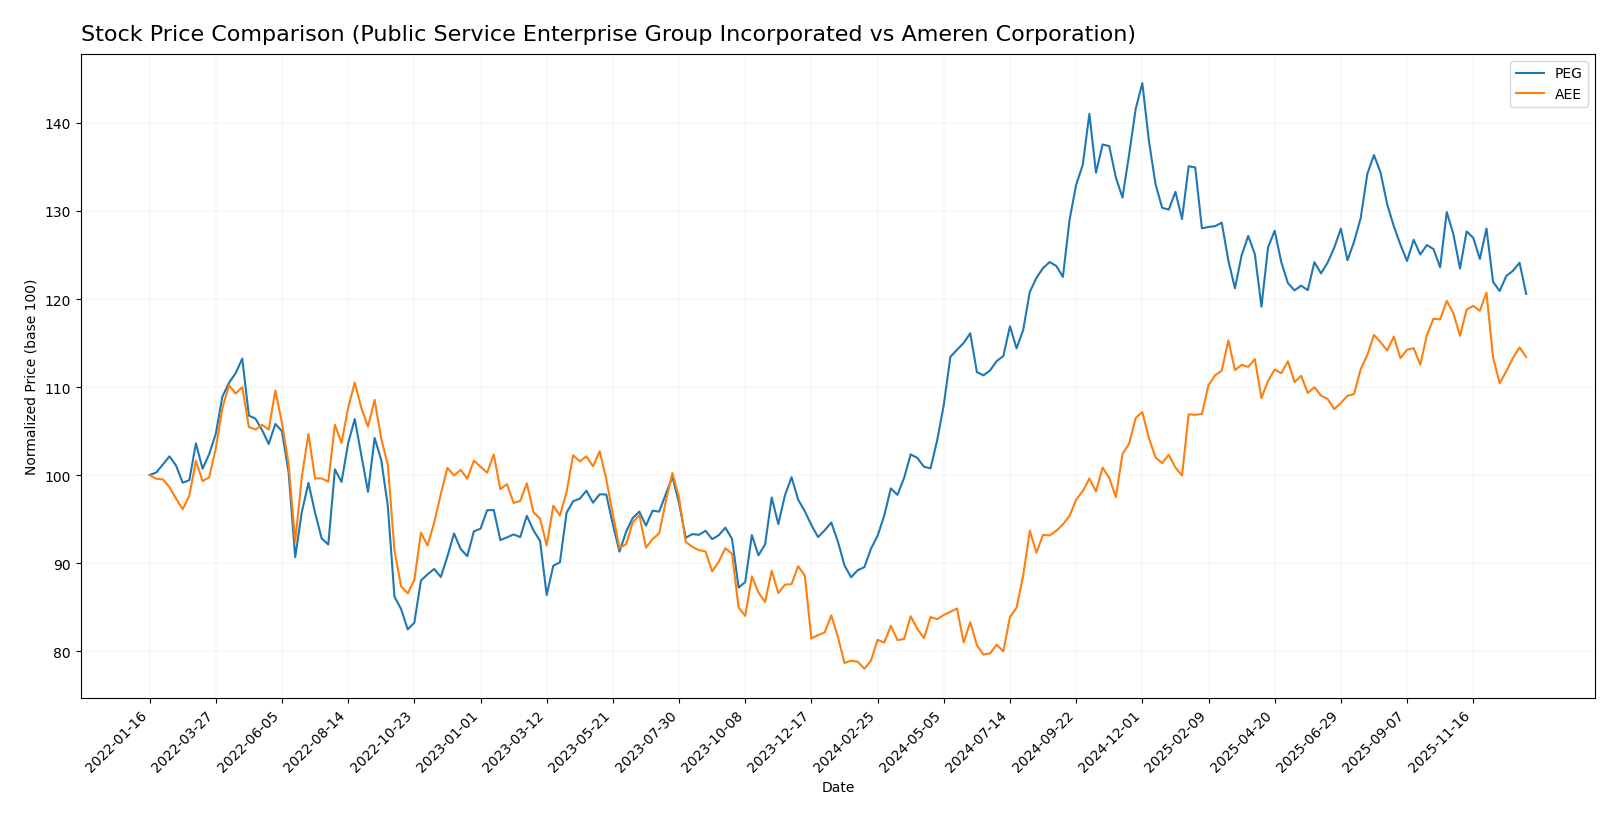
The stock prices of Public Service Enterprise Group Incorporated (PEG) and Ameren Corporation (AEE) have shown significant bullish trends over the past 12 months, with both exhibiting deceleration in momentum and recent price pullbacks.
Trend Analysis
Public Service Enterprise Group Incorporated (PEG) displayed a 31.59% price increase over the past year, marking a bullish trend with a decelerating upward momentum. Recent weeks show a slight bearish reversal with a -5.33% decline.
Ameren Corporation (AEE) posted a stronger 43.73% price rise over the same period, also bullish but decelerating. Its recent trend similarly indicates a moderate pullback of -4.19%.
Comparing both, AEE outperformed PEG in market gains over the past year, despite both stocks experiencing recent mild downward corrections.
Target Prices
The consensus target prices from reliable analysts indicate positive upside potential for both Public Service Enterprise Group Incorporated and Ameren Corporation.
| Company | Target High | Target Low | Consensus |
|---|---|---|---|
| Public Service Enterprise Group Incorporated | 98 | 83 | 89 |
| Ameren Corporation | 119 | 103 | 111.86 |
Analysts expect both stocks to trade above their current prices, suggesting moderate to strong appreciation potential. Public Service Enterprise Group’s consensus target is about 13% above its current price of 78.68, while Ameren’s target is roughly 12% higher than its current 99.91.
Analyst Opinions Comparison
This section compares analysts’ ratings and grades for Public Service Enterprise Group Incorporated (PEG) and Ameren Corporation (AEE):
Rating Comparison
PEG Rating
- Rating: B-, considered very favorable overall.
- Discounted Cash Flow Score: 1, indicating a very unfavorable valuation outlook.
- ROE Score: 4, a favorable indicator of profit generation efficiency.
- ROA Score: 4, favorable utilization of assets for earnings.
- Debt To Equity Score: 2, moderate financial risk with balanced leverage.
- Overall Score: 3, reflecting a moderate overall financial standing.
AEE Rating
- Rating: B-, also considered very favorable overall.
- Discounted Cash Flow Score: 1, also very unfavorable for valuation outlook.
- ROE Score: 4, equally favorable for profit generation efficiency.
- ROA Score: 3, moderate effectiveness in asset utilization.
- Debt To Equity Score: 2, similarly moderate financial risk and leverage.
- Overall Score: 2, indicating a moderate but slightly lower financial standing.
Which one is the best rated?
Based on the available data, PEG and AEE share the same overall rating of B- with very favorable status. PEG has a higher overall score (3 vs. 2) and a better ROA score, making it slightly better rated in financial health metrics.
Scores Comparison
Here is a comparison of the Altman Z-Score and Piotroski Score for each company:
PEG Scores
- Altman Z-Score of 1.32, indicating financial distress risk.
- Piotroski Score of 7, reflecting strong financial health.
AEE Scores
- Altman Z-Score of 0.97, also signaling financial distress risk.
- Piotroski Score of 6, representing average financial health.
Which company has the best scores?
PEG has a higher Piotroski Score (7 vs. 6), indicating stronger financial health, while both companies are in the Altman Z-Score distress zone. PEG shows relatively better scores overall.
Grades Comparison
Here is the comparison of recent grades and rating trends for Public Service Enterprise Group Incorporated and Ameren Corporation:
Public Service Enterprise Group Incorporated Grades
The following table lists recent grades assigned by reputable financial institutions to Public Service Enterprise Group Incorporated:
| Grading Company | Action | New Grade | Date |
|---|---|---|---|
| Ladenburg Thalmann | Upgrade | Buy | 2026-01-07 |
| UBS | Maintain | Buy | 2025-12-17 |
| JP Morgan | Maintain | Overweight | 2025-12-12 |
| Jefferies | Upgrade | Buy | 2025-11-06 |
| TD Cowen | Maintain | Buy | 2025-11-05 |
| BMO Capital | Maintain | Market Perform | 2025-11-04 |
| Barclays | Maintain | Equal Weight | 2025-10-21 |
| BMO Capital | Maintain | Market Perform | 2025-10-20 |
| Morgan Stanley | Maintain | Overweight | 2025-09-25 |
| BMO Capital | Maintain | Market Perform | 2025-08-06 |
Overall, the grades for Public Service Enterprise Group Incorporated show a positive trend with multiple upgrades and a consensus rating of Buy.
Ameren Corporation Grades
The following table presents recent grades from recognized grading companies for Ameren Corporation:
| Grading Company | Action | New Grade | Date |
|---|---|---|---|
| UBS | Maintain | Buy | 2025-12-17 |
| Keybanc | Downgrade | Sector Weight | 2025-12-12 |
| Mizuho | Maintain | Outperform | 2025-10-27 |
| Morgan Stanley | Maintain | Equal Weight | 2025-10-22 |
| Barclays | Maintain | Equal Weight | 2025-10-21 |
| Keybanc | Maintain | Overweight | 2025-10-15 |
| Morgan Stanley | Maintain | Equal Weight | 2025-09-25 |
| Keybanc | Maintain | Overweight | 2025-07-16 |
| UBS | Maintain | Buy | 2025-07-11 |
| Barclays | Maintain | Equal Weight | 2025-07-10 |
Grades for Ameren Corporation indicate a stable but more mixed pattern, with a consensus rating of Hold.
Which company has the best grades?
Public Service Enterprise Group Incorporated has received generally stronger and more consistent Buy and Overweight grades compared to Ameren Corporation’s more mixed ratings centered around Hold and Equal Weight. This suggests differing market perceptions that may influence investor decisions regarding potential growth and risk profiles.
Strengths and Weaknesses
Below is a comparative table summarizing key strengths and weaknesses of Public Service Enterprise Group Incorporated (PEG) and Ameren Corporation (AEE) based on recent financial and operational data.
| Criterion | Public Service Enterprise Group (PEG) | Ameren Corporation (AEE) |
|---|---|---|
| Diversification | Moderate diversification across electricity, gas distribution, and transmission segments | Focused mainly on electricity and natural gas, less diversified |
| Profitability | Net margin 17.2%, ROE 11%, but ROIC (4.4%) below WACC (5.37%), indicating value destruction despite growing profitability | Net margin 15.5%, ROE 9.8%, ROIC (3.3%) below WACC (5.2%), with declining profitability |
| Innovation | Limited data on innovation; growing ROIC trend suggests improving operational efficiency | Limited innovation indicated; declining ROIC trend signals operational challenges |
| Global presence | Primarily US-focused utility with strong regional presence | US regional utility, limited global footprint |
| Market Share | Large presence in New Jersey and surrounding areas with stable contract revenues | Significant market share in Illinois and Missouri; steady electricity sales |
Key takeaways: PEG shows moderate diversification and improving profitability but still destroys value as ROIC lags WACC. AEE has a focused business model with slightly lower profitability and declining returns, indicating higher risk. Both companies exhibit slightly unfavorable financial health, requiring cautious investment consideration.
Risk Analysis
Below is a comparative table highlighting key risks for Public Service Enterprise Group Incorporated (PEG) and Ameren Corporation (AEE) based on the most recent 2024 data:
| Metric | Public Service Enterprise Group (PEG) | Ameren Corporation (AEE) |
|---|---|---|
| Market Risk | Beta 0.61, moderate sensitivity to market fluctuations | Beta 0.59, moderate market sensitivity |
| Debt level | Debt-to-Equity 1.42 (unfavorable), Debt to Assets 42% (neutral) | Debt-to-Equity 1.55 (unfavorable), Debt to Assets 42% (neutral) |
| Regulatory Risk | High, due to operation in regulated electric and gas markets in Northeastern US | High, operates in regulated electric and gas markets in Midwest US |
| Operational Risk | Extensive infrastructure with aging assets (25K circuit miles electrical, 18K miles gas mains) | Diverse generation mix with coal, nuclear, gas, renewables; operational complexity |
| Environmental Risk | Exposure to transition risks from fossil fuels to renewables | Similar exposure with coal and gas generation; increasing renewable integration needed |
| Geopolitical Risk | Low, primarily US domestic operations | Low, primarily US domestic operations |
Synthesis: Both PEG and AEE face significant regulatory and operational risks inherent to regulated utilities, with substantial debt levels increasing financial risk. PEG’s stronger asset base contrasts with AEE’s more complex generation mix. Environmental transition risk is impactful for both, with fossil fuel reliance requiring cautious management. Market risk remains moderate due to low beta values. PEG’s Altman Z-Score of 1.32 and AEE’s 0.97 place them in the distress zone, signaling caution on financial stability.
Which Stock to Choose?
Public Service Enterprise Group Incorporated (PEG) shows a mixed financial picture with unfavorable income growth over recent years despite favorable net margin and decent profitability ratios. Its debt levels and liquidity ratios are unfavorable, while the overall rating is very favorable, indicating some strengths amid challenges.
Ameren Corporation (AEE) exhibits favorable income growth and strong gross margin, although its profitability ratios are somewhat lower than PEG’s. Debt and liquidity ratios remain unfavorable, and its overall rating is also very favorable, but with a notably declining return on invested capital.
Considering the ratings and financial evaluations, PEG may appear more attractive to investors seeking improving profitability and stable returns, whereas AEE could be suited for those valuing stronger income growth but facing declining capital efficiency. The choice might depend on whether the investor prioritizes growth trends or capital return durability.
Disclaimer: Investment carries a risk of loss of initial capital. The past performance is not a reliable indicator of future results. Be sure to understand risks before making an investment decision.
Go Further
I encourage you to read the complete analyses of Public Service Enterprise Group Incorporated and Ameren Corporation to enhance your investment decisions: