Ameren Corporation (AEE) and PPL Corporation (PPL) are two prominent players in the regulated electric utility sector, each serving millions of customers across different U.S. regions. Both companies emphasize innovation in renewable energy integration alongside traditional power generation, making them relevant for investors interested in sustainable utilities. This article will explore their strengths and challenges to help you decide which company offers the most compelling investment opportunity today.
Table of contents
Companies Overview
I will begin the comparison between Ameren Corporation and PPL Corporation by providing an overview of these two companies and their main differences.
Ameren Overview
Ameren Corporation is a public utility holding company operating primarily in the regulated electric and natural gas sectors in the United States. It serves residential, commercial, and industrial customers through four segments: Ameren Missouri, Ameren Illinois Electric Distribution, Ameren Illinois Natural Gas, and Ameren Transmission. Ameren generates electricity from coal, nuclear, natural gas, and renewable sources such as hydroelectric, wind, methane gas, and solar.
PPL Overview
PPL Corporation is a utility holding company delivering electricity and natural gas in the US and the UK. It operates through Kentucky Regulated and Pennsylvania Regulated segments, serving over 2.7M customers across these regions. PPL generates electricity from coal, gas, hydro, and solar sources and sells wholesale electricity to municipalities in Kentucky. The company focuses on regulated markets in multiple states, emphasizing both electric and natural gas services.
Key similarities and differences
Both Ameren and PPL operate as regulated electric utilities with diversified energy generation portfolios including coal, gas, hydro, and solar sources. Ameren has a broader operational scope with four segments covering electric and natural gas transmission and distribution, while PPL focuses on two regulatory segments with additional natural gas services and a presence in the UK. Ameren serves a wider range of customer types, whereas PPL’s customer base is concentrated regionally across Kentucky, Pennsylvania, and parts of Virginia.
Income Statement Comparison
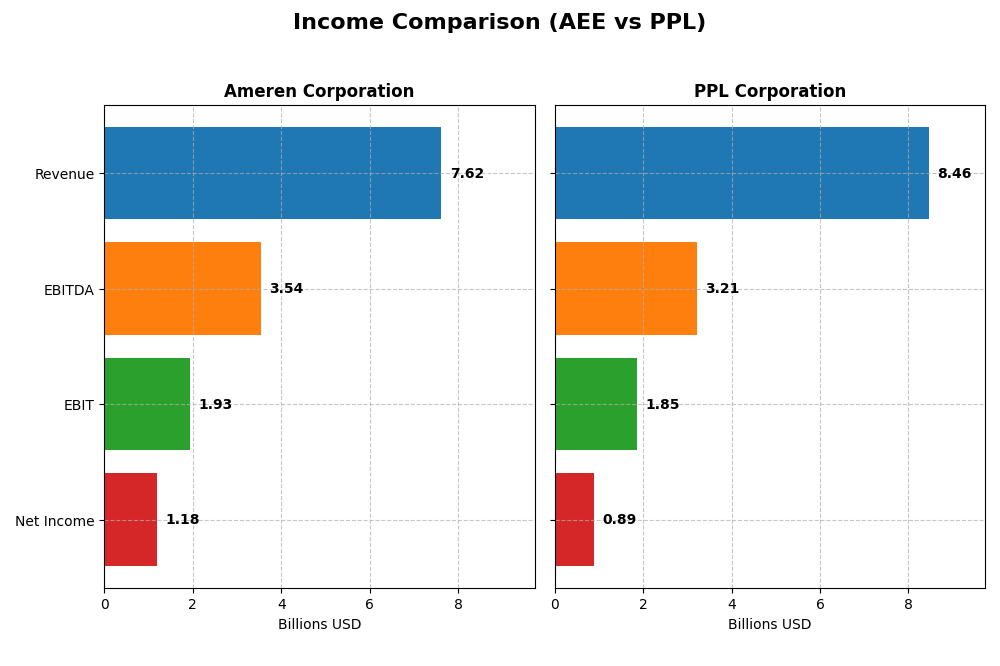
This table presents a side-by-side comparison of the latest fiscal year income statement metrics for Ameren Corporation and PPL Corporation, offering a clear view of their financial performance.
| Metric | Ameren Corporation (AEE) | PPL Corporation (PPL) |
|---|---|---|
| Market Cap | 27.0B | 25.6B |
| Revenue | 7.62B | 8.46B |
| EBITDA | 3.54B | 3.21B |
| EBIT | 1.93B | 1.85B |
| Net Income | 1.18B | 886M |
| EPS | 4.43 | 1.20 |
| Fiscal Year | 2024 | 2024 |
Income Statement Interpretations
Ameren Corporation
Ameren’s revenue showed steady growth from 5.79B in 2020 to 7.62B in 2024, with net income rising from 871M to 1.18B over the same period. Gross and EBIT margins remained stable and favorable, at 47.92% and 25.36% respectively in 2024. The latest year showed slower revenue growth (1.64%) but improved gross profit, supporting a stable net margin around 15.5%.
PPL Corporation
PPL’s revenue increased significantly from 5.47B in 2020 to 8.46B in 2024, but net income declined overall, ending at 886M in 2024 versus 1.47B in 2020. Margins were favorable yet lower than Ameren’s, with a 40.1% gross margin and 21.91% EBIT margin in 2024. Recent performance highlights a mixed picture: modest revenue growth (1.8%) but favorable EBIT and net margin improvements in the last year.
Which one has the stronger fundamentals?
Both Ameren and PPL have favorable income statement evaluations, with PPL showing higher recent revenue growth and margin improvement but suffering from overall net income and EPS declines since 2020. Ameren displays consistent revenue and net income growth with stable margins. Ameren’s balanced profitability and growth contrast with PPL’s volatility, suggesting differences in fundamental strength.
Financial Ratios Comparison
Below is a comparison of key financial ratios for Ameren Corporation (AEE) and PPL Corporation (PPL) based on their latest fiscal year 2024 data.
| Ratios | Ameren Corporation (AEE) | PPL Corporation (PPL) |
|---|---|---|
| ROE | 9.76% | 6.31% |
| ROIC | 3.32% | 3.59% |
| P/E | 20.12 | 26.97 |
| P/B | 1.96 | 1.70 |
| Current Ratio | 0.66 | 0.86 |
| Quick Ratio | 0.44 | 0.71 |
| D/E (Debt to Equity) | 1.55 | 1.19 |
| Debt-to-Assets | 41.98% | 40.92% |
| Interest Coverage | 2.29 | 2.36 |
| Asset Turnover | 0.17 | 0.21 |
| Fixed Asset Turnover | 0.21 | 0.26 |
| Payout Ratio | 60.41% | 84.12% |
| Dividend Yield | 3.00% | 3.12% |
Interpretation of the Ratios
Ameren Corporation
Ameren shows a mixed ratio profile with a favorable net margin of 15.51% and dividend yield at 3.0%, indicating moderate profitability and shareholder returns. However, several key ratios are unfavorable: return on equity at 9.76%, return on invested capital at 3.32%, and liquidity ratios below 1, raising concerns about operational efficiency and short-term financial health. The company pays dividends covered by cash flow but with caution advised due to uneven free cash flow.
PPL Corporation
PPL’s financial ratios reveal a slightly weaker performance than Ameren, with a lower net margin of 10.49% and an unfavorable PE ratio of 26.97. Return on equity and invested capital are also below ideal levels, and liquidity ratios under 1 suggest some short-term risk. Its dividend yield is slightly higher at 3.12%, but profitability and efficiency concerns persist. The company maintains dividend payments, though free cash flow coverage appears limited.
Which one has the best ratios?
Comparing both, Ameren Corporation’s ratios are slightly more favorable overall, particularly in profitability and dividend sustainability, despite some liquidity and efficiency weaknesses. PPL’s ratios show a higher proportion of unfavorable metrics, including valuation and returns, suggesting a more cautious view on its financial health. Neither company is strongly advantaged, but Ameren edges ahead in this ratio comparison.
Strategic Positioning
This section compares the strategic positioning of Ameren Corporation and PPL Corporation, including market position, key segments, and exposure to disruption:
Ameren Corporation
- Market position and competitive pressure: Operates as a US public utility holding company with regulated electric and natural gas businesses.
- Key segments and business drivers: Electricity and natural gas distribution, generation via coal, nuclear, gas, and renewables.
- Exposure to technological disruption: Generates electricity from conventional and renewable sources; operates in rate-regulated markets.
PPL Corporation
- Market position and competitive pressure: US and UK utility holding company with regulated electric and natural gas segments.
- Key segments and business drivers: Regulated electric segments in Kentucky, Pennsylvania, and Rhode Island, plus natural gas delivery.
- Exposure to technological disruption: Mix of coal, gas, hydro, solar generation; serves regulated markets in US and UK.
Ameren Corporation vs PPL Corporation Positioning
Ameren shows a diversified US-focused portfolio in multiple electric and gas segments, while PPL concentrates on regulated electric and gas markets in US states and UK. Ameren’s broader energy mix contrasts with PPL’s geographic spread but narrower segment focus.
Which has the best competitive advantage?
Both companies currently shed value with ROIC below WACC. Ameren’s declining ROIC indicates worsening profitability, whereas PPL’s improving ROIC suggests a slight recovery despite still unfavorable value creation.
Stock Comparison
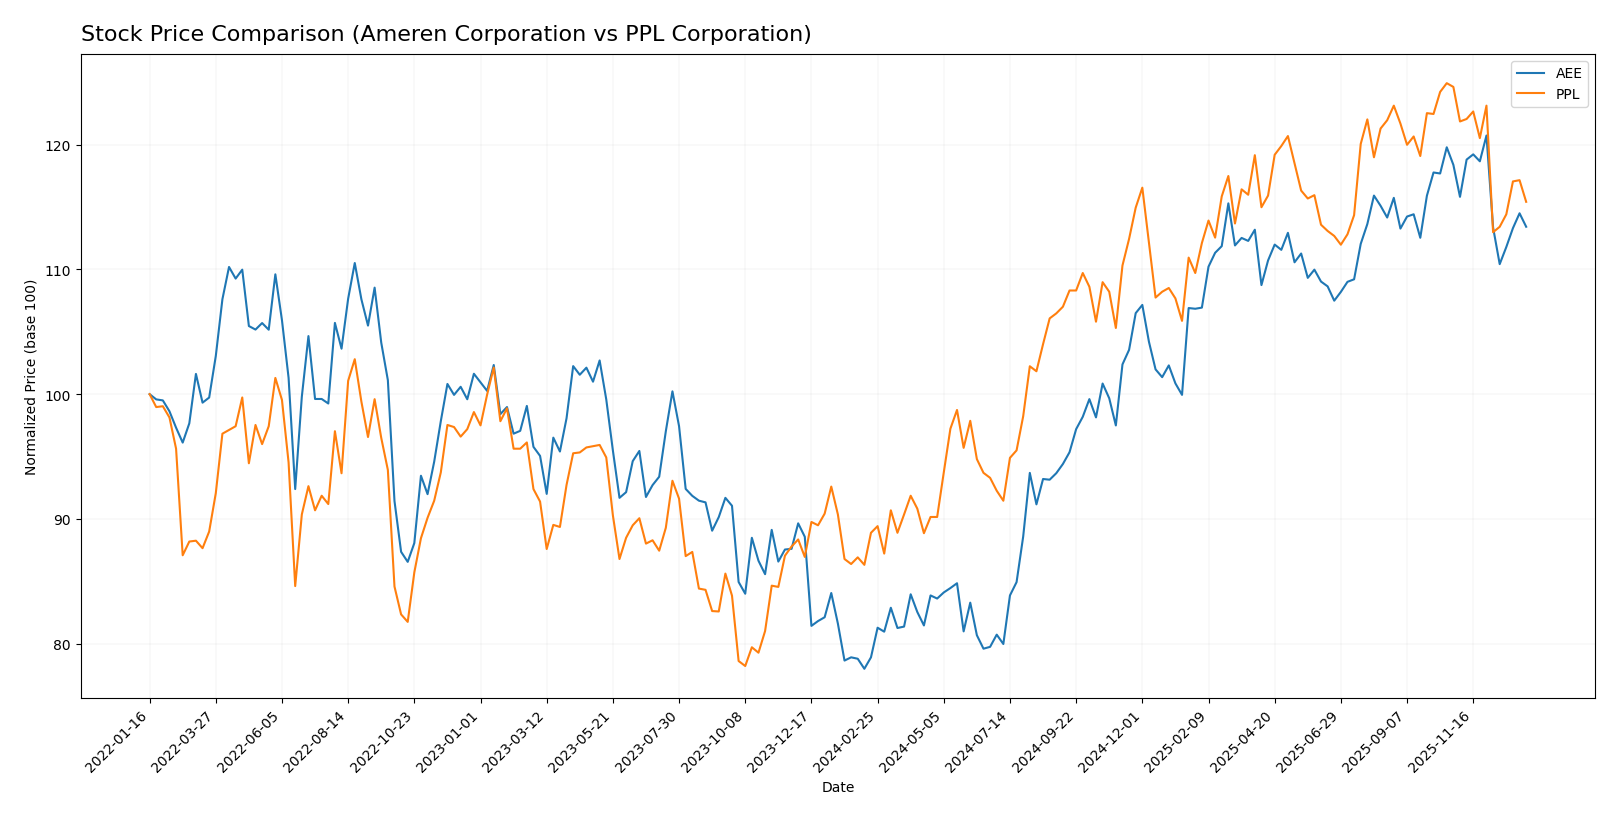
The stock price chart highlights significant bullish trends for both Ameren Corporation and PPL Corporation over the past 12 months, with notable deceleration and recent short-term declines in price.
Trend Analysis
Ameren Corporation (AEE) exhibited a strong bullish trend with a 43.73% price increase over the past 12 months, though the trend shows deceleration. The stock reached a high of 106.35 and a low of 69.51, with notable volatility at an 11.4 standard deviation.
PPL Corporation (PPL) also showed a bullish trend with a 29.84% gain over the same period, accompanied by deceleration. Its price ranged from 26.14 to 37.44, with lower volatility at a 3.24 standard deviation.
Comparing both, Ameren Corporation delivered the highest market performance with a 43.73% increase, outperforming PPL Corporation’s 29.84% gain over the past year.
Target Prices
Analysts present a clear consensus on target prices for Ameren Corporation and PPL Corporation.
| Company | Target High | Target Low | Consensus |
|---|---|---|---|
| Ameren Corporation | 119 | 103 | 111.86 |
| PPL Corporation | 45 | 36 | 41.29 |
The consensus targets for Ameren (111.86) and PPL (41.29) both exceed their current prices, indicating analyst expectations of moderate upside potential for these utilities stocks.
Analyst Opinions Comparison
This section compares analysts’ ratings and grades for Ameren Corporation and PPL Corporation:
Rating Comparison
Ameren Corporation Rating
- Rated B- with a very favorable overall rating evaluation.
- Discounted Cash Flow Score is 1, indicating a very unfavorable valuation based on cash flows.
- Return on Equity Score is 4, reflecting a favorable ability to generate profit from equity.
- Return on Assets Score is 3, assessed as moderate effectiveness in asset utilization.
- Debt To Equity Score is 2, signifying moderate financial risk with balanced debt levels.
- Overall Score is 2, rated as moderate overall financial standing.
PPL Corporation Rating
- Rated C+ with a very favorable overall rating evaluation.
- Discounted Cash Flow Score is 1, also showing a very unfavorable valuation on cash flows.
- Return on Equity Score is 3, representing a moderate ability to generate profit from equity.
- Return on Assets Score is 3, similarly indicating moderate asset utilization effectiveness.
- Debt To Equity Score is 2, also pointing to moderate financial risk from debt levels.
- Overall Score is 2, rated as moderate overall financial standing.
Which one is the best rated?
Ameren Corporation has a higher return on equity score (4 vs 3) and a slightly better rating (B- vs C+), while both have the same overall score and debt to equity evaluation. Based solely on these figures, Ameren is rated somewhat better.
Scores Comparison
Here is a comparison of the key financial scores for Ameren Corporation and PPL Corporation:
AEE Scores
- Altman Z-Score: 0.97, in distress zone indicating high bankruptcy risk.
- Piotroski Score: 6, reflecting average financial strength.
PPL Scores
- Altman Z-Score: 0.97, in distress zone indicating high bankruptcy risk.
- Piotroski Score: 6, reflecting average financial strength.
Which company has the best scores?
Both Ameren and PPL have identical Altman Z-Scores (0.97) placing them in the distress zone, and equal Piotroski Scores (6) indicating average financial health. Based strictly on these scores, neither company shows a clear advantage over the other.
Grades Comparison
Here is the detailed comparison of recent grades assigned to Ameren Corporation and PPL Corporation by reputable grading companies:
Ameren Corporation Grades
This table summarizes the most recent grades from major financial institutions for Ameren Corporation:
| Grading Company | Action | New Grade | Date |
|---|---|---|---|
| UBS | Maintain | Buy | 2025-12-17 |
| Keybanc | Downgrade | Sector Weight | 2025-12-12 |
| Mizuho | Maintain | Outperform | 2025-10-27 |
| Morgan Stanley | Maintain | Equal Weight | 2025-10-22 |
| Barclays | Maintain | Equal Weight | 2025-10-21 |
| Keybanc | Maintain | Overweight | 2025-10-15 |
| Morgan Stanley | Maintain | Equal Weight | 2025-09-25 |
| Keybanc | Maintain | Overweight | 2025-07-16 |
| UBS | Maintain | Buy | 2025-07-11 |
| Barclays | Maintain | Equal Weight | 2025-07-10 |
The grades for Ameren Corporation display a mix of positive and neutral ratings, with a tendency toward “Buy” and “Overweight” actions, balanced by several “Equal Weight” recommendations.
PPL Corporation Grades
Below is the summary of the recent grades from established financial analysts for PPL Corporation:
| Grading Company | Action | New Grade | Date |
|---|---|---|---|
| UBS | Maintain | Neutral | 2025-12-17 |
| Wells Fargo | Maintain | Overweight | 2025-12-12 |
| JP Morgan | Maintain | Overweight | 2025-12-11 |
| BMO Capital | Maintain | Outperform | 2025-10-21 |
| B of A Securities | Maintain | Buy | 2025-10-16 |
| Barclays | Maintain | Equal Weight | 2025-10-14 |
| UBS | Maintain | Neutral | 2025-10-10 |
| Morgan Stanley | Maintain | Overweight | 2025-09-25 |
| Barclays | Maintain | Equal Weight | 2025-07-01 |
| Morgan Stanley | Maintain | Overweight | 2025-06-18 |
PPL Corporation’s ratings predominantly feature positive grades such as “Buy,” “Overweight,” and “Outperform,” with no downgrades and a few neutral stances.
Which company has the best grades?
PPL Corporation has received generally more favorable grades, including multiple “Buy” and “Outperform” ratings, compared to Ameren Corporation’s mix that includes several “Equal Weight” and a recent downgrade. This may indicate stronger analyst confidence in PPL’s near-term prospects, potentially influencing investor sentiment and portfolio decisions.
Strengths and Weaknesses
Below is a comparative table of key strengths and weaknesses for Ameren Corporation (AEE) and PPL Corporation (PPL), based on their latest financial and operational data.
| Criterion | Ameren Corporation (AEE) | PPL Corporation (PPL) |
|---|---|---|
| Diversification | Moderate: Mainly electricity (6.54B) and natural gas (1.08B) revenues, limited product range | Moderate: Focused on regulated electricity segments in multiple states, some geographic spread |
| Profitability | Mixed: Net margin favorable at 15.5%, but ROIC low at 3.3% and declining, indicating value destruction | Mixed: Net margin lower at 10.5%, ROIC slightly higher at 3.6% with improving trend but still below WACC |
| Innovation | Limited visible innovation metrics; traditional utility business model | Limited visible innovation metrics; steady focus on regulated utilities |
| Global presence | Primarily regional U.S. operations, no significant international exposure | Mostly U.S. regional operations; exited UK market, limited international presence |
| Market Share | Strong regional presence in Illinois and Missouri with stable electricity demand | Strong in Pennsylvania, Kentucky, Rhode Island; diversified customer base within regulated markets |
Key takeaways: Both companies operate primarily within regulated U.S. utility markets with moderate diversification. Ameren shows stronger net margins but suffers from declining capital efficiency, while PPL is improving its ROIC but remains slightly unprofitable on capital invested. Neither company displays significant innovation or global diversification. Investors should weigh steady dividend yields against their unfavorable capital returns.
Risk Analysis
Below is a comparative table of key risks for Ameren Corporation (AEE) and PPL Corporation (PPL) based on 2024 data, highlighting financial and operational vulnerabilities.
| Metric | Ameren Corporation (AEE) | PPL Corporation (PPL) |
|---|---|---|
| Market Risk | Moderate (Beta 0.59) | Moderate (Beta 0.72) |
| Debt Level | High (Debt/Equity 1.55) | High (Debt/Equity 1.19) |
| Regulatory Risk | Elevated (Utilities sector) | Elevated (Utilities sector) |
| Operational Risk | Moderate (Asset turnover low) | Moderate (Asset turnover low) |
| Environmental Risk | Significant (coal & gas dependency) | Significant (coal & gas dependency) |
| Geopolitical Risk | Low (US focused) | Low (US & UK operations) |
The most impactful risks are high debt levels combined with operational inefficiencies for both companies, raising financial distress concerns as reflected in their Altman Z-scores below 1.0 (distress zone). Environmental risk remains significant due to reliance on fossil fuels, exposing them to regulatory and transition pressures. Investors should monitor debt management and regulatory changes closely to mitigate downside risks.
Which Stock to Choose?
Ameren Corporation (AEE) shows a favorable income statement with strong gross and EBIT margins, moderate revenue growth overall, but mixed profitability signals with a declining ROIC below WACC, indicating value destruction. Its financial ratios are slightly unfavorable, reflecting some leverage and liquidity concerns, yet it holds a very favorable overall rating.
PPL Corporation (PPL) also presents a favorable income statement with solid EBIT margins and recent growth in margins and EPS, despite an overall net income decline. Its financial ratios are more unfavorable than AEE’s, with higher debt concerns and lower profitability, though it maintains a very favorable rating and shows a growing ROIC trend, suggesting improving profitability despite value shedding.
For investors prioritizing growth potential and stable income metrics, AEE might appear more attractive given its favorable income statement and rating, although its declining profitability warrants caution. Conversely, investors focusing on improving profitability trends might view PPL’s growing ROIC and recent earnings growth as signals worth considering despite its financial challenges and value destruction.
Disclaimer: Investment carries a risk of loss of initial capital. The past performance is not a reliable indicator of future results. Be sure to understand risks before making an investment decision.
Go Further
I encourage you to read the complete analyses of Ameren Corporation and PPL Corporation to enhance your investment decisions: