Ameren Corporation (AEE) and Pinnacle West Capital Corporation (PNW) are two prominent players in the regulated electric utility sector, serving millions of customers with a mix of traditional and renewable energy sources. Both companies focus on generation, transmission, and distribution, competing in overlapping markets with strong commitments to innovation and sustainability. In this article, I will analyze their fundamentals and strategies to help you decide which utility stock could be the most compelling addition to your investment portfolio.
Table of contents
Companies Overview
I will begin the comparison between Ameren Corporation and Pinnacle West Capital Corporation by providing an overview of these two companies and their main differences.
Ameren Corporation Overview
Ameren Corporation operates as a public utility holding company in the US, focusing on regulated electric generation, transmission, and distribution, alongside natural gas distribution and transmission. The company generates electricity from coal, nuclear, natural gas, and renewables like hydroelectric, wind, methane gas, and solar. Ameren serves residential, commercial, and industrial customers primarily through its four segments, including Ameren Missouri and Ameren Illinois.
Pinnacle West Capital Corporation Overview
Pinnacle West Capital Corporation, mainly through Arizona Public Service Company, provides retail and wholesale electric services in Arizona. It operates generation, transmission, and distribution facilities using coal, nuclear, gas, oil, and solar resources. With approximately 6,323 megawatts of regulated generation capacity, Pinnacle West serves about 1.3 million customers and manages extensive overhead and underground transmission and distribution lines across the state.
Key similarities and differences
Both companies operate in the regulated electric utility sector in the US, engaging in generation, transmission, and distribution of electricity using diverse energy sources, including nuclear, coal, gas, and renewables. Ameren has a broader geographic footprint with multiple segments, while Pinnacle West focuses primarily on Arizona with a significant customer base. Ameren includes natural gas transmission and distribution in its business model, whereas Pinnacle West emphasizes extensive transmission and distribution infrastructure within a single state.
Income Statement Comparison
The table below compares key income statement metrics for Ameren Corporation and Pinnacle West Capital Corporation for the fiscal year 2024, providing a snapshot of their financial performance.
| Metric | Ameren Corporation (AEE) | Pinnacle West Capital Corporation (PNW) |
|---|---|---|
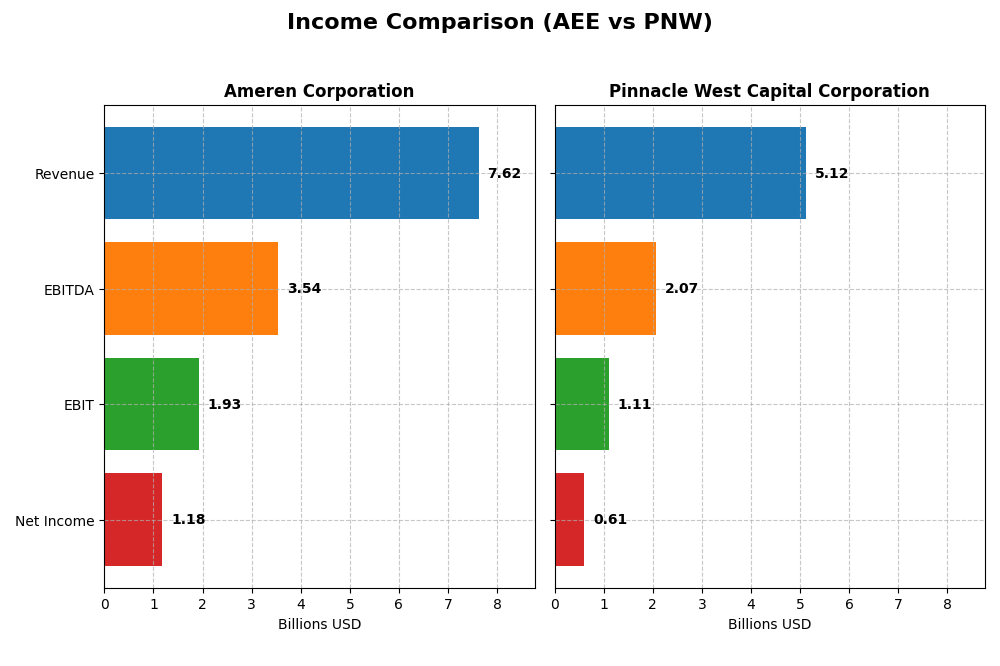
| Market Cap | 27.0B | 10.7B |
| Revenue | 7.62B | 5.12B |
| EBITDA | 3.54B | 2.07B |
| EBIT | 1.93B | 1.11B |
| Net Income | 1.18B | 609M |
| EPS | 4.43 | 5.35 |
| Fiscal Year | 2024 | 2024 |
Income Statement Interpretations
Ameren Corporation
Ameren’s revenue increased steadily from $5.79B in 2020 to $7.62B in 2024, reflecting a 31.57% growth over five years. Net income also grew by 35.71%, reaching $1.18B in 2024. Margins remained stable with a favorable gross margin of 47.92% and net margin of 15.51%. In 2024, revenue growth slowed to 1.64%, while gross profit improved by 5.36%, indicating controlled cost management.
Pinnacle West Capital Corporation
Pinnacle West’s revenue rose from $3.59B in 2020 to $5.12B in 2024, showing a strong 42.88% growth overall. Net income increased to $609M in 2024, with a 10.58% rise over five years. Margins are favorable, with a 41.7% gross margin and 11.88% net margin. The latest year saw robust revenue growth of 9.13% and a net margin increase of 11.22%, signaling improved profitability.
Which one has the stronger fundamentals?
Ameren shows consistent margin strength and higher net income growth over the period, with stable profitability metrics. Pinnacle West demonstrates stronger revenue and net income growth in the latest year, supported by a high percentage of favorable income statement metrics. Both companies present favorable fundamentals, but Ameren’s margin stability contrasts with Pinnacle West’s stronger recent growth dynamics.
Financial Ratios Comparison
The table below presents a side-by-side comparison of key financial ratios for Ameren Corporation (AEE) and Pinnacle West Capital Corporation (PNW) based on their most recent fiscal year data (2024).
| Ratios | Ameren Corporation (AEE) | Pinnacle West Capital Corporation (PNW) |
|---|---|---|
| ROE | 9.76% | 9.01% |
| ROIC | 3.32% | 3.48% |
| P/E | 20.1 | 15.9 |
| P/B | 1.96 | 1.43 |
| Current Ratio | 0.66 | 0.59 |
| Quick Ratio | 0.44 | 0.42 |
| D/E (Debt to Equity) | 1.55 | 1.64 |
| Debt-to-Assets | 42.0% | 42.3% |
| Interest Coverage | 2.29 | 2.68 |
| Asset Turnover | 0.17 | 0.20 |
| Fixed Asset Turnover | 0.21 | 0.25 |
| Payout Ratio | 60.4% | 64.8% |
| Dividend Yield | 3.00% | 4.09% |
Interpretation of the Ratios
Ameren Corporation
Ameren shows mixed ratio strength with a favorable net margin of 15.51% but unfavorable return on equity (9.76%) and return on invested capital (3.32%). Liquidity ratios are weak, with a current ratio of 0.66 and quick ratio of 0.44, indicating potential short-term financial strain. The dividend yield is a solid 3.0%, supported by steady payouts, though coverage by free cash flow appears constrained.
Pinnacle West Capital Corporation
Pinnacle West’s net margin stands at a favorable 11.88%, yet return on equity (9.01%) and ROIC (3.48%) remain below ideal levels. Liquidity is tight with a current ratio of 0.59 and quick ratio of 0.42. The company offers a higher dividend yield of 4.09%, reflecting a shareholder-friendly policy, but liquidity and leverage ratios suggest cautious monitoring of financial risk.
Which one has the best ratios?
Both companies share a slightly unfavorable global ratio profile, with equal unfavorable ratio percentages (50%). Pinnacle West edges ahead with a higher dividend yield and slightly better price-to-book ratio, while Ameren benefits from a stronger net margin. Neither company stands out decisively, reflecting balanced strengths and weaknesses in their financial ratios.
Strategic Positioning
This section compares the strategic positioning of Ameren Corporation and Pinnacle West Capital Corporation across market position, key segments, and exposure to disruption:
Ameren Corporation
- Large market cap of 27B with lower beta, faces typical regulated utility competition.
- Diverse business segments: electric generation, transmission, distribution, and natural gas.
- Uses coal, nuclear, natural gas, and renewable sources; exposure to energy transition pressures.
Pinnacle West Capital Corporation
- Smaller market cap of 10.7B, similarly exposed to regulated electric utility competition.
- Focused on electric generation, transmission, and distribution primarily in Arizona.
- Mix of coal, nuclear, gas, oil, and solar; also faces energy sector technological shifts.
Ameren Corporation vs Pinnacle West Capital Corporation Positioning
Ameren’s approach is diversified across multiple energy sources and geographic segments, offering broader business drivers. Pinnacle West has a more concentrated regional focus with emphasis on electric service in Arizona, which may limit diversification but allow operational focus.
Which has the best competitive advantage?
Both companies exhibit very unfavorable MOAT evaluations due to declining ROIC below WACC, indicating value destruction and diminishing profitability, thus neither currently demonstrates a sustainable competitive advantage based on these metrics.
Stock Comparison
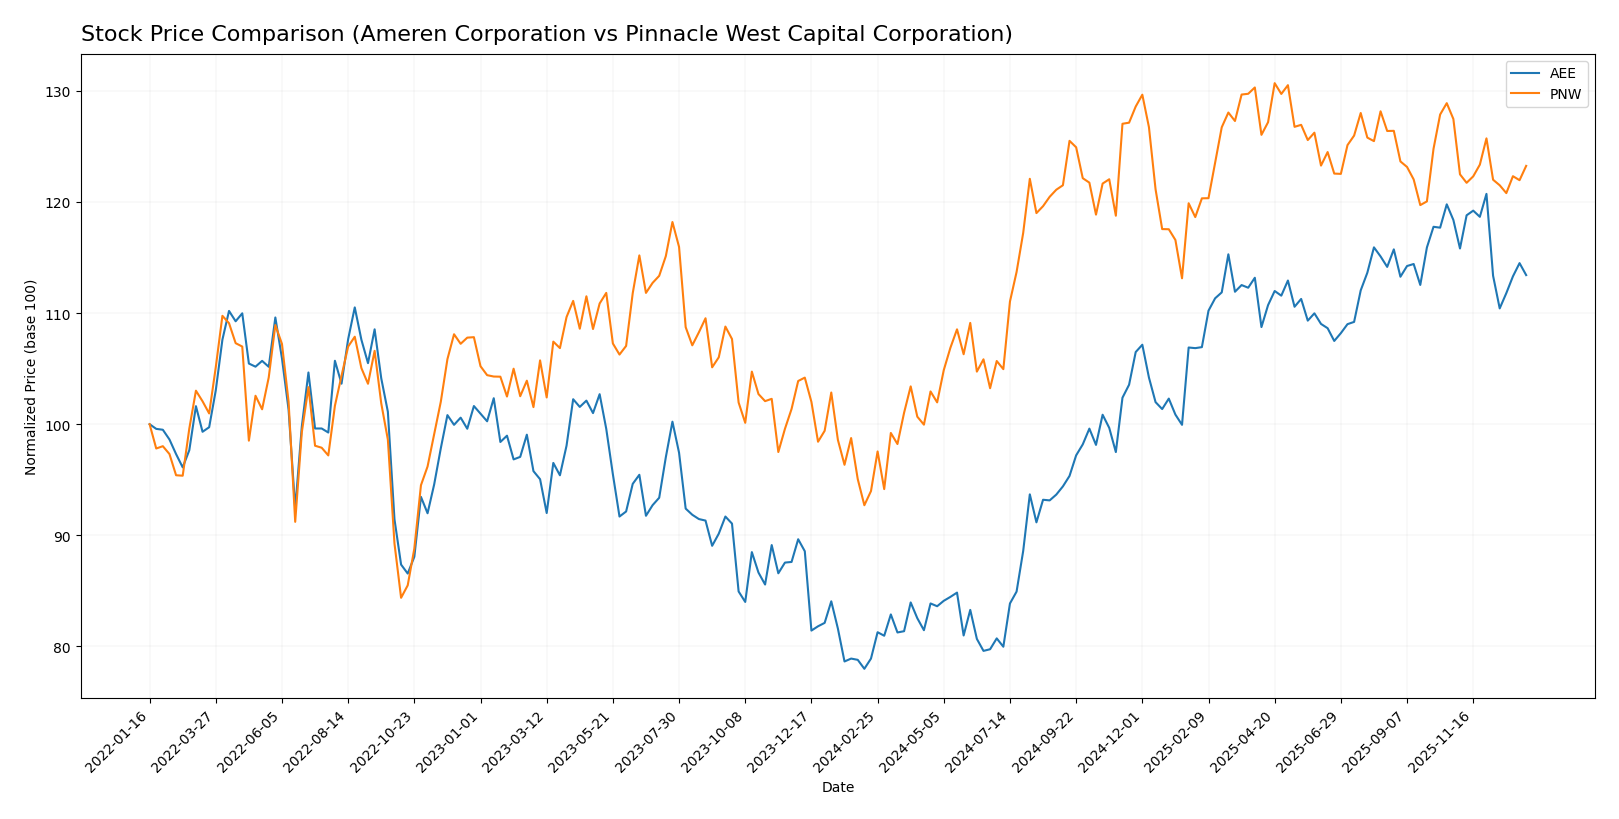
The stock prices of Ameren Corporation (AEE) and Pinnacle West Capital Corporation (PNW) exhibited notable bullish trends over the past 12 months, with both showing deceleration in momentum and recent downward price movements.
Trend Analysis
Ameren Corporation’s stock price increased by 43.73% over the past year, reflecting a strong bullish trend with decelerating acceleration. The stock fluctuated between $69.51 and $106.35, with recent weeks showing a mild decline of 4.19%.
Pinnacle West Capital Corporation saw a 31.14% gain over the past year, also bullish with deceleration. Its price ranged from $67.92 to $94.45, and recent decline was 3.31%, indicating a less steep negative short-term trend than Ameren.
Comparing both, Ameren Corporation delivered the higher market performance over the past year with a 43.73% gain versus Pinnacle West’s 31.14%, despite recent short-term decreases in both stocks.
Target Prices
Analysts present a constructive target price consensus for both Ameren Corporation and Pinnacle West Capital Corporation.
| Company | Target High | Target Low | Consensus |
|---|---|---|---|
| Ameren Corporation | 119 | 103 | 111.86 |
| Pinnacle West Capital Corporation | 115 | 85 | 96.33 |
The consensus targets suggest moderate upside potential for both stocks compared to their current prices of $99.91 (AEE) and $89.07 (PNW), indicating generally positive analyst expectations in the utility sector.
Analyst Opinions Comparison
This section compares the analysts’ ratings and grades for Ameren Corporation and Pinnacle West Capital Corporation:
Rating Comparison
Ameren Corporation Rating
- Rating: B-, considered very favorable by analysts.
- Discounted Cash Flow Score: 1, indicating a very unfavorable DCF.
- ROE Score: 4, a favorable measure of profit generation efficiency.
- ROA Score: 3, showing moderate asset utilization effectiveness.
- Debt To Equity Score: 2, reflecting moderate financial risk.
- Overall Score: 2, a moderate overall financial standing.
Pinnacle West Capital Corporation Rating
- Rating: C+, also considered very favorable by analysts.
- Discounted Cash Flow Score: 1, indicating a very unfavorable DCF.
- ROE Score: 3, a moderate level of profit generation efficiency.
- ROA Score: 3, showing moderate asset utilization effectiveness.
- Debt To Equity Score: 1, indicating very unfavorable financial risk.
- Overall Score: 2, a moderate overall financial standing.
Which one is the best rated?
Ameren Corporation is better rated overall with a B- versus Pinnacle West’s C+. Ameren scores higher in return on equity and debt-to-equity metrics, while both have equal overall and discounted cash flow scores.
Scores Comparison
Here is a comparison of the financial scores for Ameren Corporation and Pinnacle West Capital Corporation:
Ameren Corporation Scores
- Altman Z-Score: 0.97, indicating financial distress.
- Piotroski Score: 6, reflecting average financial health.
Pinnacle West Capital Corporation Scores
- Altman Z-Score: 0.73, also indicating financial distress.
- Piotroski Score: 4, reflecting average financial health.
Which company has the best scores?
Ameren has a higher Altman Z-Score and Piotroski Score compared to Pinnacle West, suggesting relatively better financial stability and strength based on the provided data.
Grades Comparison
The following is a comparison of the most recent reliable grades assigned to Ameren Corporation and Pinnacle West Capital Corporation:
Ameren Corporation Grades
This table displays recent grades from reputable financial institutions for Ameren Corporation:
| Grading Company | Action | New Grade | Date |
|---|---|---|---|
| UBS | Maintain | Buy | 2025-12-17 |
| Keybanc | Downgrade | Sector Weight | 2025-12-12 |
| Mizuho | Maintain | Outperform | 2025-10-27 |
| Morgan Stanley | Maintain | Equal Weight | 2025-10-22 |
| Barclays | Maintain | Equal Weight | 2025-10-21 |
| Keybanc | Maintain | Overweight | 2025-10-15 |
| Morgan Stanley | Maintain | Equal Weight | 2025-09-25 |
| Keybanc | Maintain | Overweight | 2025-07-16 |
| UBS | Maintain | Buy | 2025-07-11 |
| Barclays | Maintain | Equal Weight | 2025-07-10 |
Grades for Ameren Corporation show a mix of “Buy,” “Overweight,” and “Equal Weight,” indicating generally moderate to positive sentiment with some recent downgrades.
Pinnacle West Capital Corporation Grades
This table summarizes recent grades from credible grading companies for Pinnacle West Capital Corporation:
| Grading Company | Action | New Grade | Date |
|---|---|---|---|
| UBS | Maintain | Neutral | 2025-12-17 |
| Keybanc | Downgrade | Sector Weight | 2025-12-12 |
| Keybanc | Maintain | Overweight | 2025-10-15 |
| UBS | Maintain | Neutral | 2025-10-10 |
| Barclays | Maintain | Equal Weight | 2025-10-07 |
| Argus Research | Maintain | Buy | 2025-09-30 |
| Morgan Stanley | Maintain | Equal Weight | 2025-09-25 |
| UBS | Maintain | Neutral | 2025-09-12 |
| Mizuho | Downgrade | Neutral | 2025-09-09 |
| Barclays | Maintain | Equal Weight | 2025-08-13 |
Pinnacle West Capital Corporation’s grades predominantly range from “Neutral” to “Equal Weight,” with occasional “Overweight” and “Buy” ratings, reflecting cautious to moderate outlooks.
Which company has the best grades?
Ameren Corporation has received a higher proportion of “Buy” and “Overweight” grades compared to Pinnacle West Capital Corporation, which mostly holds “Neutral” and “Equal Weight” ratings. This difference may suggest relatively stronger analyst confidence in Ameren’s prospects, potentially influencing investor sentiment and portfolio positioning.
Strengths and Weaknesses
Below is a table summarizing the key strengths and weaknesses of Ameren Corporation (AEE) and Pinnacle West Capital Corporation (PNW) based on their recent financial and operational data.
| Criterion | Ameren Corporation (AEE) | Pinnacle West Capital Corporation (PNW) |
|---|---|---|
| Diversification | Moderate: Electricity (6.54B) and Natural Gas (1.08B) revenue streams, providing some balance | Limited: Mainly Electric Service (2.56B) with smaller electric transmission and wholesale segments |
| Profitability | Mixed: Net margin favorable at 15.51%, but ROIC (3.32%) below WACC (5.19%) indicating value destruction | Mixed: Net margin solid at 11.88%, but ROIC (3.48%) also below WACC (4.68%), shedding value |
| Innovation | Limited data on innovation; traditional utility business model | Similar traditional utility focus with limited innovation emphasis evident |
| Global presence | Regional U.S. utility with concentrated market | Regional U.S. utility, limited international exposure |
| Market Share | Strong in Midwest U.S. markets with stable electricity revenue | Strong in Southwest U.S. markets but smaller scale than AEE |
Key takeaways: Both Ameren and Pinnacle West operate in regulated utility sectors with stable, regionally focused revenue streams. While profitability margins are decent, both companies show declining returns on invested capital below their cost of capital, signaling value erosion. Diversification favors Ameren slightly due to natural gas exposure. Investors should weigh these profitability challenges and limited innovation when considering these stocks for their portfolios.
Risk Analysis
Below is a comparative table of key risks for Ameren Corporation (AEE) and Pinnacle West Capital Corporation (PNW) based on the most recent data from 2024.
| Metric | Ameren Corporation (AEE) | Pinnacle West Capital Corporation (PNW) |
|---|---|---|
| Market Risk | Moderate (Beta 0.59) | Moderate (Beta 0.54) |
| Debt level | High (Debt/Equity 1.55) | High (Debt/Equity 1.64) |
| Regulatory Risk | Elevated due to utility sector compliance | Elevated, with state-level regulatory exposure in Arizona |
| Operational Risk | Moderate, aging infrastructure concerns | Moderate, large transmission network maintenance challenges |
| Environmental Risk | Significant, reliance on coal and nuclear | Significant, coal and nuclear generation impacts |
| Geopolitical Risk | Low, primarily US-focused operations | Low, primarily US-focused operations |
Both Ameren and Pinnacle West face moderate market risks with relatively low beta values, implying less volatility compared to the overall market. However, their high debt levels (Debt/Equity ratios above 1.5) indicate financial leverage that requires careful monitoring. Regulatory risk remains elevated given the highly regulated nature of their electric utility operations, with environmental risks stemming from their use of coal and nuclear power. Operational risks include infrastructure maintenance, which is critical for consistent service delivery. Geopolitical risk is minimal given their domestic focus. Notably, both companies are in financial distress zones per Altman Z-scores, highlighting bankruptcy risk concerns that investors should weigh carefully.
Which Stock to Choose?
Ameren Corporation (AEE) shows a favorable income statement with stable net margins around 15.5%, though recent revenue growth is modest at 1.64%. Its financial ratios reveal mixed signals: strong net margin and dividend yield, but unfavorable returns on equity and invested capital, coupled with a high debt level and low liquidity. The company holds a very favorable overall rating (B-) despite a slightly unfavorable global ratios opinion and is rated in the distress zone for bankruptcy risk.
Pinnacle West Capital Corporation (PNW) demonstrates solid income growth, with a 9.13% revenue increase and a favorable net margin near 11.9%. Financial ratios show a better balance, including a favorable price-to-book ratio and dividend yield, though it also faces challenges with debt and liquidity. PNW’s overall rating is very favorable (C+), with a slightly unfavorable global ratios opinion, and it similarly falls in the distress zone but with average financial strength scores.
Given both companies exhibit very unfavorable economic moat statuses due to declining ROIC below WACC, the choice might depend on investor profile: growth-focused investors may view Pinnacle West’s stronger recent income growth and more favorable valuation metrics as appealing, while income-oriented or dividend-focused investors might find Ameren’s higher net margin and dividend yield more attractive. Both stocks present risks associated with financial leverage and liquidity.
Disclaimer: Investment carries a risk of loss of initial capital. The past performance is not a reliable indicator of future results. Be sure to understand risks before making an investment decision.
Go Further
I encourage you to read the complete analyses of Ameren Corporation and Pinnacle West Capital Corporation to enhance your investment decisions: