In the evolving landscape of regulated electric utilities, Pacific Gas & Electric Co. (PCG) and Ameren Corporation (AEE) stand out as key players shaping the future of energy delivery in the United States. Both companies operate in overlapping markets with diverse energy portfolios, focusing on innovation and sustainability. This comparison will help investors navigate their strengths and risks to identify the most compelling investment opportunity for their portfolio.

Table of contents
Companies Overview
I will begin the comparison between Pacific Gas & Electric Co. and Ameren Corporation by providing an overview of these two companies and their main differences.
Pacific Gas & Electric Co. Overview
Pacific Gas & Electric Co. is a regulated electric utility serving northern and central California. The company generates, transmits, and distributes electricity and natural gas using nuclear, hydroelectric, fossil fuel, and photovoltaic sources. Founded in 1905 and headquartered in San Francisco, it also develops innovative energy solutions like microgrid backup power devices integrated with its SmartMeter system.
Ameren Corporation Overview
Ameren Corporation operates as a public utility holding company in the U.S., serving residential, commercial, and industrial customers primarily in Missouri and Illinois. It engages in rate-regulated electric generation, transmission, and natural gas distribution, using coal, nuclear, natural gas, and renewable sources such as hydroelectric and solar. Founded in 1881 and based in St. Louis, Ameren operates through four business segments focused on regional electric and gas utilities.
Key similarities and differences
Both companies operate in the regulated electric utility sector and provide electricity and natural gas services to residential and commercial customers. Pacific Gas & Electric has a larger workforce and focuses on California markets with diverse generation methods including photovoltaic, while Ameren is a holding company with segmented operations in Missouri and Illinois and a broader mix of fossil and renewable energy sources. Their business models emphasize regulated infrastructure and energy distribution but differ in geographic scope and scale.
Income Statement Comparison
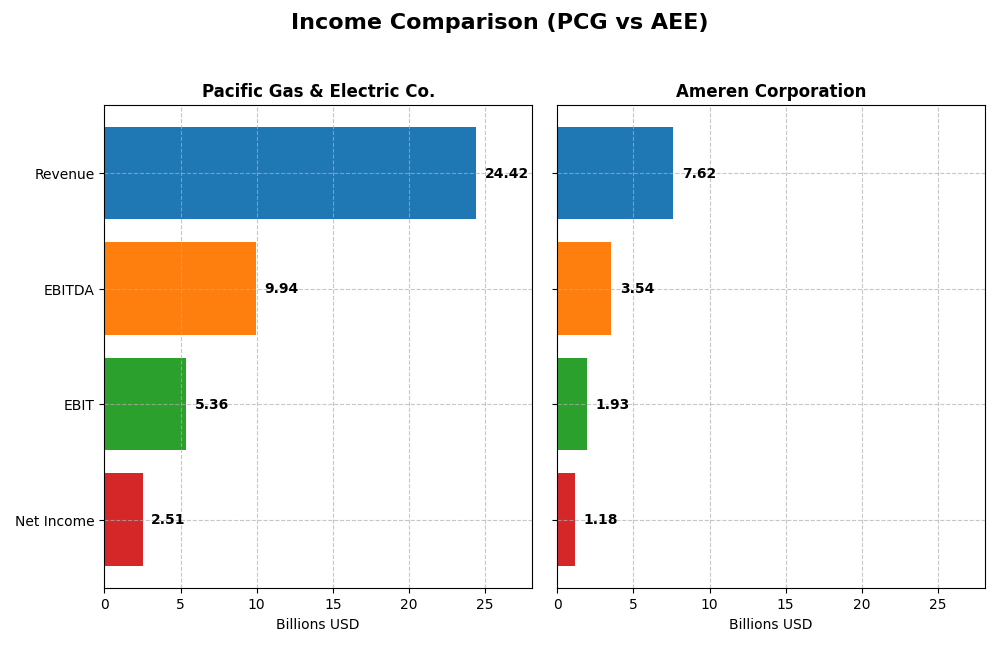
Below is a side-by-side comparison of key income statement metrics for Pacific Gas & Electric Co. and Ameren Corporation for the fiscal year 2024.
| Metric | Pacific Gas & Electric Co. (PCG) | Ameren Corporation (AEE) |
|---|---|---|
| Market Cap | 34.8B | 27.0B |
| Revenue | 24.4B | 7.6B |
| EBITDA | 9.9B | 3.5B |
| EBIT | 5.4B | 1.9B |
| Net Income | 2.5B | 1.2B |
| EPS | 1.16 | 4.43 |
| Fiscal Year | 2024 | 2024 |
Income Statement Interpretations
Pacific Gas & Electric Co.
Pacific Gas & Electric Co. exhibited a revenue increase of 32.22% from 2020 to 2024, with net income surging 292.64% over the same period. Margins improved notably, with gross margin at 37.5% and net margin reaching 10.29%. In 2024, revenue slightly declined by 0.04%, but gross profit and EBIT rose sharply, reflecting enhanced operational efficiency and margin expansion.
Ameren Corporation
Ameren Corporation’s revenue grew by 31.57% between 2020 and 2024, with net income increasing 35.71%. The company maintained strong gross and EBIT margins of 47.92% and 25.36%, respectively. In 2024, revenue increased moderately by 1.64%, while gross profit improved by 5.36%, though EBIT and net margin growth remained flat, indicating stable but slower margin expansion compared to prior years.
Which one has the stronger fundamentals?
Pacific Gas & Electric shows stronger overall growth in net income and margins, with a favorable 78.57% income statement score despite a higher interest expense burden. Ameren demonstrates solid margins and steady revenue growth, with a more balanced interest expense but less pronounced earnings expansion. Both companies have favorable fundamentals, with Pacific Gas & Electric showing more dynamic earnings improvement.
Financial Ratios Comparison
The table below compares key financial ratios of Pacific Gas & Electric Co. (PCG) and Ameren Corporation (AEE) for the fiscal year 2024, providing a snapshot of their current financial health and performance.
| Ratios | Pacific Gas & Electric Co. (PCG) | Ameren Corporation (AEE) |
|---|---|---|
| ROE | 8.3% | 9.8% |
| ROIC | 4.0% | 3.3% |
| P/E | 17.2 | 20.1 |
| P/B | 1.43 | 1.96 |
| Current Ratio | 1.05 | 0.66 |
| Quick Ratio | 1.00 | 0.44 |
| D/E (Debt-to-Equity) | 1.94 | 1.55 |
| Debt-to-Assets | 44% | 42% |
| Interest Coverage | 1.46 | 2.29 |
| Asset Turnover | 0.18 | 0.17 |
| Fixed Asset Turnover | 0.28 | 0.21 |
| Payout ratio | 3.4% | 60.4% |
| Dividend yield | 0.20% | 3.00% |
Interpretation of the Ratios
Pacific Gas & Electric Co. (PCG)
PCG shows mixed ratio results, with a favorable net margin (10.29%) and WACC (4.68%), but weak returns on equity (8.33%) and invested capital (3.98%). Its leverage is high with an unfavorable debt-to-equity ratio (1.94) and low interest coverage (1.76). The dividend yield is low at 0.2%, indicating modest shareholder returns and potential concerns about payout sustainability.
Ameren Corporation (AEE)
AEE posts a stronger net margin (15.51%) and a higher dividend yield (3.0%) than PCG, signifying better profitability and shareholder returns. However, its returns on equity (9.76%) and invested capital (3.32%) remain below ideal, with weak liquidity ratios (current ratio 0.66, quick ratio 0.44) and moderate debt leverage (debt-to-equity 1.55). Dividend payouts appear more attractive but warrant monitoring.
Which one has the best ratios?
Both PCG and AEE face challenges with returns and leverage, reflected in 50% unfavorable ratios each. PCG holds slight advantages in liquidity and valuation metrics, while AEE excels in profitability and dividend yield. Overall, their global ratio opinions are slightly unfavorable, suggesting neither company clearly outperforms the other on key financial metrics.
Strategic Positioning
This section compares the strategic positioning of Pacific Gas & Electric Co. (PCG) and Ameren Corporation (AEE) in terms of market position, key segments, and exposure to technological disruption:
Pacific Gas & Electric Co.
- Market leader in northern and central California with strong regulatory environment; faces moderate competitive pressure.
- Key segments: Electricity generation (nuclear, hydro, fossil, photovoltaic) and US regulated natural gas distribution.
- Developing customer-integrated microgrid backup power devices; uses diverse generation technologies reducing disruption risk.
Ameren Corporation
- Operates in Missouri and Illinois with regulated utilities; experiences competitive pressure in regional markets.
- Four segments: Ameren Missouri, Ameren Illinois Electric Distribution, Natural Gas, and Transmission; diverse energy sources including coal and renewables.
- Uses coal, nuclear, gas, and renewables; no specific disruptive technology initiatives mentioned.
PCG vs AEE Positioning
PCG shows a more concentrated market focus in California with diversified generation sources and tech innovation in microgrids. AEE operates a more segmented geographic and business model across multiple states but lacks explicit disruptive tech efforts. PCG’s integrated tech approach contrasts with AEE’s traditional utility segmentation.
Which has the best competitive advantage?
Both companies are shedding value as ROIC is below WACC; PCG’s slightly unfavorable status with growing profitability contrasts with AEE’s very unfavorable position and declining ROIC, indicating PCG currently holds a marginally better competitive advantage.
Stock Comparison
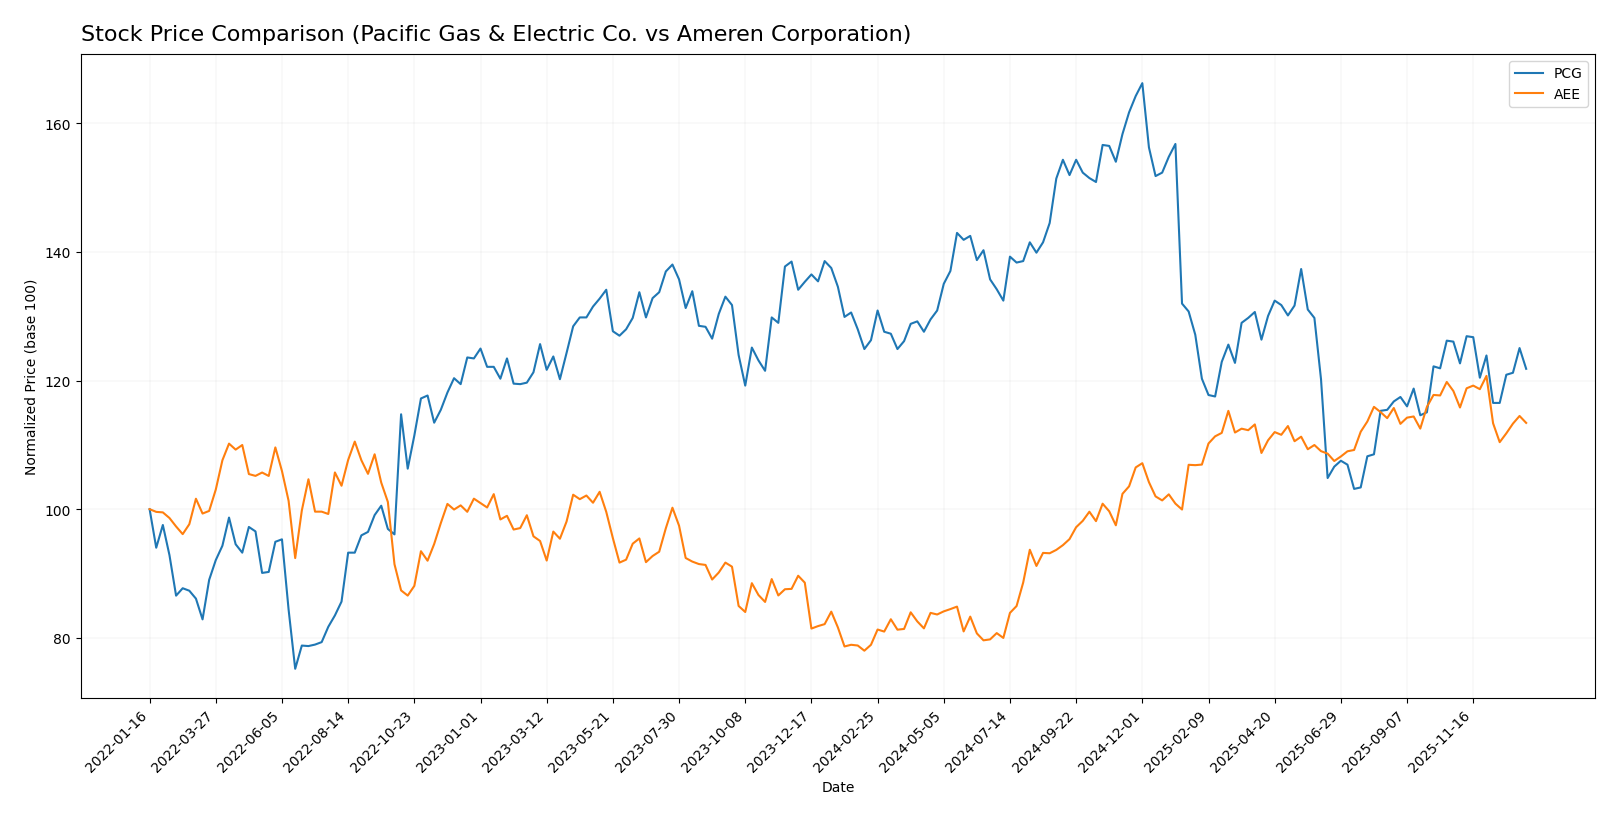
The stock prices of Pacific Gas & Electric Co. (PCG) and Ameren Corporation (AEE) over the past 12 months show contrasting dynamics, with PCG experiencing a modest decline and AEE a substantial rise, each reflecting distinct market sentiments and trading volumes.
Trend Analysis
Pacific Gas & Electric Co. (PCG) displayed a bearish trend over the past year with a price decline of -3.53%. The trend shows deceleration, with a 12-month price range between 13.42 and 21.63, and recent slight downward momentum.
Ameren Corporation (AEE) experienced a bullish trend with a 43.73% price increase over the last year. Despite deceleration in trend acceleration and high price volatility, the stock remains significantly up from its lowest point of 69.51 to a high of 106.35.
Comparing both stocks, Ameren Corporation (AEE) delivered the highest market performance with a strong positive trend, while Pacific Gas & Electric Co. (PCG) showed a moderate negative trend over the same period.
Target Prices
Analysts present a positive target price consensus for Pacific Gas & Electric Co. and Ameren Corporation, indicating potential upside from current levels.
| Company | Target High | Target Low | Consensus |
|---|---|---|---|
| Pacific Gas & Electric Co. | 25 | 18 | 21.5 |
| Ameren Corporation | 119 | 103 | 111.86 |
The consensus targets suggest significant upside potential compared to current prices—Pacific Gas & Electric Co. trades at $15.85 versus a $21.5 consensus, and Ameren Corporation trades at $99.91 versus a $111.86 consensus. This reflects generally optimistic analyst views on both utilities’ future performance.
Analyst Opinions Comparison
This section compares analysts’ ratings and grades for Pacific Gas & Electric Co. and Ameren Corporation:
Rating Comparison
PCG Rating
- Rating: B-, considered Very Favorable overall.
- Discounted Cash Flow Score: 1, rated Very Unfavorable indicating valuation risk.
- ROE Score: 3, Moderate efficiency in generating profit from equity.
- ROA Score: 3, Moderate asset utilization effectiveness.
- Debt To Equity Score: 1, Very Unfavorable suggesting high financial risk.
- Overall Score: 3, Moderate overall financial standing.
AEE Rating
- Rating: B-, considered Very Favorable overall.
- Discounted Cash Flow Score: 1, also Very Unfavorable on valuation perspective.
- ROE Score: 4, Favorable and higher efficiency in profit generation.
- ROA Score: 3, Moderate asset utilization effectiveness.
- Debt To Equity Score: 2, Moderate risk indicating better balance sheet strength.
- Overall Score: 2, Moderate overall financial standing but lower than PCG.
Which one is the best rated?
Both companies share the same overall favorable rating of B-. PCG scores higher on overall score but has more unfavorable debt and cash flow scores. AEE shows a stronger ROE and better debt management, making it comparatively better rated on key efficiency and financial risk measures.
Scores Comparison
The following table compares the Altman Z-Score and Piotroski Score of Pacific Gas & Electric Co. (PCG) and Ameren Corporation (AEE):
PCG Scores
- Altman Z-Score: 0.48, in distress zone, indicating high bankruptcy risk.
- Piotroski Score: 5, classified as average financial strength.
AEE Scores
- Altman Z-Score: 0.97, also in distress zone, showing elevated bankruptcy risk.
- Piotroski Score: 6, classified as average financial strength.
Which company has the best scores?
Based on the provided data, AEE has a higher Altman Z-Score and Piotroski Score than PCG, suggesting slightly better financial stability and strength, though both remain in distress or average zones.
Grades Comparison
Here is a comparison of the latest reliable grades assigned to Pacific Gas & Electric Co. and Ameren Corporation:
Pacific Gas & Electric Co. Grades
The following table shows recent grades from well-known financial institutions for Pacific Gas & Electric Co.:
| Grading Company | Action | New Grade | Date |
|---|---|---|---|
| JP Morgan | Maintain | Overweight | 2025-12-12 |
| UBS | Maintain | Neutral | 2025-10-24 |
| Jefferies | Maintain | Buy | 2025-10-22 |
| BMO Capital | Maintain | Outperform | 2025-10-14 |
| Jefferies | Maintain | Buy | 2025-10-03 |
| Barclays | Maintain | Overweight | 2025-10-01 |
| Morgan Stanley | Maintain | Equal Weight | 2025-09-25 |
| Morgan Stanley | Upgrade | Equal Weight | 2025-09-18 |
| UBS | Maintain | Neutral | 2025-09-18 |
| Barclays | Maintain | Overweight | 2025-07-22 |
Overall, Pacific Gas & Electric Co. shows a generally positive trend with several “Buy,” “Outperform,” and “Overweight” ratings maintained by major firms.
Ameren Corporation Grades
The following table summarizes recent reliable grades for Ameren Corporation:
| Grading Company | Action | New Grade | Date |
|---|---|---|---|
| UBS | Maintain | Buy | 2025-12-17 |
| Keybanc | Downgrade | Sector Weight | 2025-12-12 |
| Mizuho | Maintain | Outperform | 2025-10-27 |
| Morgan Stanley | Maintain | Equal Weight | 2025-10-22 |
| Barclays | Maintain | Equal Weight | 2025-10-21 |
| Keybanc | Maintain | Overweight | 2025-10-15 |
| Morgan Stanley | Maintain | Equal Weight | 2025-09-25 |
| Keybanc | Maintain | Overweight | 2025-07-16 |
| UBS | Maintain | Buy | 2025-07-11 |
| Barclays | Maintain | Equal Weight | 2025-07-10 |
Ameren Corporation’s ratings are mixed, with a notable downgrade from Overweight to Sector Weight by Keybanc, and a prevalence of Hold-to-Equal Weight grades.
Which company has the best grades?
Pacific Gas & Electric Co. has received generally stronger grades, including multiple Buy and Outperform ratings, compared to Ameren Corporation’s more cautious Hold and Sector Weight ratings. This disparity may influence investor sentiment, reflecting higher confidence in Pacific Gas & Electric Co.’s outlook relative to Ameren.
Strengths and Weaknesses
Below is a comparison of Pacific Gas & Electric Co. (PCG) and Ameren Corporation (AEE) based on key criteria relevant to investors.
| Criterion | Pacific Gas & Electric Co. (PCG) | Ameren Corporation (AEE) |
|---|---|---|
| Diversification | Revenue mainly from Electricity (18.64B) and Natural Gas (6.61B); moderately diversified within utilities | Revenue predominantly Electricity (6.54B) and Natural Gas (1.08B); less diversified product base |
| Profitability | Net margin favorable at 10.29%; ROIC 3.98% below WACC (4.68%), indicating slight value destruction but improving ROIC trend (+26.7%) | Net margin favorable at 15.51%; ROIC 3.32% below WACC (5.19%), showing value destruction and declining ROIC (-8.7%) |
| Innovation | Moderate; improving ROIC trend suggests operational improvements | Limited innovation signals; declining profitability trend raises concerns |
| Global presence | Primarily US-regulated operations, limiting global exposure | Primarily US-focused with no significant global presence |
| Market Share | Large electricity revenue indicates strong regional market position | Smaller revenue base but stable in its regional market |
Key takeaways: Both PCG and AEE operate mainly in regulated US energy markets with limited diversification and no global presence. PCG shows a positive trend in profitability despite current value destruction, while AEE faces declining returns and profitability. Investors should weigh PCG’s improving efficiency against AEE’s deteriorating financial health.
Risk Analysis
Below is a comparison of key risks for Pacific Gas & Electric Co. (PCG) and Ameren Corporation (AEE) based on the most recent data from 2024.
| Metric | Pacific Gas & Electric Co. (PCG) | Ameren Corporation (AEE) |
|---|---|---|
| Market Risk | Low beta (0.38) suggests lower volatility | Moderate beta (0.59), moderate volatility |
| Debt level | High debt-to-equity ratio (1.94, unfavorable) | High debt-to-equity ratio (1.55, unfavorable) |
| Regulatory Risk | High, due to California wildfire liabilities and strict state regulations | Moderate, with stable regulatory environment in Missouri and Illinois |
| Operational Risk | Medium, complex energy mix including nuclear and hydroelectric | Medium, diverse energy sources but coal reliance presents challenges |
| Environmental Risk | Elevated, wildfire risks and transition to cleaner energy pressure | Moderate, ongoing transition to renewables but coal impacts persist |
| Geopolitical Risk | Low, primarily domestic US operations | Low, primarily domestic US operations |
The most impactful and likely risks for both utilities are their high debt levels and regulatory risks. PCG faces significant regulatory scrutiny due to wildfire liabilities in California, posing a notable threat to financial stability. Both companies also have Altman Z-Scores in the distress zone, signaling financial distress risk, despite average Piotroski scores. Careful risk management and monitoring of regulatory developments are crucial before investment.
Which Stock to Choose?
Pacific Gas & Electric Co. (PCG) shows favorable income growth with a 292.64% net income increase over 2020–2024 and strong gross and EBIT margins. Its financial ratios are slightly unfavorable overall, with concerns on debt and interest coverage, yet it holds a very favorable rating of B-. The company is shedding value as ROIC remains below WACC but exhibits a growing ROIC trend.
Ameren Corporation (AEE) presents favorable income metrics, including a 35.71% net income growth over the period and higher net margin than PCG. Its financial ratios are also slightly unfavorable, with liquidity and debt-to-equity concerns, while maintaining a very favorable B- rating. AEE is destroying value with ROIC below WACC and a declining ROIC trend.
Considering ratings and financial evaluations, PCG might appeal to investors focused on improving profitability and long-term value creation despite current challenges, while AEE could be more aligned with those valuing stable income growth and higher margins but facing profitability erosion. The choice could depend on an investor’s risk tolerance and preference for growth versus stability.
Disclaimer: Investment carries a risk of loss of initial capital. The past performance is not a reliable indicator of future results. Be sure to understand risks before making an investment decision.
Go Further
I encourage you to read the complete analyses of Pacific Gas & Electric Co. and Ameren Corporation to enhance your investment decisions: