In today’s evolving energy landscape, Ameren Corporation and Oklo Inc. stand out as key players in the regulated electric sector. Ameren, with a long-established presence and diversified energy portfolio, contrasts sharply with Oklo’s innovative focus on advanced nuclear fission technology. Both companies share market overlap but differ in their innovation strategies, making this comparison essential. Join me as we explore which company offers the most compelling opportunity for your investment portfolio.
Table of contents
Companies Overview
I will begin the comparison between Ameren Corporation and Oklo Inc. by providing an overview of these two companies and their main differences.
Ameren Corporation Overview
Ameren Corporation is a public utility holding company operating in the United States, primarily serving residential, commercial, and industrial customers. Founded in 1881 and headquartered in St. Louis, Missouri, Ameren focuses on rate-regulated electric generation, transmission, and distribution, as well as natural gas distribution and transmission. Its energy generation mix includes coal, nuclear, natural gas, and renewable sources such as hydroelectric, wind, methane gas, and solar.
Oklo Inc. Overview
Oklo Inc., founded in 2013 and based in Santa Clara, California, designs and develops fission power plants for commercial-scale energy solutions in the U.S. The company also offers used nuclear fuel recycling services. Oklo operates within the regulated electric industry and positions itself as an innovator in nuclear energy technology, with a significantly smaller workforce compared to traditional utilities.
Key similarities and differences
Both Ameren and Oklo operate in the regulated electric utility sector in the U.S., focusing on providing reliable energy. Ameren’s business model is based on a broad energy mix and long-established infrastructure, serving diverse customer segments. In contrast, Oklo specializes in advanced nuclear fission technology and recycling, representing a niche and innovative segment with a smaller scale of operations and workforce. Their approaches reflect differing strategies within the utilities space.
Income Statement Comparison
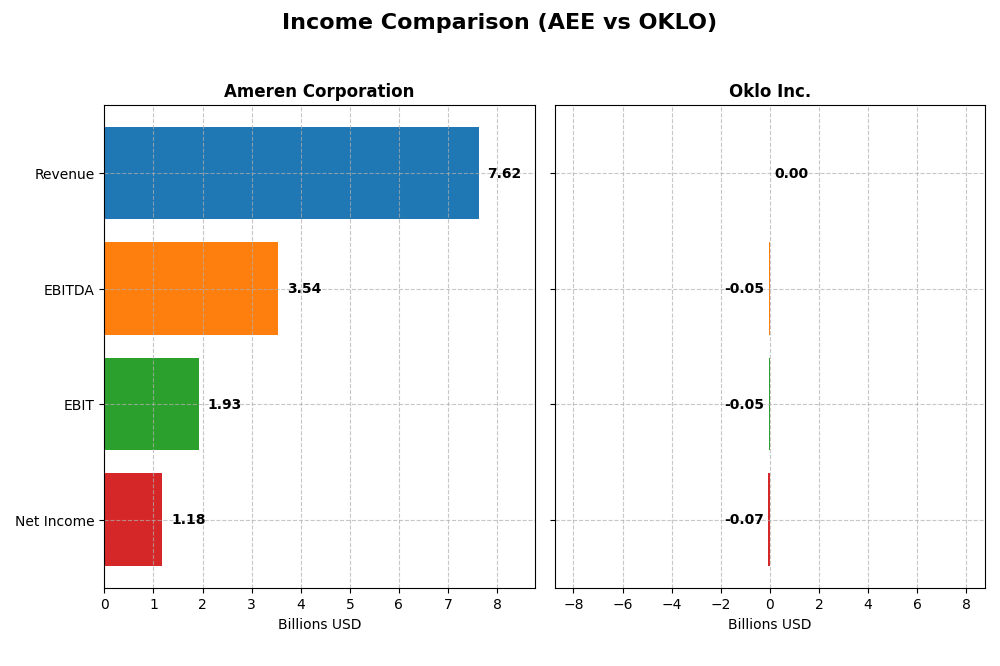
This table compares key income statement metrics for Ameren Corporation and Oklo Inc. for the fiscal year 2024, providing a snapshot of their financial performance.
| Metric | Ameren Corporation | Oklo Inc. |
|---|---|---|
| Market Cap | 27.0B | 16.5B |
| Revenue | 7.62B | 0 |
| EBITDA | 3.54B | -52.5M |
| EBIT | 1.93B | -52.8M |
| Net Income | 1.18B | -73.6M |
| EPS | 4.43 | -0.7443 |
| Fiscal Year | 2024 | 2024 |
Income Statement Interpretations
Ameren Corporation
Ameren Corporation experienced steady revenue growth from 2020 to 2024, rising from $5.79B to $7.62B, a 31.57% increase over the period. Net income also grew favorably, reaching $1.18B in 2024 with a net margin of 15.51%. Despite a slight slowdown in revenue growth last year at 1.64%, margins, especially gross and EBIT, improved, reflecting operational efficiency.
Oklo Inc.
Oklo Inc. reported no revenue from 2021 through 2024, maintaining zero gross profit and net margin. The company’s net losses deepened in 2024, with a net income of -$73.6M and negative EBIT margin. Expense growth and EPS deterioration were significant, highlighting ongoing investment in R&D and operations without generating sales or profits yet.
Which one has the stronger fundamentals?
Ameren shows stronger fundamentals, with consistent revenue and net income growth, favorable margins, and positive earnings per share trends. In contrast, Oklo’s income statement reveals persistent losses, no revenue, and unfavorable margin metrics. The financial health of Ameren appears more stable and mature, while Oklo remains in the early, unprofitable stage.
Financial Ratios Comparison
The table below compares the key financial ratios of Ameren Corporation and Oklo Inc. for the fiscal year 2024, providing insight into their profitability, liquidity, leverage, and operational efficiency.
| Ratios | Ameren Corporation (AEE) | Oklo Inc. (OKLO) |
|---|---|---|
| ROE | 9.76% | -29.35% |
| ROIC | 3.32% | -19.23% |
| P/E | 20.12 | -28.52 |
| P/B | 1.96 | 8.37 |
| Current Ratio | 0.66 | 43.47 |
| Quick Ratio | 0.44 | 43.47 |
| D/E (Debt-to-Equity) | 1.55 | 0.01 |
| Debt-to-Assets | 41.98% | 0.46% |
| Interest Coverage | 2.29 | 0 |
| Asset Turnover | 0.17 | 0 |
| Fixed Asset Turnover | 0.21 | 0 |
| Payout Ratio | 60.41% | 0% |
| Dividend Yield | 3.00% | 0% |
Interpretation of the Ratios
Ameren Corporation
Ameren shows a mixed ratio profile with favorable net margin (15.51%) and dividend yield (3.0%), but weaknesses appear in return on equity (9.76%), return on invested capital (3.32%), and liquidity ratios, including a current ratio at 0.66. The payout is supported by stable dividends, but free cash flow coverage is negative, posing sustainability concerns for distributions and buybacks.
Oklo Inc.
Oklo exhibits predominantly unfavorable profitability metrics, including a negative return on equity (-29.35%) and return on invested capital (-19.23%), reflecting its early-stage status. Liquidity ratios are distorted by an extremely high current ratio (43.47), likely due to low liabilities. The company pays no dividends, consistent with a reinvestment or growth-focused strategy prioritizing development over shareholder returns.
Which one has the best ratios?
Ameren’s ratios, despite some liquidity and profitability weaknesses, include positive dividend yields and a favorable net margin, showing more financial stability than Oklo. Oklo’s negative returns and absence of dividends highlight operational challenges typical of growth-phase firms. Overall, Ameren presents a slightly unfavorable but more balanced ratio profile compared to Oklo’s broadly unfavorable metrics.
Strategic Positioning
This section compares the strategic positioning of Ameren Corporation and Oklo Inc., including Market position, Key segments, and disruption:
Ameren Corporation
- Large regulated electric utility with significant market presence and moderate competitive pressure.
- Diversified utility with electricity and natural gas segments driving revenue, including renewable energy sources.
- Moderate exposure to technological disruption, balancing traditional generation with some renewable integration.
Oklo Inc.
- Smaller, innovative fission power plant developer facing competitive pressure in new energy technologies.
- Focused on nuclear fission power plants and used nuclear fuel recycling as core business drivers.
- High exposure to disruption, pioneering advanced nuclear technologies in energy generation.
Ameren Corporation vs Oklo Inc. Positioning
Ameren operates a diversified regulated utility business across electricity and natural gas, offering stability but moderate disruption risk. Oklo is concentrated on advanced nuclear power innovation, presenting higher technological risk and growth potential but less diversification.
Which has the best competitive advantage?
Both companies show very unfavorable MOAT evaluations with declining ROIC below WACC, indicating value destruction and weak competitive advantages under current financial performance metrics.
Stock Comparison
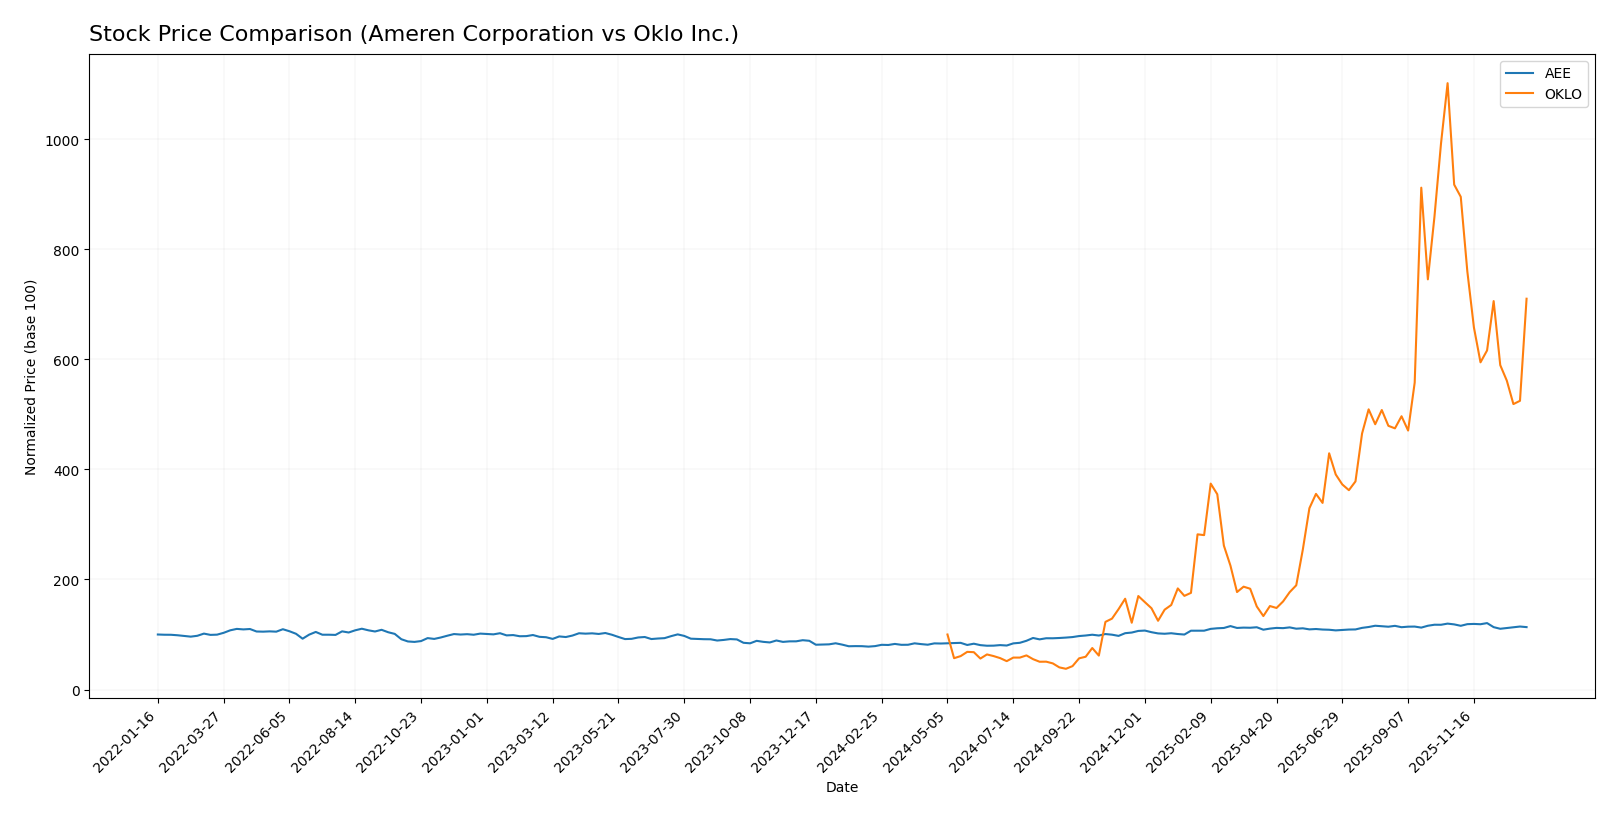
The stock prices of Ameren Corporation and Oklo Inc. have demonstrated significant movements over the past 12 months, with notable gains followed by recent declines, reflecting dynamic trading conditions and shifting investor sentiment.
Trend Analysis
Ameren Corporation’s stock showed a bullish trend over the past year with a 43.73% price increase, though the upward momentum decelerated. The stock reached a high of 106.35 and a low of 69.51, with moderate volatility at 11.4 std deviation. Recent months indicate a slight bearish correction of -4.19%.
Oklo Inc. exhibited a strong bullish trend over the past year, surging 610.11%, but this growth also decelerated. The stock experienced high volatility with a 39.02 std deviation and prices ranging from 5.59 to 163.39. Recently, Oklo faced a sharper decline of -22.59%, indicating increased selling pressure.
Comparing the two, Oklo delivered the highest market performance with a substantially larger overall gain, though both stocks encountered recent bearish trends, reflecting caution in the current trading environment.
Target Prices
Analysts present a clear consensus on target prices for Ameren Corporation and Oklo Inc., reflecting moderate to strong upside potential.
| Company | Target High | Target Low | Consensus |
|---|---|---|---|
| Ameren Corporation | 119 | 103 | 111.86 |
| Oklo Inc. | 150 | 95 | 125.67 |
The consensus target for Ameren at 111.86 suggests a roughly 12% upside from its current price near 99.91, while Oklo’s consensus at 125.67 implies about 19% potential gain from 105.31, indicating optimistic analyst expectations for both stocks.
Analyst Opinions Comparison
This section compares analysts’ ratings and grades for Ameren Corporation and Oklo Inc.:
Rating Comparison
Ameren Corporation Rating
- Rating: B-, assessed as Very Favorable overall
- Discounted Cash Flow Score: 1, rated Very Unfavorable
- ROE Score: 4, rated Favorable
- ROA Score: 3, rated Moderate
- Debt To Equity Score: 2, rated Moderate
- Overall Score: 2, rated Moderate
Oklo Inc. Rating
- Rating: C+, also considered Very Favorable overall
- Discounted Cash Flow Score: 3, rated Moderate
- ROE Score: 1, rated Very Unfavorable
- ROA Score: 1, rated Very Unfavorable
- Debt To Equity Score: 5, rated Very Favorable
- Overall Score: 2, rated Moderate
Which one is the best rated?
Based strictly on the data, Ameren Corporation has a higher ROE and ROA, but a weaker discounted cash flow and debt-to-equity score. Oklo has a stronger debt-to-equity and DCF score but significantly lower profitability metrics. Both have equal overall scores, indicating comparable moderate ratings.
Scores Comparison
Here is a comparison of the Altman Z-Score and Piotroski Score for both companies:
AEE Scores
- Altman Z-Score: 0.97, indicating financial distress.
- Piotroski Score: 6, showing average financial strength.
OKLO Scores
- Altman Z-Score: 339.43, indicating a safe financial zone.
- Piotroski Score: 2, reflecting very weak financial health.
Which company has the best scores?
OKLO has a much higher Altman Z-Score, signaling strong financial stability, but a very weak Piotroski Score. AEE shows financial distress but has a better Piotroski Score, indicating relatively stronger fundamentals.
Grades Comparison
Here is a detailed comparison of the latest grades and ratings for Ameren Corporation and Oklo Inc.:
Ameren Corporation Grades
The following table summarizes recent grades assigned to Ameren Corporation by recognized grading companies:
| Grading Company | Action | New Grade | Date |
|---|---|---|---|
| UBS | Maintain | Buy | 2025-12-17 |
| Keybanc | Downgrade | Sector Weight | 2025-12-12 |
| Mizuho | Maintain | Outperform | 2025-10-27 |
| Morgan Stanley | Maintain | Equal Weight | 2025-10-22 |
| Barclays | Maintain | Equal Weight | 2025-10-21 |
| Keybanc | Maintain | Overweight | 2025-10-15 |
| Morgan Stanley | Maintain | Equal Weight | 2025-09-25 |
| Keybanc | Maintain | Overweight | 2025-07-16 |
| UBS | Maintain | Buy | 2025-07-11 |
| Barclays | Maintain | Equal Weight | 2025-07-10 |
Ameren’s grades largely cluster around “Buy,” “Outperform,” and “Equal Weight,” showing a mostly stable to moderately positive outlook with some recent slight downgrades.
Oklo Inc. Grades
The table below presents recent grades for Oklo Inc. from established grading companies:
| Grading Company | Action | New Grade | Date |
|---|---|---|---|
| Seaport Global | Upgrade | Buy | 2025-12-08 |
| UBS | Maintain | Neutral | 2025-12-03 |
| B of A Securities | Maintain | Neutral | 2025-11-12 |
| B. Riley Securities | Maintain | Buy | 2025-11-12 |
| Wedbush | Maintain | Outperform | 2025-11-12 |
| B of A Securities | Downgrade | Neutral | 2025-09-30 |
| Seaport Global | Downgrade | Neutral | 2025-09-23 |
| Wedbush | Maintain | Outperform | 2025-09-22 |
| Wedbush | Maintain | Outperform | 2025-08-14 |
| Wedbush | Maintain | Outperform | 2025-08-12 |
Oklo’s grades show a solid presence of “Outperform” and “Buy” ratings, with some recent downgrades to “Neutral,” reflecting a mixed but generally optimistic analyst view.
Which company has the best grades?
Oklo Inc. has received a stronger consensus rating of “Buy” compared to Ameren Corporation’s “Hold,” supported by multiple “Outperform” and “Buy” grades. This difference may influence investors seeking higher growth potential, while Ameren’s more cautious grades suggest relative stability.
Strengths and Weaknesses
Below is a comparison table highlighting the key strengths and weaknesses of Ameren Corporation (AEE) and Oklo Inc. (OKLO) based on the most recent financial and operational data.
| Criterion | Ameren Corporation (AEE) | Oklo Inc. (OKLO) |
|---|---|---|
| Diversification | Moderate: Mainly electricity (6.54B USD) and natural gas (1.08B USD) revenues | Limited: Early-stage company with narrow focus in advanced nuclear technology |
| Profitability | Moderate profitability with 15.5% net margin but ROIC (3.3%) below WACC (5.2%) indicating value destruction | Unprofitable: Negative net margin and ROIC (-19.2%), shedding value significantly |
| Innovation | Traditional utility with limited innovation emphasis | High innovation potential in nuclear technology but not yet profitable |
| Global presence | Primarily regional US utility operations | Early-stage US-based company with limited global footprint |
| Market Share | Established utility with solid market share in its regions | Very small market share; still in developmental phase |
In summary, Ameren shows stable revenues and moderate profitability but struggles with declining returns on invested capital, indicating some operational inefficiencies. Oklo, while highly innovative, is currently unprofitable with significant value destruction, reflecting the risks typical of early-stage tech companies. Investors should weigh stability and moderate risk in Ameren against the high-risk, high-reward profile of Oklo.
Risk Analysis
Below is a comparative table of key risks for Ameren Corporation (AEE) and Oklo Inc. (OKLO) based on their latest financial and operational profiles for 2024.
| Metric | Ameren Corporation (AEE) | Oklo Inc. (OKLO) |
|---|---|---|
| Market Risk | Moderate, beta 0.59, stable regulated utility sector | Higher, beta 0.77, emerging nuclear tech market volatility |
| Debt Level | High, Debt-to-Equity 1.55 (unfavorable) | Very low, Debt-to-Equity 0.01 (favorable) |
| Regulatory Risk | Significant, operates in rate-regulated utilities with potential policy changes | High, nuclear energy heavily regulated with licensing challenges |
| Operational Risk | Moderate, diverse generation mix but aging infrastructure | High, early-stage tech with unproven commercial-scale deployment |
| Environmental Risk | Medium, coal and gas generation impact mitigated by renewables | Elevated, nuclear waste and safety concerns |
| Geopolitical Risk | Low, US domestic utility | Moderate, sensitive to US nuclear policy and international nuclear fuel cycles |
The most impactful risks are regulatory and operational for both companies: Ameren faces challenges from evolving energy policies and aging assets, while Oklo must manage technological risks and stringent nuclear regulations. Ameren’s higher debt and moderate market risk contrast with Oklo’s financial fragility despite low leverage. Investors should weigh regulatory and operational uncertainties carefully.
Which Stock to Choose?
Ameren Corporation (AEE) shows a generally favorable income evolution with 31.57% revenue growth over five years and a strong gross margin of 47.92%. Its financial ratios reveal a slightly unfavorable profile, with a 15.51% net margin and a 9.76% ROE, but significant debt and liquidity concerns. The company’s rating is very favorable (B-), although its Altman Z-Score signals distress.
Oklo Inc. (OKLO) displays an unfavorable income statement evolution, with zero revenue growth and negative net margin. Financial ratios are mostly unfavorable, with negative ROE and ROIC but very low debt levels and a high current ratio. Its rating is very favorable (C+), supported by a strong Altman Z-Score, yet its profitability remains weak.
Considering ratings and financial evaluations, AEE might appear more suitable for investors seeking stable income growth despite some debt and liquidity risks, while OKLO could appeal to those with a higher risk tolerance favoring a low-debt profile but facing profitability challenges. Both companies show a very unfavorable MOAT status, indicating value destruction.
Disclaimer: Investment carries a risk of loss of initial capital. The past performance is not a reliable indicator of future results. Be sure to understand risks before making an investment decision.
Go Further
I encourage you to read the complete analyses of Ameren Corporation and Oklo Inc. to enhance your investment decisions: