Home > Comparison > Utilities > NEE vs AEE
The strategic rivalry between NextEra Energy, Inc. and Ameren Corporation shapes the current dynamics of the regulated electric utilities sector. NextEra operates as a capital-intensive clean energy leader, heavily invested in renewables and transmission infrastructure. Ameren, with a diversified rate-regulated model, balances electric and natural gas distribution across multiple states. This analysis will assess which company’s trajectory offers superior risk-adjusted returns for a diversified portfolio in today’s evolving energy landscape.
Table of contents
Companies Overview
NextEra Energy and Ameren Corporation stand as major players in the regulated electric utility market in the US.
NextEra Energy, Inc.: Clean Energy Powerhouse
NextEra Energy dominates as a regulated electric utility with a massive 28,564 MW generating capacity. It earns revenue by generating, transmitting, and selling electricity, focusing heavily on renewables like wind and solar alongside nuclear and natural gas. In 2026, its strategy centers on expanding clean energy assets and battery storage projects, solidifying its leadership in sustainable power.
Ameren Corporation: Regional Utility Leader
Ameren operates as a public utility holding company serving Missouri and Illinois. It generates revenue primarily through rate-regulated electric and natural gas distribution, relying on coal, nuclear, and renewable sources like hydro and wind. Its 2026 focus remains on optimizing regulated electric transmission and expanding infrastructure within its core Midwestern markets.
Strategic Collision: Similarities & Divergences
Both companies thrive in regulated utility markets but diverge in scale and innovation focus. NextEra pursues an aggressive clean energy transition, while Ameren emphasizes regulated regional infrastructure stability. They compete mainly in electricity generation and distribution, but NextEra’s renewable scale contrasts with Ameren’s steady regulated utility model. Investors face distinct risk-reward profiles: NextEra bets on growth through green technology; Ameren offers consistent regulated cash flows.
Income Statement Comparison
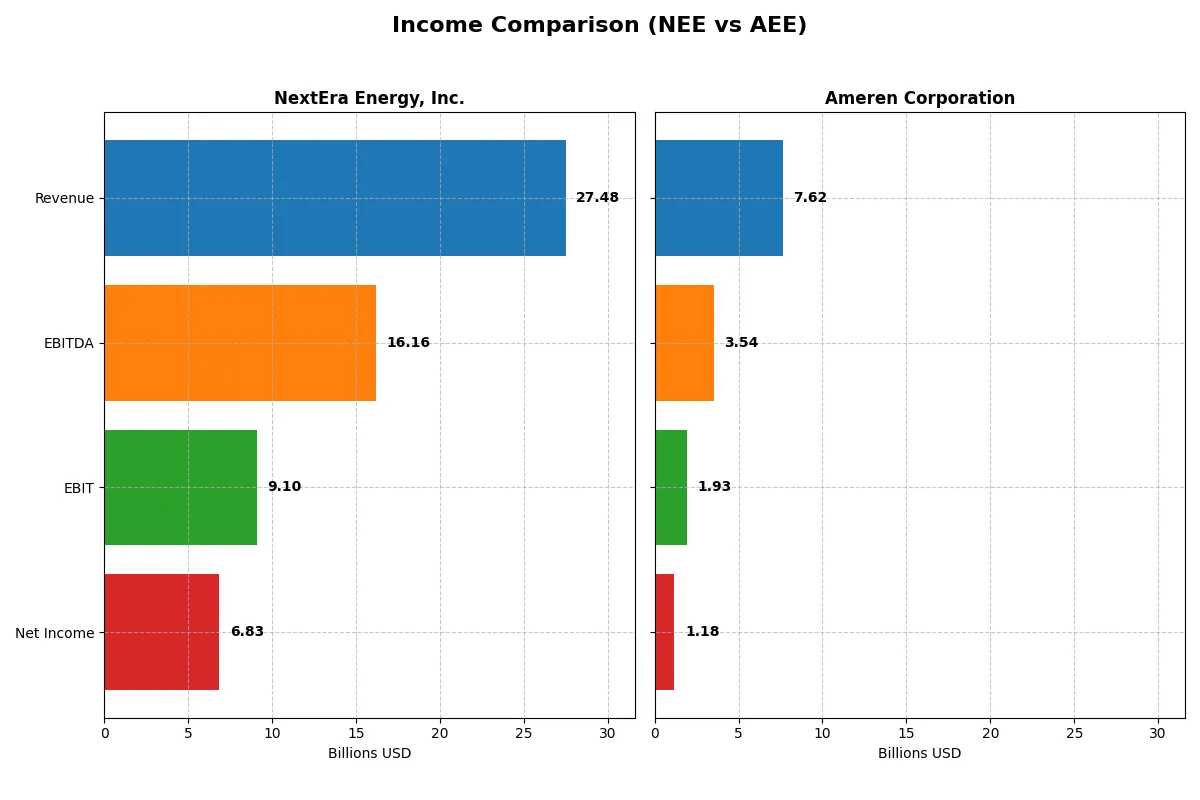
The following data dissects the core profitability and scalability of both corporate engines to reveal who dominates the bottom line:
| Metric | NextEra Energy, Inc. (NEE) | Ameren Corporation (AEE) |
|---|---|---|
| Revenue | 27.5B | 7.62B |
| Cost of Revenue | 10.2B | 3.97B |
| Operating Expenses | 8.98B | 2.14B |
| Gross Profit | 17.3B | 3.65B |
| EBITDA | 16.2B | 3.54B |
| EBIT | 9.10B | 1.93B |
| Interest Expense | 4.57B | 663M |
| Net Income | 6.83B | 1.18B |
| EPS | 3.31 | 4.43 |
| Fiscal Year | 2025 | 2024 |
Income Statement Analysis: The Bottom-Line Duel
This income statement comparison reveals which company operates with superior efficiency and delivers stronger profit performance.
NextEra Energy, Inc. Analysis
NextEra’s revenue climbed steadily to $27.5B in 2025, with net income at $6.8B, reflecting solid growth momentum. Its gross margin of 62.8% and net margin near 25% demonstrate robust profitability. Despite rising interest costs, NextEra sustains strong EBIT margin expansion, signaling operational efficiency and healthy cash flow generation.
Ameren Corporation Analysis
Ameren’s revenue reached $7.6B in 2024, with net income of $1.18B, showing modest growth. The company maintains a respectable gross margin of 47.9% and net margin of 15.5%, indicating decent cost control. However, revenue and EBIT growth remain tepid, suggesting a more stable but less dynamic earnings profile compared to peers.
Margin Dominance vs. Steady Scale
NextEra outpaces Ameren with superior margins and faster income growth, establishing it as the more efficient profit engine. Ameren delivers consistent but slower expansion with lower margin leverage. Investors seeking strong margin improvement and growth may favor NextEra’s profile, while those prioritizing stable returns might lean toward Ameren’s steady footprint.
Financial Ratios Comparison
These vital ratios act as a diagnostic tool to expose the underlying fiscal health, valuation premiums, and capital efficiency of each company:
| Ratios | NextEra Energy, Inc. (NEE) | Ameren Corporation (AEE) |
|---|---|---|
| ROE | 13.9% | 9.8% |
| ROIC | 4.0% | 3.3% |
| P/E | 21.2 | 20.1 |
| P/B | 2.94 | 1.96 |
| Current Ratio | 0.47 | 0.66 |
| Quick Ratio | 0.38 | 0.44 |
| D/E (Debt to Equity) | 1.64 | 1.55 |
| Debt-to-Assets | 43.3% | 42.0% |
| Interest Coverage | 3.35 | 2.29 |
| Asset Turnover | 0.13 | 0.17 |
| Fixed Asset Turnover | 0.18 | 0.21 |
| Payout ratio | 61.0% | 60.4% |
| Dividend yield | 2.87% | 3.00% |
| Fiscal Year | 2024 | 2024 |
Efficiency & Valuation Duel: The Vital Signs
Financial ratios serve as a company’s DNA, uncovering hidden risks and operational excellence critical for investment insight.
NextEra Energy, Inc.
NextEra shows a solid net margin of 28.06%, indicating strong profitability, but its ROIC at 4.04% lags behind the 6.41% WACC, signaling inefficient capital use. The P/E of 21.23 suggests a fairly valued stock. A 2.87% dividend yield supports steady shareholder returns amid moderate operational challenges.
Ameren Corporation
Ameren posts a lower net margin of 15.51% and a weaker ROE of 9.76%, reflecting less profitability and capital efficiency than NextEra. Its P/E of 20.12 indicates a neutral valuation with a slightly higher dividend yield at 3.0%. Despite better interest coverage, Ameren struggles with asset turnover, signaling operational inefficiencies.
Operational Efficiency vs. Dividend Appeal
Both companies exhibit a slightly unfavorable ratio profile with equal favorable and unfavorable ratio percentages. NextEra excels in profitability but faces capital efficiency headwinds; Ameren offers a marginally better dividend yield and interest coverage. Investors prioritizing dividends may lean toward Ameren, while those valuing profitability might prefer NextEra.
Which one offers the Superior Shareholder Reward?
NextEra Energy (NEE) and Ameren Corporation (AEE) both pay dividends with yields around 3%. NEE’s payout ratio hovers near 61%, supported by FCF coverage above 100%, signaling sustainable dividends. AEE matches yield but shows weaker free cash flow, with negative FCF per share due to heavy capex, pressuring dividend sustainability. Buybacks are modest at NEE but nearly absent at AEE, limiting total shareholder return. NEE’s balanced dividend and buyback strategy, backed by stronger FCF and margins, offers a more robust, sustainable shareholder reward in 2026.
Comparative Score Analysis: The Strategic Profile
The radar chart reveals the fundamental DNA and strategic trade-offs of NextEra Energy, Inc. and Ameren Corporation side by side:
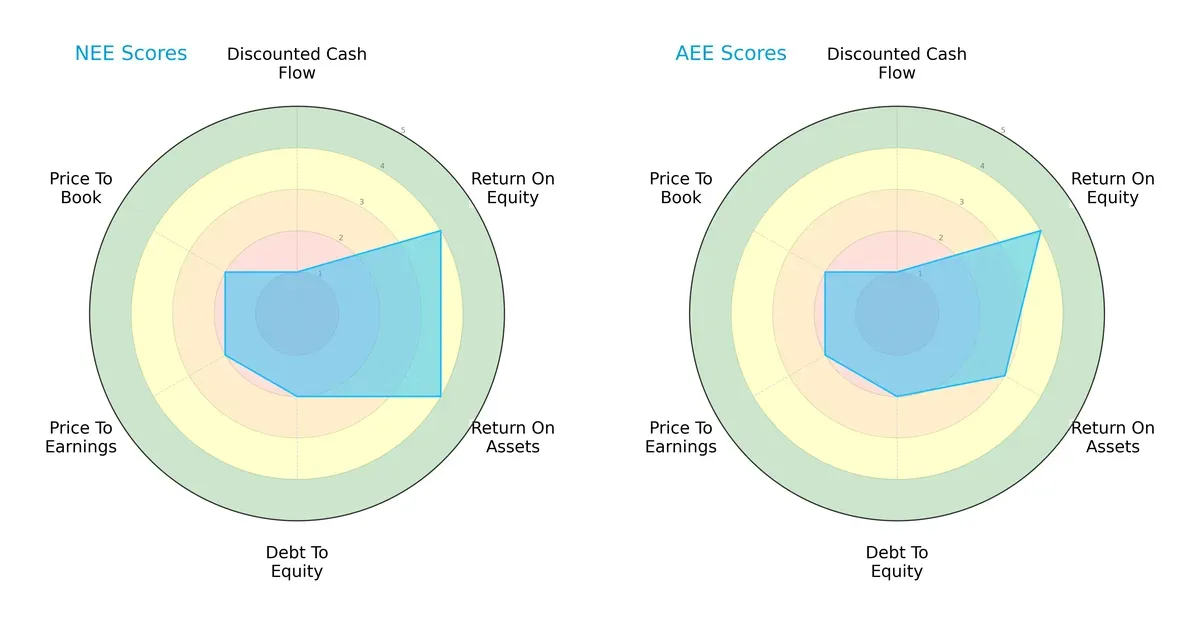
NextEra Energy shows stronger asset utilization (ROA 4 vs. 3) and a slightly better overall score (3 vs. 2). Both firms share identical ROE (4) and debt-to-equity scores (2), signaling similar leverage risk. Their valuation metrics (PE/PB) align at moderate levels. NextEra’s profile is more balanced, while Ameren leans on steady equity returns rather than operational efficiency.
Bankruptcy Risk: Solvency Showdown
NextEra Energy’s Altman Z-Score (1.21) edges higher than Ameren’s (0.98), but both remain in the distress zone:
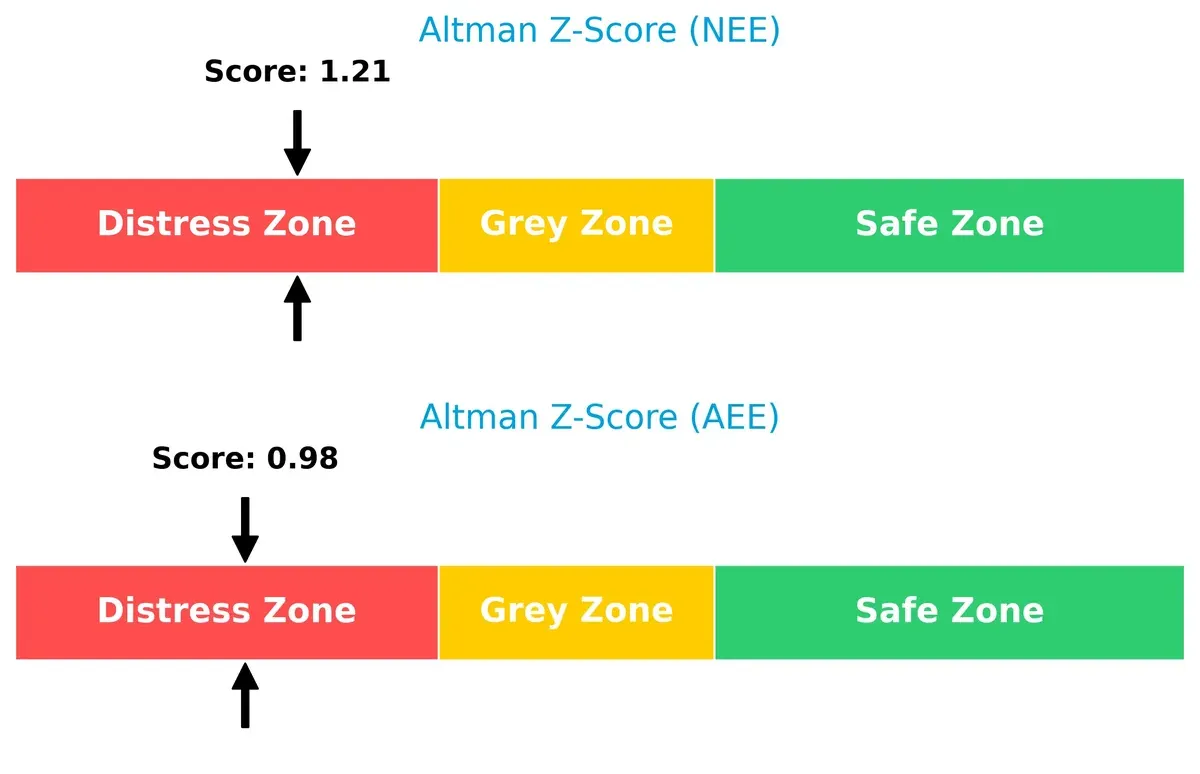
This signals elevated bankruptcy risk for both firms in the current cycle. Investors must weigh this fragility carefully, as neither company currently demonstrates strong solvency buffers.
Financial Health: Quality of Operations
NextEra and Ameren share identical Piotroski F-Scores of 6, indicating average financial health:
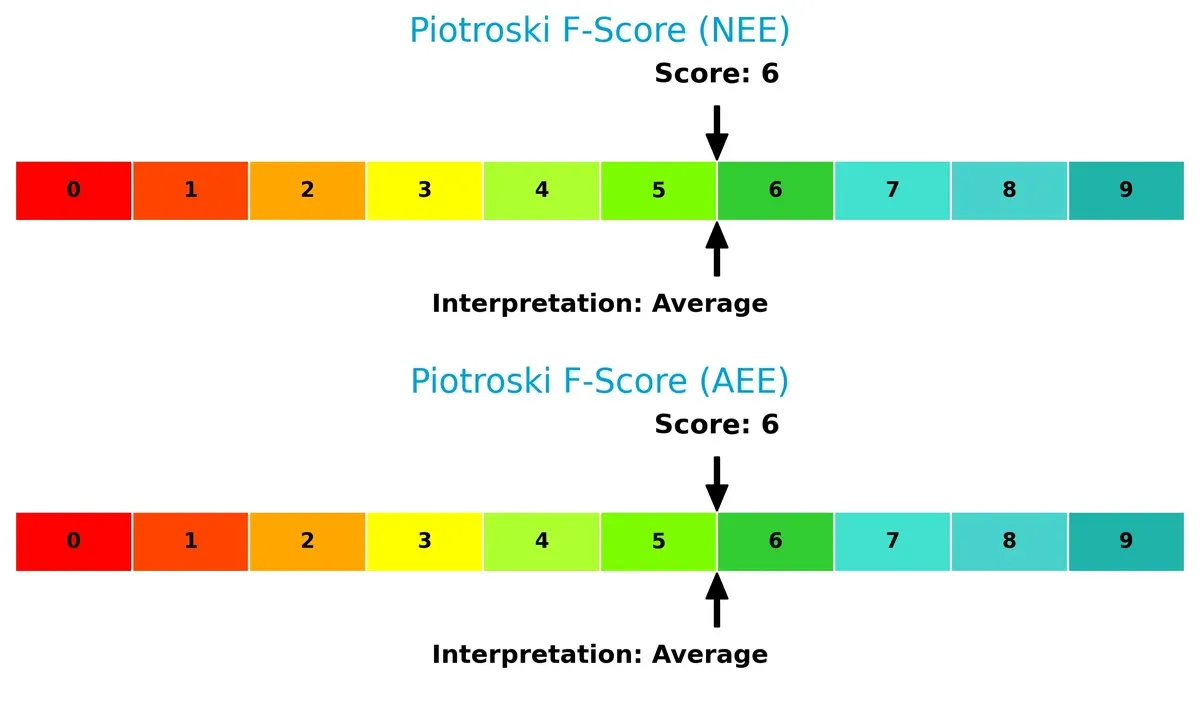
Neither company shows acute red flags, but neither stands out as a financial fortress. Both would benefit from improving profitability and liquidity metrics to strengthen operational resilience.
How are the two companies positioned?
This section dissects the operational DNA of NextEra Energy and Ameren by comparing their revenue distribution and internal dynamics. The goal is to confront their economic moats and identify which model offers the most resilient, sustainable competitive advantage today.
Revenue Segmentation: The Strategic Mix
This comparison dissects how NextEra Energy, Inc. and Ameren Corporation diversify their income streams and where their primary sector bets lie:
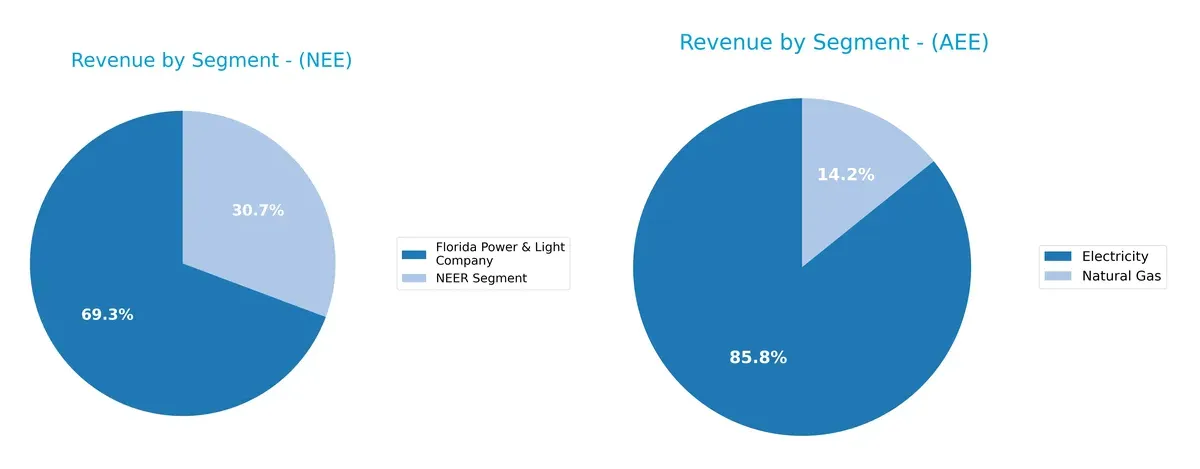
NextEra Energy’s 2024 revenue pivots mainly on Florida Power & Light at $17B, with NextEra Energy Resources contributing $7.5B. This mix shows moderate diversification anchored in regulated utility and renewable assets. Ameren relies heavily on Electricity at $6.54B, supplemented by Natural Gas at $1.08B, revealing a more concentrated utility focus. NextEra’s broader portfolio reduces concentration risk, while Ameren’s bet on traditional energy may face headwinds amid the energy transition.
Strengths and Weaknesses Comparison
This table compares the Strengths and Weaknesses of NextEra Energy, Inc. and Ameren Corporation:
NextEra Energy Strengths
- High net margin at 28.06% shows strong profitability
- Favorable WACC at 6.41% indicates efficient capital cost
- Robust dividend yield of 2.87% supports shareholder returns
- Large revenue from Florida Power & Light Company segment
Ameren Strengths
- Favorable net margin at 15.51% indicates solid profitability
- Lower WACC at 5.26% suggests cheaper financing costs
- Dividend yield of 3.0% provides steady income
- Revenue diversification with Electricity and Natural Gas segments
NextEra Energy Weaknesses
- Low current ratio at 0.47 signals liquidity risk
- High debt-to-equity ratio of 1.64 poses leverage concerns
- Interest coverage ratio at 1.99 is weak for debt servicing
- ROIC at 4.04% below WACC reflects inefficient capital use
- Low asset and fixed asset turnover ratios
Ameren Weaknesses
- Current ratio at 0.66 indicates liquidity constraints
- Debt-to-equity ratio at 1.55 raises leverage risk
- ROE at 9.76% below sector averages
- ROIC at 3.32% under WACC level
- Asset turnover ratios remain unfavorable
NextEra Energy’s strengths lie in superior profitability and dividend yield but face liquidity and capital efficiency challenges. Ameren shows solid profitability and financing costs but also struggles with liquidity and returns on capital. Both companies share similar financial risks affecting their strategic flexibility.
The Moat Duel: Analyzing Competitive Defensibility
A structural moat is the only barrier protecting long-term profits from relentless competitive erosion. Let’s dissect how each company defends its turf:
NextEra Energy, Inc.: Innovation-Fueled Renewable Advantage
NextEra leverages intangible assets and regulatory positioning, reflected in robust margins and high revenue growth. However, declining ROIC signals looming threats to its moat in 2026.
Ameren Corporation: Regulated Stability with Cost Discipline
Ameren’s moat stems from cost advantages within regulated markets. Its steadier margins and conservative growth contrast with NextEra’s volatility. Yet, a shrinking ROIC warns of margin pressure ahead.
Verdict: Innovation Momentum vs. Regulated Resilience
Both firms face deteriorating ROIC trends, eroding their moats. NextEra’s higher growth and innovation offer a wider moat, but Ameren’s cost control provides deeper short-term stability. NextEra remains better positioned to defend market share if it reverses profitability decline.
Which stock offers better returns?
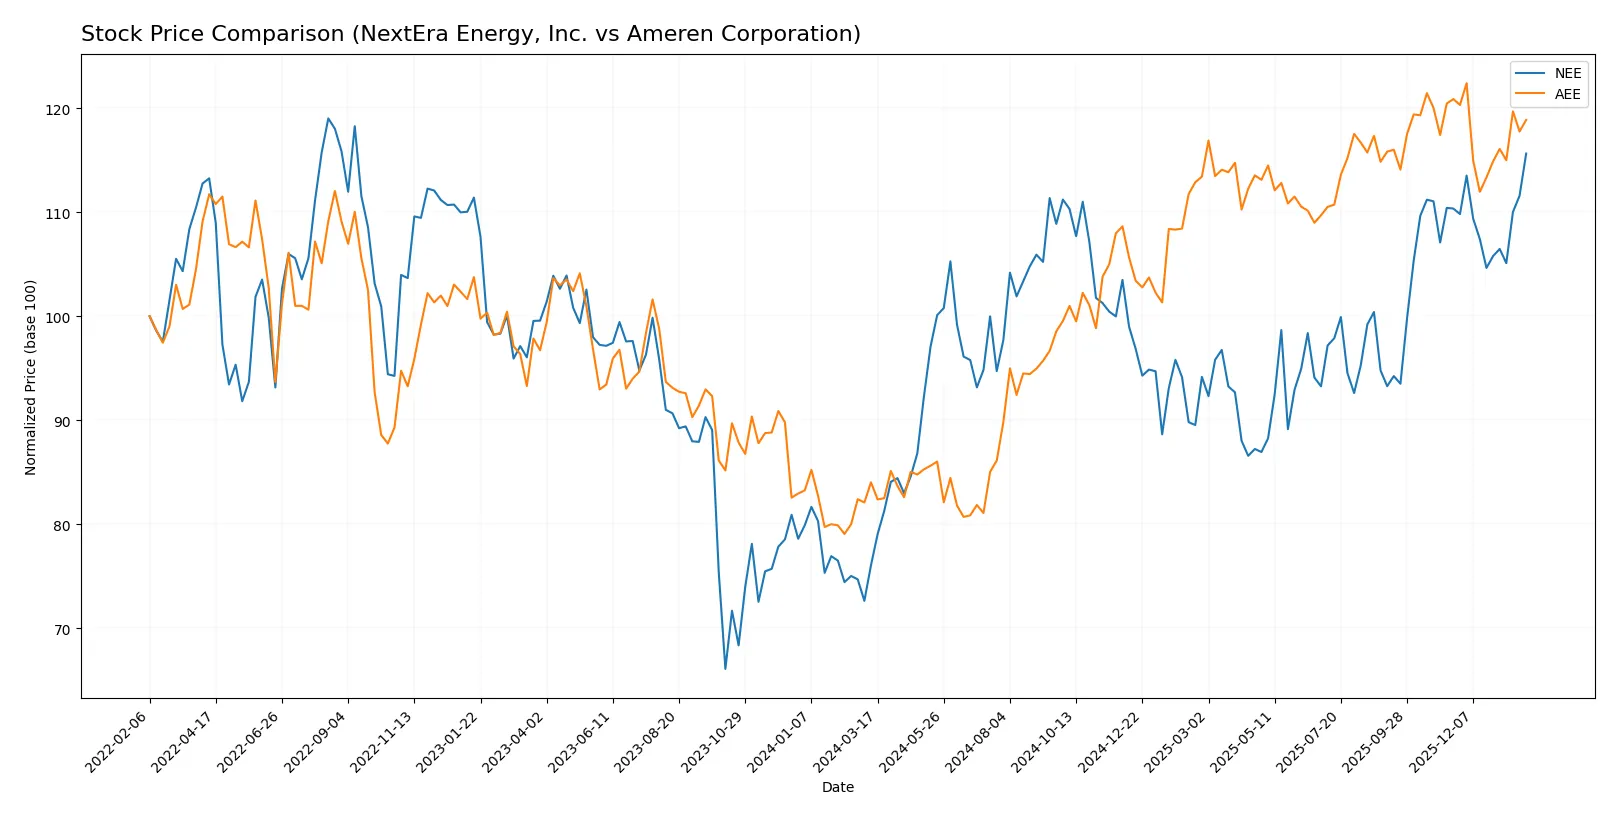
Over the past year, NextEra Energy and Ameren Corporation both posted significant gains, with NextEra showing a stronger overall price rise but signs of recent deceleration in momentum.
Trend Comparison
NextEra Energy’s stock rose 52.05% over the past 12 months, indicating a bullish trend with decelerating acceleration and a high of 87.9. Recent months show a moderate 4.79% gain with reduced volatility.
Ameren Corporation’s stock increased 41.46% over the same period, also bullish but with a higher price volatility and a peak of 106.35. Recently, it experienced a slight 1.66% decline, signaling a neutral short-term trend.
NextEra outperformed Ameren with a stronger annual gain despite recent slowing momentum, delivering the highest market return in this comparison.
Target Prices
Analysts present a bullish consensus for both NextEra Energy and Ameren Corporation.
| Company | Target Low | Target High | Consensus |
|---|---|---|---|
| NextEra Energy, Inc. | 84 | 104 | 93.09 |
| Ameren Corporation | 104 | 116 | 111 |
NextEra’s consensus target at 93.09 exceeds its current price of 87.9, signaling moderate upside potential. Ameren’s target consensus of 111 also suggests significant room for appreciation from its 103.28 price.

Don’t Let Luck Decide Your Entry Point
Optimize your entry points with our advanced ProRealTime indicators. You’ll get efficient buy signals with precise price targets for maximum performance. Start outperforming now!
How do institutions grade them?
NextEra Energy, Inc. Grades
The table below summarizes recent grades from major financial institutions for NextEra Energy, Inc.:
| Grading Company | Action | New Grade | Date |
|---|---|---|---|
| Mizuho | Maintain | Neutral | 2026-01-28 |
| Argus Research | Maintain | Buy | 2026-01-28 |
| BMO Capital | Maintain | Outperform | 2026-01-27 |
| Wells Fargo | Maintain | Overweight | 2026-01-20 |
| Barclays | Maintain | Equal Weight | 2026-01-15 |
| Jefferies | Maintain | Hold | 2025-12-31 |
| UBS | Maintain | Buy | 2025-12-17 |
| JP Morgan | Maintain | Overweight | 2025-12-11 |
| UBS | Maintain | Buy | 2025-12-10 |
| BMO Capital | Maintain | Outperform | 2025-12-10 |
Ameren Corporation Grades
Recent institutional grades for Ameren Corporation are listed in the following table:
| Grading Company | Action | New Grade | Date |
|---|---|---|---|
| Wells Fargo | Maintain | Overweight | 2026-01-20 |
| Barclays | Maintain | Equal Weight | 2026-01-15 |
| JP Morgan | Maintain | Neutral | 2026-01-15 |
| UBS | Maintain | Buy | 2025-12-17 |
| Keybanc | Downgrade | Sector Weight | 2025-12-12 |
| Mizuho | Maintain | Outperform | 2025-10-27 |
| Morgan Stanley | Maintain | Equal Weight | 2025-10-22 |
| Barclays | Maintain | Equal Weight | 2025-10-21 |
| Keybanc | Maintain | Overweight | 2025-10-15 |
| Morgan Stanley | Maintain | Equal Weight | 2025-09-25 |
Which company has the best grades?
NextEra Energy receives a higher concentration of “Buy,” “Outperform,” and “Overweight” grades. Ameren’s grades lean more toward “Equal Weight” and neutral positions, with a recent downgrade by Keybanc. Investors may interpret NextEra’s stronger grades as greater institutional confidence.
Risks specific to each company
The following categories identify the critical pressure points and systemic threats facing both firms in the 2026 market environment:
1. Market & Competition
NextEra Energy, Inc.
- Dominates clean energy markets with strong renewable assets but faces intense competition in regulated electric sectors.
Ameren Corporation
- Operates in regulated markets with diversified energy sources but competes with larger peers investing heavily in renewables.
2. Capital Structure & Debt
NextEra Energy, Inc.
- High debt-to-equity ratio (1.64) and low interest coverage (1.99) raise financial risk concerns.
Ameren Corporation
- Slightly better leverage (D/E 1.55) and stronger interest coverage (2.92), but still moderate financial risk.
3. Stock Volatility
NextEra Energy, Inc.
- Beta of 0.73 suggests moderate volatility below market average, favoring risk-averse investors.
Ameren Corporation
- Beta of 0.59 indicates lower volatility, making it a more stable option in turbulent markets.
4. Regulatory & Legal
NextEra Energy, Inc.
- Exposure to evolving clean energy policies and grid regulations could increase compliance costs.
Ameren Corporation
- Faces similar regulatory risks but benefits from stable rate-regulated operations in Missouri and Illinois.
5. Supply Chain & Operations
NextEra Energy, Inc.
- Large asset base (28,564 MW) and extensive transmission lines create operational complexity and supply chain dependencies.
Ameren Corporation
- Smaller scale and diversified segments reduce operational risks but limit economies of scale.
6. ESG & Climate Transition
NextEra Energy, Inc.
- Strong focus on renewables and battery storage aligns with ESG trends, boosting long-term resilience.
Ameren Corporation
- Transition slower with coal still significant; ESG pressures persist but progress ongoing.
7. Geopolitical Exposure
NextEra Energy, Inc.
- Primarily US-focused, limiting geopolitical risks but vulnerable to domestic policy shifts.
Ameren Corporation
- Also US-centric with regional exposure; geopolitical risk minimal but regulatory shifts remain a threat.
Which company shows a better risk-adjusted profile?
NextEra’s dominant position in renewables is offset by elevated debt and financial distress signals. Ameren exhibits lower volatility and slightly stronger financial metrics but has slower ESG progress. Both face regulatory and operational risks typical of utilities in transition. Ameren’s marginally stronger interest coverage and lower beta suggest a better risk-adjusted profile. Notably, NextEra’s Altman Z-score near 1.2 signals distress, while Ameren’s below 1.0 is more concerning, demanding cautious scrutiny.
Final Verdict: Which stock to choose?
NextEra Energy, Inc. (NEE) excels as a cash-generating powerhouse with robust income growth and a commanding market position in renewable energy. Its declining ROIC and tight liquidity ratios are points of vigilance, signaling operational challenges. NEE suits investors targeting aggressive growth with tolerance for capital efficiency risks.
Ameren Corporation (AEE) offers a strategic moat rooted in regulated utility stability and steady dividend yield. While its growth is modest compared to NEE, AEE presents a comparatively safer profile with more balanced leverage and better interest coverage. It fits well in GARP (Growth at a Reasonable Price) portfolios seeking income plus moderate growth.
If you prioritize growth and industry leadership, NEE is the compelling choice due to its superior revenue expansion and income quality despite capital allocation headwinds. However, if you seek stability and a conservative growth-income blend, AEE offers better financial steadiness and dividend reliability, albeit with slower momentum.
Disclaimer: Investment carries a risk of loss of initial capital. The past performance is not a reliable indicator of future results. Be sure to understand risks before making an investment decision.
Go Further
I encourage you to read the complete analyses of NextEra Energy, Inc. and Ameren Corporation to enhance your investment decisions: