In the evolving energy sector, Ameren Corporation (AEE) and FirstEnergy Corp. (FE) stand out as key players in regulated electric utilities. Both companies operate extensive generation, transmission, and distribution networks across multiple U.S. states, blending traditional power sources with renewable energy initiatives. Their overlapping markets and innovation strategies make them ideal candidates for a comparative investment analysis. Join me as we explore which company offers the most compelling opportunity for your portfolio.

Table of contents
Companies Overview
I will begin the comparison between Ameren Corporation and FirstEnergy Corp. by providing an overview of these two companies and their main differences.
Ameren Corporation Overview
Ameren Corporation is a public utility holding company operating in the regulated electric and natural gas sectors in the United States. It generates electricity through coal, nuclear, natural gas, and renewable sources, serving residential, commercial, and industrial customers. Headquartered in St. Louis, Missouri, Ameren operates through segments including Ameren Missouri and Ameren Illinois, focusing on generation, transmission, and distribution.
FirstEnergy Corp. Overview
FirstEnergy Corp. generates, transmits, and distributes electricity primarily in the eastern US, serving about 6 million customers. It owns coal, nuclear, hydroelectric, natural gas, wind, and solar power facilities, operating extensive transmission and distribution networks across multiple states. Incorporated in 1996 and based in Akron, Ohio, FirstEnergy’s business segments include regulated distribution and transmission operations.
Key similarities and differences
Both companies operate in the regulated electric utility industry and generate power from diverse sources including coal, nuclear, natural gas, and renewables. Ameren has a slightly smaller market cap ($27B) than FirstEnergy ($25.8B), but FirstEnergy employs more staff (12,294 vs. 8,981). Ameren’s operations focus on Missouri and Illinois, while FirstEnergy serves a broader multi-state region in the eastern US. Both emphasize transmission and distribution in their business models.
Income Statement Comparison
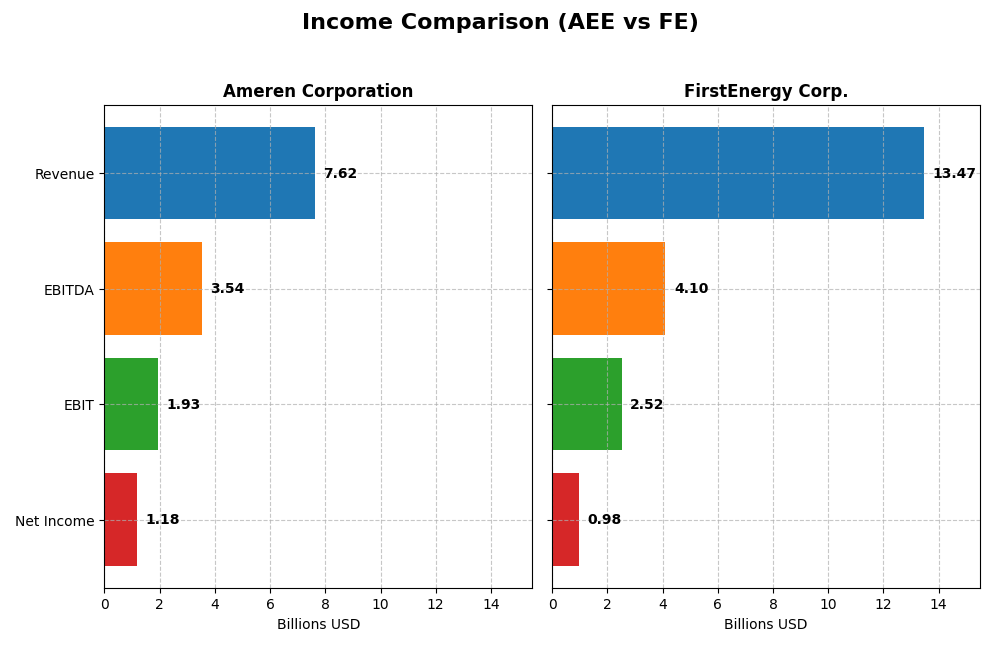
The table below compares key income statement metrics for Ameren Corporation and FirstEnergy Corp. for the fiscal year 2024, reflecting their financial performance in USD.
| Metric | Ameren Corporation (AEE) | FirstEnergy Corp. (FE) |
|---|---|---|
| Market Cap | 27.0B | 25.8B |
| Revenue | 7.62B | 13.47B |
| EBITDA | 3.54B | 4.10B |
| EBIT | 1.93B | 2.52B |
| Net Income | 1.18B | 978M |
| EPS | 4.43 | 1.70 |
| Fiscal Year | 2024 | 2024 |
Income Statement Interpretations
Ameren Corporation
Ameren Corporation’s revenue increased steadily from 5.79B in 2020 to 7.62B in 2024, with net income rising from 871M to 1.18B over the same period. Gross and EBIT margins remained favorable around 48% and 25%, respectively. In 2024, revenue growth slowed to 1.64%, yet gross profit growth was positive at 5.36%, indicating improved operational efficiency despite modest top-line expansion.
FirstEnergy Corp.
FirstEnergy’s revenue grew from 10.79B in 2020 to 13.47B in 2024, with net income fluctuating and ultimately declining from 1.08B to 978M. Gross margin stood strong at 67.52%, while EBIT margin was lower at 18.67%. The latest year showed moderate revenue growth of 4.68%, but net margin and EPS declined, reflecting challenges in profitability despite top-line gains.
Which one has the stronger fundamentals?
Ameren demonstrates stronger fundamentals with consistent revenue and net income growth, stable and favorable margins, and an overall positive income statement evaluation. FirstEnergy, while showing higher gross margins, faces unfavorable net income trends and margin contractions, leading to a less favorable financial outlook over the period analyzed.
Financial Ratios Comparison
The table below presents a side-by-side comparison of key financial ratios for Ameren Corporation (AEE) and FirstEnergy Corp. (FE) based on their most recent fiscal year, 2024.
| Ratios | Ameren Corporation (AEE) | FirstEnergy Corp. (FE) |
|---|---|---|
| ROE | 9.76% | 7.85% |
| ROIC | 3.32% | 3.66% |
| P/E | 20.12 | 23.39 |
| P/B | 1.96 | 1.84 |
| Current Ratio | 0.66 | 0.56 |
| Quick Ratio | 0.44 | 0.45 |
| D/E (Debt to Equity) | 1.55 | 1.95 |
| Debt-to-Assets | 42.0% | 46.6% |
| Interest Coverage | 2.29 | 2.35 |
| Asset Turnover | 0.17 | 0.26 |
| Fixed Asset Turnover | 0.21 | 0.33 |
| Payout Ratio | 60.4% | 99.2% |
| Dividend Yield | 3.00% | 4.24% |
Interpretation of the Ratios
Ameren Corporation
Ameren shows mixed financial health with a favorable net margin of 15.51% and dividend yield at 3.0%, but unfavorable returns on equity (9.76%) and invested capital (3.32%). Liquidity ratios including current (0.66) and quick ratios (0.44) are weak, raising potential concerns. Ameren pays dividends with a stable yield, though some coverage metrics indicate caution.
FirstEnergy Corp.
FirstEnergy’s ratios reflect moderate performance: a neutral net margin of 7.26% and a higher dividend yield of 4.24%. However, returns on equity (7.85%) and capital (3.66%) are unfavorable, and liquidity ratios are low (current ratio 0.56). The company maintains dividend payments, but its leverage and turnover ratios suggest operational challenges.
Which one has the best ratios?
Both Ameren and FirstEnergy present slightly unfavorable overall ratio profiles with half of their key metrics flagged as weak. Ameren has a stronger net margin and dividend yield, whereas FirstEnergy offers a higher yield but weaker returns and liquidity. Neither stands out decisively, reflecting trade-offs in profitability, liquidity, and leverage.
Strategic Positioning
This section compares the strategic positioning of Ameren Corporation and FirstEnergy Corp., including market position, key segments, and exposure to technological disruption:
Ameren Corporation
- Operates as a public utility with steady market cap near $27B, moderate beta indicating stable market position.
- Key segments include electricity generation and natural gas distribution, driven by regulated electric and gas operations.
- Generates electricity via coal, nuclear, gas, and renewables, indicating partial exposure to energy transition risks.
FirstEnergy Corp.
- Utility firm with similar market cap around $26B, slightly higher beta showing moderate market risk.
- Focuses on regulated distribution and transmission, serving ~6M customers in multiple states.
- Owns diverse generation assets including coal, nuclear, gas, wind, solar; transmission extensive.
Ameren Corporation vs FirstEnergy Corp. Positioning
Ameren shows a diversified segment approach with electric and natural gas focus, while FirstEnergy concentrates on regulated distribution and transmission. Ameren’s renewable integration contrasts with FirstEnergy’s broader geographical footprint and customer base.
Which has the best competitive advantage?
Both companies have a very unfavorable MOAT evaluation due to declining ROIC below WACC, indicating value destruction and decreasing profitability, thus neither currently demonstrates a sustainable competitive advantage based on the provided data.
Stock Comparison
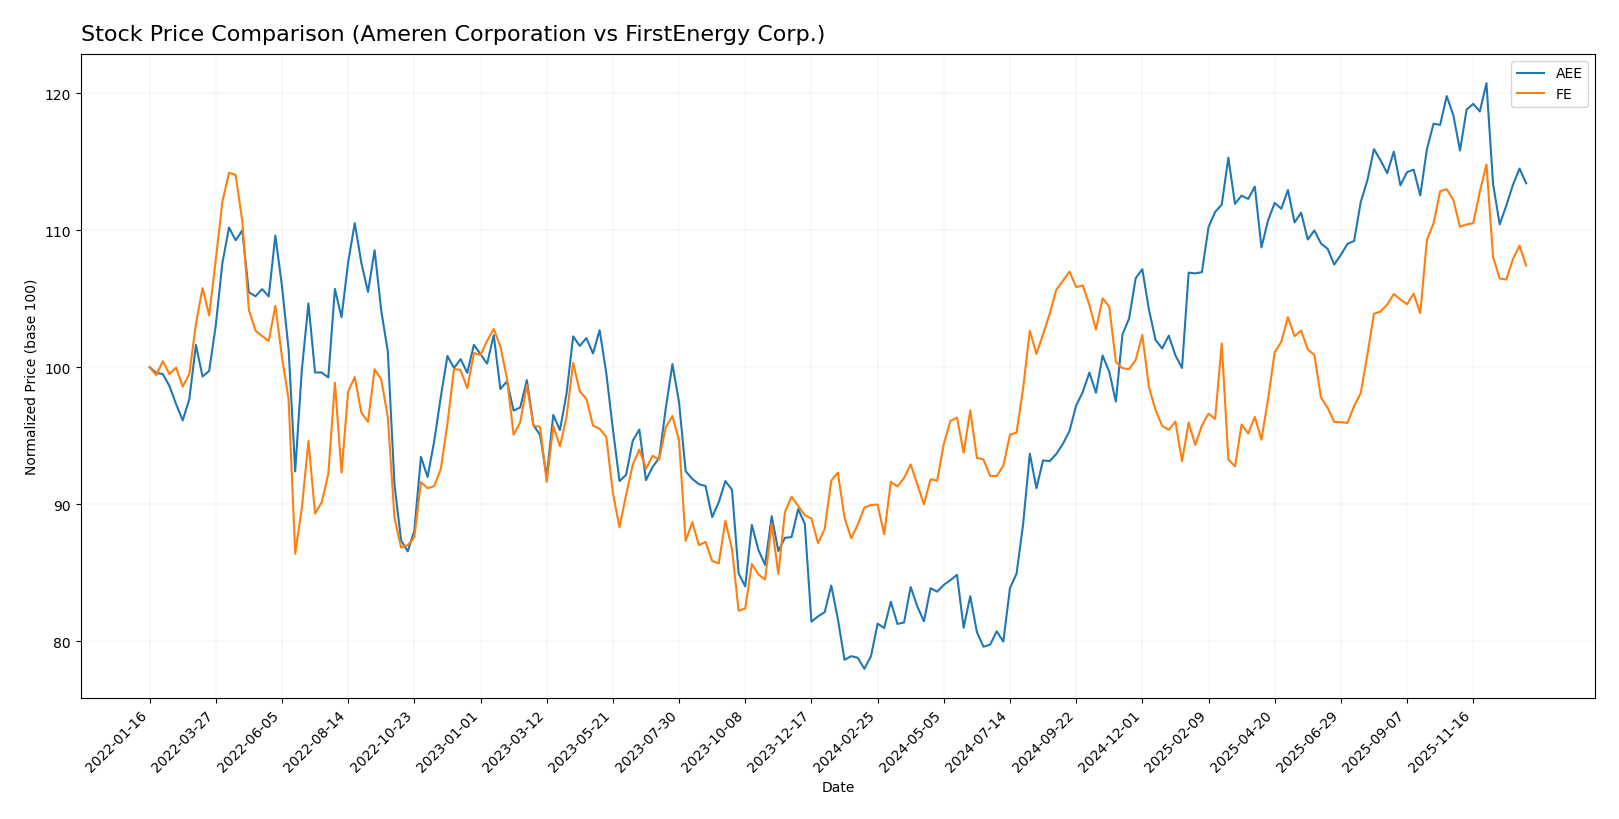
The stock prices of Ameren Corporation (AEE) and FirstEnergy Corp. (FE) have shown significant movements over the past year, with both experiencing bullish trends marked by decelerating momentum and recent slight declines in price.
Trend Analysis
Ameren Corporation (AEE) exhibited a 43.73% price increase over the past 12 months, indicating a bullish trend with deceleration. The stock’s price ranged from a low of 69.51 to a high of 106.35, with recent weeks showing a -4.19% decline.
FirstEnergy Corp. (FE) recorded a 19.42% price increase over the same period, also reflecting a bullish trend with deceleration. Its price fluctuated between 36.5 and 47.72, with recent performance declining by -4.27%.
Comparing the two, Ameren’s stock delivered the highest market performance with a 43.73% gain versus FirstEnergy’s 19.42%, despite both showing similar recent downward trends.
Target Prices
The current target price consensus for these utilities stocks indicates moderate upside potential.
| Company | Target High | Target Low | Consensus |
|---|---|---|---|
| Ameren Corporation | 119 | 103 | 111.86 |
| FirstEnergy Corp. | 54 | 46 | 49.29 |
Analysts expect Ameren’s price to rise from $99.91 to about $111.86 on average, suggesting a moderate gain. FirstEnergy’s consensus target of $49.29 is also above its current $44.65 price, indicating a positive outlook.
Analyst Opinions Comparison
This section compares analysts’ ratings and financial scores for Ameren Corporation and FirstEnergy Corp.:
Rating Comparison
Ameren Corporation Rating
- Rating: B- indicating a very favorable assessment.
- Discounted Cash Flow Score: 1, very unfavorable, suggesting potential overvaluation concerns.
- ROE Score: 4, favorable, showing efficient profit generation from equity.
- ROA Score: 3, moderate, indicating average asset utilization.
- Debt To Equity Score: 2, moderate, suggesting balanced financial risk.
- Overall Score: 2, moderate, reflecting a balanced but cautious overall outlook.
FirstEnergy Corp. Rating
- Rating: B indicating a very favorable assessment.
- Discounted Cash Flow Score: 4, favorable, indicating attractive valuation based on cash flows.
- ROE Score: 4, favorable, also reflecting strong profit efficiency.
- ROA Score: 3, moderate, showing similar asset effectiveness.
- Debt To Equity Score: 1, very unfavorable, pointing to higher financial risk.
- Overall Score: 3, moderate, slightly better overall financial standing.
Which one is the best rated?
Based strictly on the provided data, FirstEnergy Corp. holds a better overall rating (B vs. B-) and a higher overall score (3 vs. 2), supported by a stronger discounted cash flow score. However, Ameren has a superior debt-to-equity score, indicating lower financial risk.
Scores Comparison
Here is a comparison of the Altman Z-Score and Piotroski Score for Ameren Corporation and FirstEnergy Corp.:
Ameren Corporation Scores
- Altman Z-Score: 0.97, indicating financial distress and high bankruptcy risk.
- Piotroski Score: 6, reflecting average financial strength.
FirstEnergy Corp. Scores
- Altman Z-Score: 0.78, indicating financial distress and high bankruptcy risk.
- Piotroski Score: 6, reflecting average financial strength.
Which company has the best scores?
Both Ameren Corporation and FirstEnergy Corp. show Altman Z-Scores in the distress zone, signaling high bankruptcy risk. Their Piotroski Scores are equal at 6, indicating average financial strength for both companies.
Grades Comparison
The following sections present the recent grades assigned by reputable grading companies for Ameren Corporation and FirstEnergy Corp.:
Ameren Corporation Grades
This table summarizes the recent grades from established grading companies for Ameren Corporation:
| Grading Company | Action | New Grade | Date |
|---|---|---|---|
| UBS | Maintain | Buy | 2025-12-17 |
| Keybanc | Downgrade | Sector Weight | 2025-12-12 |
| Mizuho | Maintain | Outperform | 2025-10-27 |
| Morgan Stanley | Maintain | Equal Weight | 2025-10-22 |
| Barclays | Maintain | Equal Weight | 2025-10-21 |
| Keybanc | Maintain | Overweight | 2025-10-15 |
| Morgan Stanley | Maintain | Equal Weight | 2025-09-25 |
| Keybanc | Maintain | Overweight | 2025-07-16 |
| UBS | Maintain | Buy | 2025-07-11 |
| Barclays | Maintain | Equal Weight | 2025-07-10 |
Grades for Ameren Corporation show a mix of Buy, Overweight, Outperform, and Equal Weight ratings, with a recent slight downgrade by Keybanc but overall stable sentiment.
FirstEnergy Corp. Grades
This table summarizes the recent grades from established grading companies for FirstEnergy Corp.:
| Grading Company | Action | New Grade | Date |
|---|---|---|---|
| UBS | Maintain | Neutral | 2025-12-17 |
| Mizuho | Maintain | Neutral | 2025-10-24 |
| Scotiabank | Maintain | Sector Outperform | 2025-10-24 |
| UBS | Maintain | Neutral | 2025-10-24 |
| Morgan Stanley | Maintain | Overweight | 2025-10-21 |
| Jefferies | Maintain | Hold | 2025-10-21 |
| Keybanc | Downgrade | Sector Weight | 2025-10-15 |
| Scotiabank | Maintain | Sector Outperform | 2025-10-06 |
| Morgan Stanley | Maintain | Overweight | 2025-09-25 |
| Barclays | Upgrade | Overweight | 2025-08-25 |
Grades for FirstEnergy Corp. range from Neutral to Sector Outperform and Overweight, with a recent downgrade from Keybanc but an upgrade from Barclays, indicating a generally moderate to positive outlook.
Which company has the best grades?
Ameren Corporation has received relatively stronger grades, including multiple Buy and Outperform ratings, compared to FirstEnergy Corp.’s Neutral and Sector Outperform consensus. For investors, Ameren’s higher-grade ratings may imply a more favorable analyst outlook, though both companies hold consensus “Hold” ratings, suggesting cautious investor sentiment.
Strengths and Weaknesses
Below is a comparative overview of key strengths and weaknesses for Ameren Corporation (AEE) and FirstEnergy Corp. (FE) based on recent financial and operational data.
| Criterion | Ameren Corporation (AEE) | FirstEnergy Corp. (FE) |
|---|---|---|
| Diversification | Moderate; revenue from Electricity (6.54B) and Natural Gas (1.08B) | Moderate; mainly Regulated Distribution (6.86B) and Transmission (1.79B) |
| Profitability | Net margin strong at 15.51%, but ROIC (3.32%) below WACC (5.19%), indicating value destruction | Lower net margin at 7.26%, ROIC (3.66%) below WACC (4.85%), also value destruction |
| Innovation | Limited data on innovation; declining ROIC trend suggests challenges | Declining ROIC trend and value destruction indicate innovation or operational issues |
| Global presence | Primarily US-focused, no significant global operations | Primarily US-focused, no significant global operations |
| Market Share | Stable in regional markets with steady electricity revenue | Stable in regional markets; recent revenue shows a drop in distribution segment |
Key takeaways: Both AEE and FE are facing declining returns on invested capital below their cost of capital, signaling value destruction and operational challenges. Profitability margins favor Ameren, but liquidity and efficiency ratios suggest caution for both. Investors should carefully monitor these companies’ strategies before investing.
Risk Analysis
Below is a comparative table summarizing key risks for Ameren Corporation (AEE) and FirstEnergy Corp. (FE) based on the most recent data from 2024.
| Metric | Ameren Corporation (AEE) | FirstEnergy Corp. (FE) |
|---|---|---|
| Market Risk | Moderate (Beta 0.59, stable range 87.55-106.73) | Moderate (Beta 0.63, range 37.58-48.20) |
| Debt level | High (Debt-to-Equity 1.55, Interest Coverage 2.92) | Very High (Debt-to-Equity 1.95, Interest Coverage 2.49) |
| Regulatory Risk | Elevated (Utilities sector, rate-regulated operations) | Elevated (Utilities sector, rate-regulated operations) |
| Operational Risk | Moderate (Asset turnover low, operational scale stable) | Moderate (Asset turnover low, larger operational footprint) |
| Environmental Risk | Notable (Coal and nuclear generation, transitioning to renewables) | Notable (Coal, nuclear, and gas with renewable integration challenges) |
| Geopolitical Risk | Low (US domestic-focused operations) | Low (US domestic-focused operations) |
The most impactful risks for both Ameren and FirstEnergy center on high debt levels and regulatory exposure inherent to the utilities sector. Both companies are in financial distress zones per Altman Z-scores, indicating heightened bankruptcy risk. Ameren’s slightly better interest coverage and lower debt-to-equity ratio offer marginally improved financial stability. Environmental risks persist due to reliance on fossil fuels amid tightening regulations and the energy transition. Investors should prioritize risk management around debt and regulatory developments when considering these stocks.
Which Stock to Choose?
Ameren Corporation (AEE) shows a favorable income statement with 15.51% net margin and solid revenue growth of 31.57% over five years. However, financial ratios reveal many unfavorable points, including low liquidity and high debt, while the overall rating is very favorable (B-). The company is currently value-destroying with a declining ROIC below WACC, signaling decreasing profitability.
FirstEnergy Corp. (FE) presents a mixed income profile with a lower net margin of 7.26% and unfavorable long-term net income growth. Its financial ratios also show several weaknesses, notably high debt and low liquidity, though dividend yield is favorable. The rating stands very favorable (B) but the firm is similarly shedding value, with a declining ROIC below WACC.
Investors focused on growth may find Ameren’s stronger income growth and favorable rating more appealing, despite financial and moat concerns. Conversely, those prioritizing dividend yield and a slightly better rating on discounted cash flow might consider FirstEnergy, though both companies display value destruction and risks. The choice could thus depend on the investor’s tolerance for financial and operational challenges.
Disclaimer: Investment carries a risk of loss of initial capital. The past performance is not a reliable indicator of future results. Be sure to understand risks before making an investment decision.
Go Further
I encourage you to read the complete analyses of Ameren Corporation and FirstEnergy Corp. to enhance your investment decisions: