In the evolving utilities sector, choosing the right investment requires careful analysis of key players like Exelon Corporation (EXC) and Ameren Corporation (AEE). Both companies operate in the regulated electric industry, blending traditional and renewable energy sources to serve diverse customer bases. Their overlapping markets and innovation strategies in energy generation and distribution make them compelling candidates for comparison. Join me as we explore which company offers the most promising opportunity for your investment portfolio.
Table of contents
Companies Overview
I will begin the comparison between Exelon Corporation and Ameren Corporation by providing an overview of these two companies and their main differences.
Exelon Overview
Exelon Corporation is a utility services holding company focused on energy generation, delivery, and marketing in the US and Canada. It operates a diverse portfolio of generating facilities, including nuclear, fossil, wind, hydroelectric, biomass, and solar. Exelon also offers electricity and natural gas sales, transmission, and various support services, serving a broad range of customers such as utilities, municipalities, and commercial entities.
Ameren Overview
Ameren Corporation is a public utility holding company operating through four segments in the US, primarily involved in rate-regulated electric generation, transmission, and distribution, along with natural gas distribution and transmission. Its electricity generation relies on coal, nuclear, natural gas, and renewable sources like hydroelectric, wind, methane gas, and solar. Ameren serves residential, commercial, and industrial customers across its service areas.
Key similarities and differences
Both companies operate in the regulated electric utilities sector in the US, generating electricity from conventional and renewable sources. Exelon has a broader geographic footprint including Canada, while Ameren focuses on Missouri and Illinois. Exelon’s business includes marketing and energy-related services beyond generation and distribution, whereas Ameren is structured around distinct regional segments emphasizing transmission and distribution activities.
Income Statement Comparison
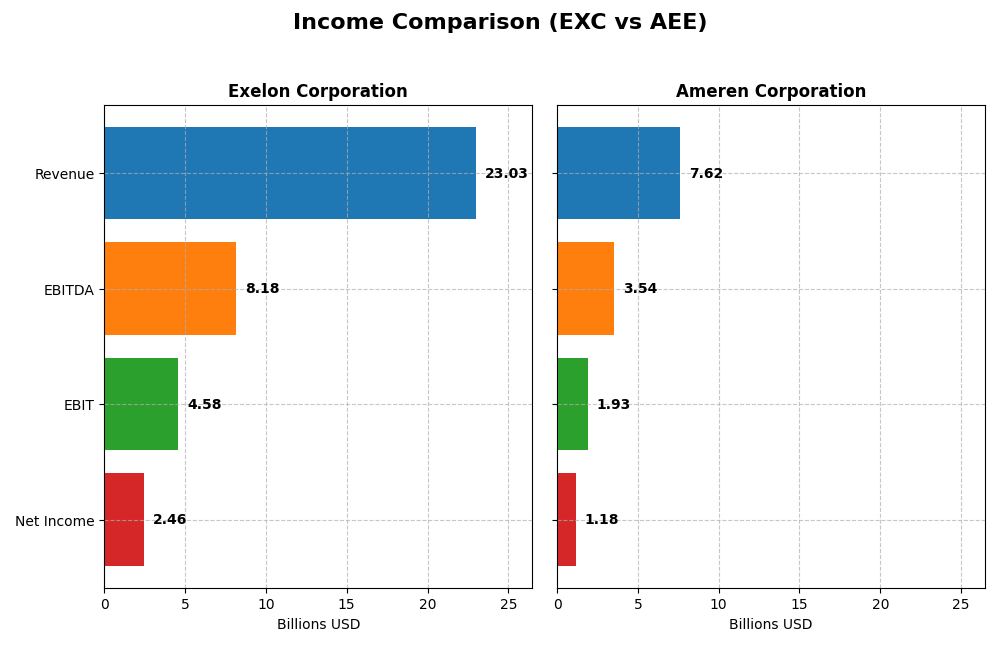
Below is the latest income statement comparison for Exelon Corporation and Ameren Corporation, highlighting key financial metrics for fiscal year 2024.
| Metric | Exelon Corporation | Ameren Corporation |
|---|---|---|
| Market Cap | 43.8B | 27.0B |
| Revenue | 23.0B | 7.62B |
| EBITDA | 8.18B | 3.54B |
| EBIT | 4.58B | 1.93B |
| Net Income | 2.46B | 1.18B |
| EPS | 2.45 | 4.43 |
| Fiscal Year | 2024 | 2024 |
Income Statement Interpretations
Exelon Corporation
Exelon’s revenue grew from $19.1B in 2022 to $23.0B in 2024 but showed an overall decline since 2020’s $33.0B. Net income increased steadily, reaching $2.46B in 2024. Margins improved favorably, with a gross margin of 40.8% and net margin of 10.7%. The latest year showed moderate revenue growth (+6%) but a slight dip in net margin (-0.3%).
Ameren Corporation
Ameren’s revenue expanded from $5.8B in 2020 to $7.6B in 2024, with net income rising to $1.18B. Margins remain robust, highlighted by a gross margin near 48% and net margin above 15%. In 2024, revenue growth slowed (+1.6%) with neutral net margin change (+0.95%), while gross profit growth remained favorable at 5.4%.
Which one has the stronger fundamentals?
Both companies display favorable income statement fundamentals with solid margin profiles and net income growth. Exelon’s higher net income growth and margin improvement contrast with Ameren’s steadier revenue expansion and higher net margin. Exelon shows stronger EPS growth, but Ameren’s margin stability and consistent profitability also stand out, reflecting different but solid financial strengths.
Financial Ratios Comparison
Below is a comparative overview of key financial ratios for Exelon Corporation and Ameren Corporation based on their most recent fiscal year 2024 data.
| Ratios | Exelon Corporation (EXC) | Ameren Corporation (AEE) |
|---|---|---|
| ROE | 9.14% | 9.76% |
| ROIC | 3.93% | 3.32% |
| P/E | 15.35 | 20.12 |
| P/B | 1.40 | 1.96 |
| Current Ratio | 0.87 | 0.66 |
| Quick Ratio | 0.78 | 0.44 |
| D/E | 1.73 | 1.55 |
| Debt-to-Assets | 43.28% | 41.98% |
| Interest Coverage | 2.26 | 2.29 |
| Asset Turnover | 0.21 | 0.17 |
| Fixed Asset Turnover | 0.29 | 0.21 |
| Payout ratio | 61.95% | 60.41% |
| Dividend yield | 4.04% | 3.00% |
Interpretation of the Ratios
Exelon Corporation
Exelon shows a mixed ratio profile with strengths in net margin (10.68%, favorable) and dividend yield (4.04%, favorable) but weaknesses in return on equity (9.14%) and return on invested capital (3.93%). Liquidity ratios like current (0.87) and quick ratio (0.78) are unfavorable, indicating potential short-term financial constraints. The company pays dividends with a solid yield, supported by cautious payout considerations.
Ameren Corporation
Ameren displays favorable net margin (15.51%) and dividend yield (3.0%), but like Exelon, it has unfavorable return on equity (9.76%) and return on invested capital (3.32%). Its liquidity ratios are weaker, with a current ratio of 0.66 and quick ratio of 0.44, signaling tight short-term liquidity. The company also pays dividends, maintaining a moderate yield aligned with stable shareholder returns.
Which one has the best ratios?
Both companies face similar challenges, notably weak liquidity and returns on equity and capital. Exelon has a slightly better dividend yield and price-to-book ratio (1.4 vs. 1.96), while Ameren scores higher on net margin and interest coverage. Overall, each shows a slightly unfavorable ratio profile, with neither distinctly outperforming the other.
Strategic Positioning
This section compares the strategic positioning of Exelon Corporation and Ameren Corporation, focusing on Market position, Key segments, and Exposure to disruption:
Exelon Corporation
- Large market cap of 43.8B, operating in regulated electric utilities with moderate beta of 0.556
- Diverse segments including multiple electric utilities and energy commodities driving revenues
- Exposure to renewable and traditional generation sources, regulated electricity and gas markets
Ameren Corporation
- Smaller market cap of 27.0B, also in regulated electric utilities with beta slightly higher at 0.592
- Concentrated in four main segments: electric distribution, natural gas, transmission, and generation
- Mix of coal, nuclear, natural gas, and renewables; focused on rate-regulated electric and gas distribution
Exelon Corporation vs Ameren Corporation Positioning
Exelon shows a diversified business model across many utility segments and energy commodities, providing broad revenue streams, while Ameren maintains a more concentrated focus on fewer, well-defined regulated segments. Diversification versus concentration presents varied operational scale and complexity.
Which has the best competitive advantage?
Both companies are shedding value with ROIC below WACC. Exelon has a slightly unfavorable moat with growing profitability, whereas Ameren faces a very unfavorable moat and declining profitability, indicating weaker competitive advantage for Ameren.
Stock Comparison
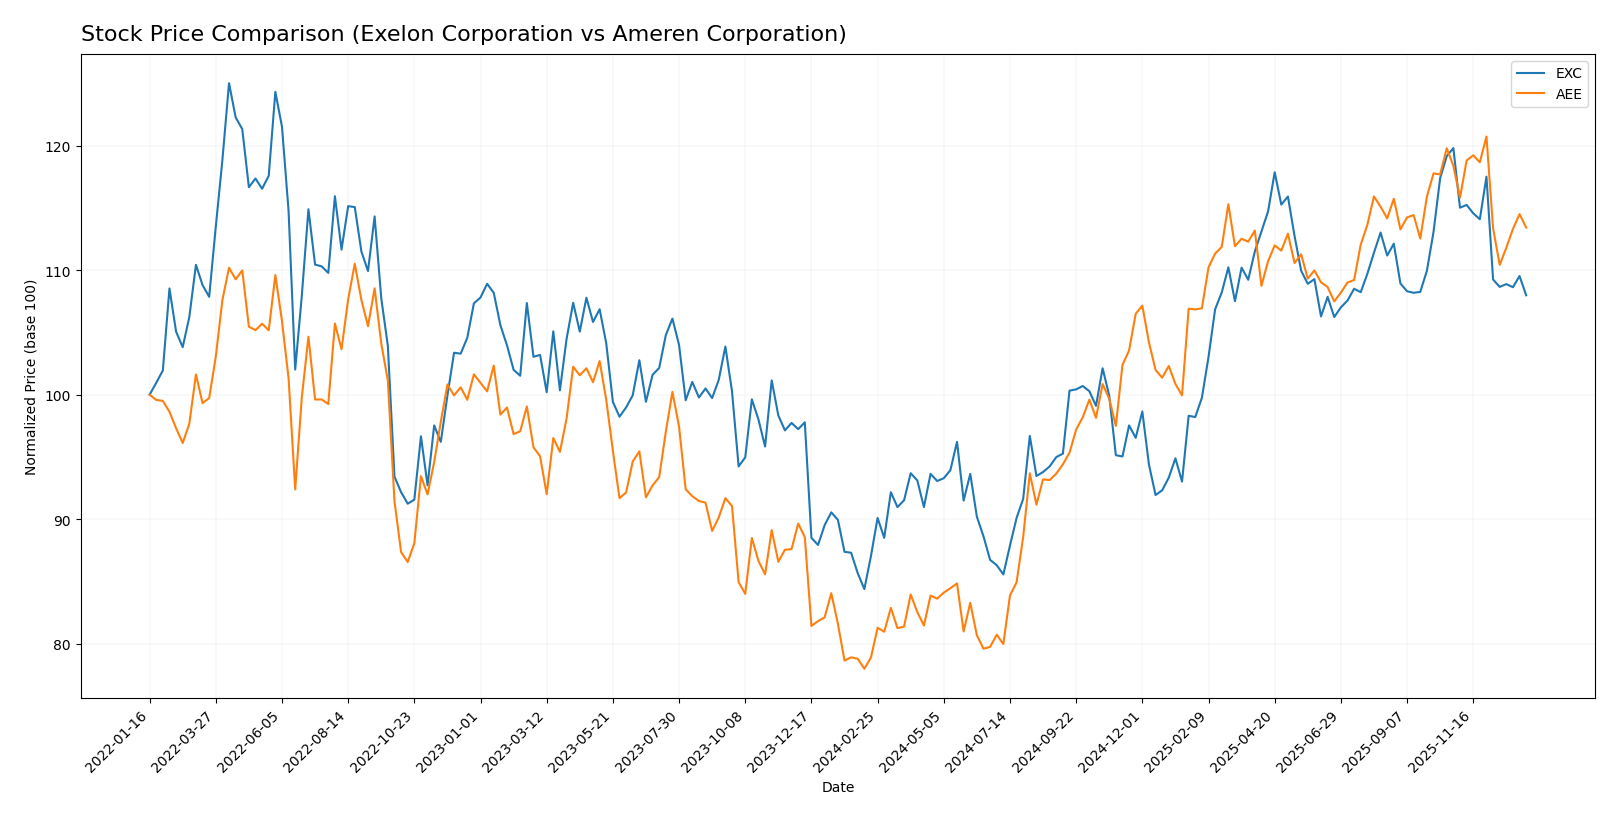
The stock price chart highlights significant bullish gains over the past year for both Exelon Corporation and Ameren Corporation, with notable deceleration in upward momentum and recent downward corrections in trading dynamics.
Trend Analysis
Exelon Corporation’s stock showed a 24.03% price increase over the past 12 months, confirming a bullish trend with decelerating momentum. The price ranged between 34.31 and 48.04, with recent weeks reflecting a -9.87% pullback.
Ameren Corporation’s stock gained 43.73% over the same period, also bullish but with decelerating acceleration and higher volatility (std deviation 11.4). The price fluctuated between 69.51 and 106.35, followed by a recent 4.19% decline.
Comparing both, Ameren Corporation delivered the highest market performance over the last year, outperforming Exelon Corporation despite recent short-term corrections.
Target Prices
Analysts present a clear consensus on target prices for Exelon Corporation and Ameren Corporation, reflecting moderate upside potential.
| Company | Target High | Target Low | Consensus |
|---|---|---|---|
| Exelon Corporation | 57 | 39 | 50.86 |
| Ameren Corporation | 119 | 103 | 111.86 |
The consensus targets suggest that Exelon’s stock price (currently 43.3) could rise moderately toward the 50.86 average, while Ameren’s price (currently 99.91) shows expected growth closer to 111.86, indicating positive analyst sentiment for both utilities.
Analyst Opinions Comparison
This section compares analysts’ ratings and grades for Exelon Corporation and Ameren Corporation:
Rating Comparison
EXC Rating
- Rating: B, considered Very Favorable overall.
- Discounted Cash Flow Score: Moderate at 3, indicating average valuation based on cash flows.
- ROE Score: Moderate at 3, reflecting average efficiency in generating profit from equity.
- ROA Score: Moderate at 3, indicating average asset utilization.
- Debt To Equity Score: Moderate at 2, showing moderate financial risk.
- Overall Score: Moderate at 3, reflecting balanced financial standing.
AEE Rating
- Rating: B-, also considered Very Favorable overall.
- Discounted Cash Flow Score: Very Unfavorable at 1, suggesting potential overvaluation risks.
- ROE Score: Favorable at 4, showing better efficiency compared to EXC.
- ROA Score: Moderate at 3, similar asset utilization to EXC.
- Debt To Equity Score: Moderate at 2, comparable financial risk to EXC.
- Overall Score: Moderate at 2, slightly lower overall financial standing than EXC.
Which one is the best rated?
Based on the provided data, EXC holds a higher overall score and a better discounted cash flow rating, while AEE shows a stronger return on equity. Overall, EXC is slightly better rated due to its more balanced scores.
Scores Comparison
Here is a comparison of Exelon Corporation and Ameren Corporation scores:
EXC Scores
- Altman Z-Score: 0.78, in distress zone indicating high bankruptcy risk.
- Piotroski Score: 5, average financial strength.
AEE Scores
- Altman Z-Score: 0.97, in distress zone indicating high bankruptcy risk.
- Piotroski Score: 6, average financial strength.
Which company has the best scores?
Ameren (AEE) has slightly higher Altman Z-Score and Piotroski Score than Exelon (EXC), but both remain in distress or average zones respectively, indicating neither is clearly stronger based on these metrics.
Grades Comparison
Here is a detailed comparison of the recent grades assigned to Exelon Corporation and Ameren Corporation by leading grading firms:
Exelon Corporation Grades
The table below summarizes Exelon’s latest grades from reputable financial institutions:
| Grading Company | Action | New Grade | Date |
|---|---|---|---|
| UBS | Maintain | Neutral | 2025-12-17 |
| JP Morgan | Maintain | Neutral | 2025-12-12 |
| Morgan Stanley | Maintain | Equal Weight | 2025-10-22 |
| Keybanc | Maintain | Underweight | 2025-10-15 |
| Jefferies | Maintain | Buy | 2025-10-15 |
| Barclays | Maintain | Overweight | 2025-10-14 |
| UBS | Maintain | Neutral | 2025-10-10 |
| Morgan Stanley | Maintain | Equal Weight | 2025-09-25 |
| Keybanc | Maintain | Underweight | 2025-07-16 |
| UBS | Maintain | Neutral | 2025-07-11 |
Exelon’s grades predominantly range from Neutral to Equal Weight, with some divergence including Buy and Underweight ratings, indicating a mixed but generally cautious outlook.
Ameren Corporation Grades
Below is a summary of Ameren’s recent grades from established grading firms:
| Grading Company | Action | New Grade | Date |
|---|---|---|---|
| UBS | Maintain | Buy | 2025-12-17 |
| Keybanc | Downgrade | Sector Weight | 2025-12-12 |
| Mizuho | Maintain | Outperform | 2025-10-27 |
| Morgan Stanley | Maintain | Equal Weight | 2025-10-22 |
| Barclays | Maintain | Equal Weight | 2025-10-21 |
| Keybanc | Maintain | Overweight | 2025-10-15 |
| Morgan Stanley | Maintain | Equal Weight | 2025-09-25 |
| Keybanc | Maintain | Overweight | 2025-07-16 |
| UBS | Maintain | Buy | 2025-07-11 |
| Barclays | Maintain | Equal Weight | 2025-07-10 |
Ameren’s ratings feature a majority of Buy, Overweight, and Equal Weight grades, with only one recent downgrade, reflecting a generally positive sentiment.
Which company has the best grades?
Both Exelon and Ameren carry a consensus rating of “Hold” with slightly different distributions of Buy and Hold grades. Ameren shows a stronger tilt towards Buy and Outperform ratings, which may suggest a more favorable market perception compared to Exelon’s more cautious Neutral and Underweight grades. Investors might interpret Ameren’s grades as indicating relatively higher confidence from analysts, potentially affecting portfolio allocation decisions accordingly.
Strengths and Weaknesses
Below is a comparison table of key strengths and weaknesses for Exelon Corporation (EXC) and Ameren Corporation (AEE) based on their recent financial and operational data.
| Criterion | Exelon Corporation (EXC) | Ameren Corporation (AEE) |
|---|---|---|
| Diversification | Highly diversified with multiple utility segments including electric and gas in several regions, revenue spread across 7 major subsidiaries totaling over 25B USD in 2024 | Less diversified, primarily focused on electricity (6.54B) and natural gas (1.08B) in 2024 |
| Profitability | Moderate profitability: net margin 10.68%, ROIC 3.93% (below WACC), growing ROIC trend but still value destroying | Higher net margin at 15.51%, but ROIC lower at 3.32% with declining trend, also destroying value |
| Innovation | Steady investment in regulated utilities with increasing ROIC indicating improving operational efficiency | Limited innovation indicators, declining ROIC suggests challenges in maintaining competitive edge |
| Global presence | Primarily US-focused with strong presence in multiple utility markets, no significant international exposure | US regional focus, mainly Illinois and surrounding areas, limited geographic spread |
| Market Share | Large market share in key regions such as Commonwealth Edison and Pepco Holdings, revenues exceeding 40B USD combined | Smaller market share focused in Illinois and Missouri, total revenues around 7.6B USD |
Key takeaways: Exelon shows strong diversification and improving profitability trends despite current value destruction, while Ameren has higher margins but faces declining profitability and less diversification, suggesting higher risk for investors seeking stability.
Risk Analysis
Below is a comparison of key risks faced by Exelon Corporation (EXC) and Ameren Corporation (AEE) as of 2024:
| Metric | Exelon Corporation (EXC) | Ameren Corporation (AEE) |
|---|---|---|
| Market Risk | Moderate (Beta 0.56) | Moderate (Beta 0.59) |
| Debt Level | High (D/E 1.73, interest coverage 2.39) | High (D/E 1.55, interest coverage 2.92) |
| Regulatory Risk | Elevated due to energy sector regulations and nuclear operations | Elevated, with exposure to state utility commissions |
| Operational Risk | Moderate, complexity from diverse energy sources including nuclear | Moderate, reliance on coal and nuclear generation |
| Environmental Risk | High, nuclear and fossil fuel exposure with transition pressures | High, coal dependence and renewable integration challenges |
| Geopolitical Risk | Low to moderate, mainly US-centric operations | Low to moderate, US-focused utility |
Exelon and Ameren both face significant debt-related risks with interest coverage ratios near 2-3, signaling moderate ability to service debt. Environmental risk is notable due to reliance on nuclear and fossil fuels amid regulatory and societal shifts toward clean energy. Regulatory risk remains impactful given the heavily regulated utility sectors. Investors should weigh these persistent risks carefully against dividend yields and market stability.
Which Stock to Choose?
Exelon Corporation (EXC) shows a slightly favorable global ratios evaluation despite some unfavorable metrics such as return on equity (9.14%) and asset turnover. Its income statement is favorable with strong net margin growth (10.68%) and consistent profitability. However, the company has a high net debt to EBITDA (5.66) and a moderate debt-to-equity ratio (1.73). EXC’s rating is very favorable with a “B” grade, though its Altman Z-Score indicates financial distress.
Ameren Corporation (AEE) exhibits a slightly unfavorable global ratios evaluation with a higher net margin (15.51%) and return on equity (9.76%) compared to EXC. Its income statement is also favorable, supported by steady net income and EPS growth. AEE carries a similar debt burden (net debt to EBITDA 5.29) and a moderate rating of “B-” with a very unfavorable discounted cash flow score. The Altman Z-Score similarly signals financial distress.
Considering the ratings and financial evaluations, EXC might appear more attractive for investors valuing income statement strength and rating consistency, while AEE may appeal to those focusing on net margin and equity returns despite its less favorable cash flow outlook. Risk-tolerant investors seeking growth could lean towards EXC, whereas risk-averse investors prioritizing stable profitability might find AEE more suitable.
Disclaimer: Investment carries a risk of loss of initial capital. The past performance is not a reliable indicator of future results. Be sure to understand risks before making an investment decision.
Go Further
I encourage you to read the complete analyses of Exelon Corporation and Ameren Corporation to enhance your investment decisions: