Ameren Corporation and Eversource Energy are two leading players in the regulated electric utility sector, serving millions of customers across the United States. Both companies focus on electricity generation, transmission, and natural gas distribution, with a growing emphasis on renewable energy and innovation. This comparison explores their market positions, strategies, and growth potential to help you decide which utility stock deserves a place in your investment portfolio.
Table of contents
Companies Overview
I will begin the comparison between Ameren Corporation and Eversource Energy by providing an overview of these two companies and their main differences.
Ameren Corporation Overview
Ameren Corporation operates as a public utility holding company in the US, focusing on rate-regulated electric generation, transmission, and distribution, alongside natural gas distribution and transmission. Its energy production includes coal, nuclear, natural gas, and renewable sources such as hydroelectric, wind, methane gas, and solar. Ameren serves residential, commercial, and industrial customers mainly in Missouri and Illinois.
Eversource Energy Overview
Eversource Energy is a public utility holding company engaged in energy delivery through electric and natural gas distribution and transmission, as well as water distribution services. It serves a diverse customer base including residential, commercial, industrial, and municipal clients across Connecticut, Massachusetts, and New Hampshire. The company also operates solar power facilities and provides regulated water services to approximately 226K customers.
Key similarities and differences
Both companies operate in the regulated electric utility sector in the US and provide electricity and natural gas services. Ameren has a broader energy mix with coal, nuclear, and renewables, while Eversource emphasizes solar power and regulated water utilities. Ameren’s operations are concentrated in the Midwest, whereas Eversource focuses on the Northeast. Both serve residential and commercial customers but differ in geographic reach and service offerings.
Income Statement Comparison
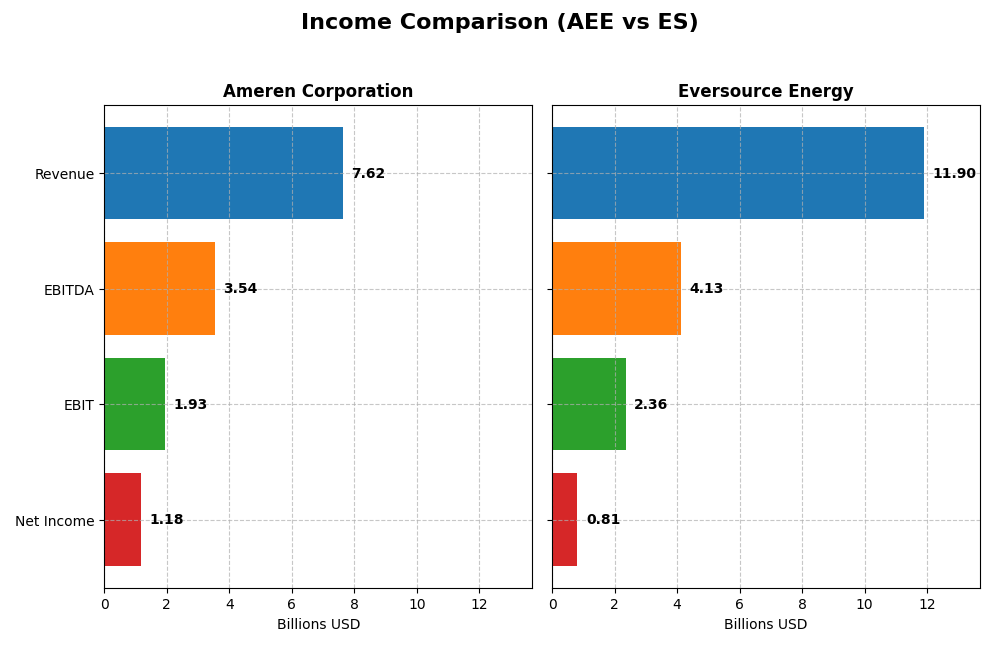
Below is a comparison of key income statement metrics for Ameren Corporation and Eversource Energy for the fiscal year 2024.
| Metric | Ameren Corporation (AEE) | Eversource Energy (ES) |
|---|---|---|
| Market Cap | 27.0B | 25.0B |
| Revenue | 7.62B | 11.9B |
| EBITDA | 3.54B | 4.13B |
| EBIT | 1.93B | 2.36B |
| Net Income | 1.18B | 812M |
| EPS | 4.43 | 2.27 |
| Fiscal Year | 2024 | 2024 |
Income Statement Interpretations
Ameren Corporation
Ameren’s revenue steadily increased from $5.79B in 2020 to $7.62B in 2024, reflecting a 31.57% growth over five years. Net income rose from $871M to $1.18B, marking a 35.71% increase. Margins remained stable with a favorable gross margin of 47.92% and net margin of 15.51% in 2024. The latest year showed modest revenue growth of 1.64%, with improving gross profit and stable net margin.
Eversource Energy
Eversource reported revenues fluctuating around $11.9B-$12.3B from 2020 to 2024, with a slight decline in net income from $1.21B in 2020 to $812M in 2024. Gross margin dropped to 31.12% in 2024, and net margin to 6.82%, despite a strong EBIT margin of 19.79%. The most recent year saw a minor revenue decrease of 0.08%, yet a significant rebound in EBIT and net margin growth compared to the prior year.
Which one has the stronger fundamentals?
Ameren Corporation exhibits consistent revenue and net income growth with stable and healthy margins, indicating solid operational control. Eversource Energy, while showing favorable short-term margin improvements and EBIT growth, struggles with net income decline and margin contraction over the longer term. Both have a favorable income statement assessment, but Ameren’s fundamentals reflect steadier profitability and margin stability.
Financial Ratios Comparison
This table presents the key financial ratios for Ameren Corporation and Eversource Energy for the fiscal year 2024, enabling a straightforward comparison of their financial performance and health.
| Ratios | Ameren Corporation (AEE) | Eversource Energy (ES) |
|---|---|---|
| ROE | 9.76% | 5.40% |
| ROIC | 3.32% | 3.18% |
| P/E | 20.12 | 25.29 |
| P/B | 1.96 | 1.37 |
| Current Ratio | 0.66 | 0.76 |
| Quick Ratio | 0.44 | 0.67 |
| D/E (Debt-to-Equity) | 1.55 | 1.94 |
| Debt-to-Assets | 41.98% | 48.85% |
| Interest Coverage | 2.29 | 2.43 |
| Asset Turnover | 0.17 | 0.20 |
| Fixed Asset Turnover | 0.21 | 0.29 |
| Payout ratio | 60.41% | 124.32% |
| Dividend yield | 3.00% | 4.91% |
Interpretation of the Ratios
Ameren Corporation
Ameren shows mixed ratio strength; its net margin and dividend yield are favorable, but key profitability metrics like ROE and ROIC are unfavorable, raising concerns about capital efficiency. Liquidity ratios are weak, and leverage ratios suggest moderate risk. The company pays dividends with a 3.0% yield, indicating shareholder returns are supported but may require monitoring for sustainability.
Eversource Energy
Eversource’s ratios present more challenges, with unfavorable ROE, ROIC, and P/E ratios reflecting potential profitability and valuation concerns. Liquidity and leverage ratios remain weak, similar to Ameren. However, its dividend yield is stronger at 4.91%, supporting income-focused investors, although the overall ratio profile is considered unfavorable due to higher financial risk.
Which one has the best ratios?
Ameren’s ratio profile is slightly unfavorable with a better balance between profitability and dividend yield, while Eversource is overall unfavorable with more pronounced weaknesses in profitability and higher leverage. Despite similar dividend favorability, Ameren’s stronger net margin and somewhat better capital returns give it a relatively more favorable ratio assessment.
Strategic Positioning
This section compares the strategic positioning of Ameren Corporation and Eversource Energy in terms of market position, key segments, and exposure to technological disruption:
Ameren Corporation
- Operates as a regulated electric utility with moderate competitive pressure in Midwestern US markets.
- Key segments include electric generation, transmission, distribution, and natural gas distribution.
- Generates electricity using coal, nuclear, natural gas, and renewables, balancing legacy and green sources.
Eversource Energy
- Regulated electric utility with presence in Northeast US, facing regional competitive dynamics.
- Diverse segments: electric distribution, transmission, natural gas, and water distribution.
- Active in solar power facilities alongside electricity, natural gas, and water distribution services.
Ameren Corporation vs Eversource Energy Positioning
Ameren has a more concentrated focus on electric and natural gas utilities in the Midwest, while Eversource offers a more diversified portfolio including water services in the Northeast. Ameren’s generation mix includes traditional and renewable sources; Eversource emphasizes solar integration.
Which has the best competitive advantage?
Both Ameren and Eversource show very unfavorable MOAT evaluations with declining ROIC below WACC, indicating they are currently destroying value and facing challenges in sustaining competitive advantages.
Stock Comparison
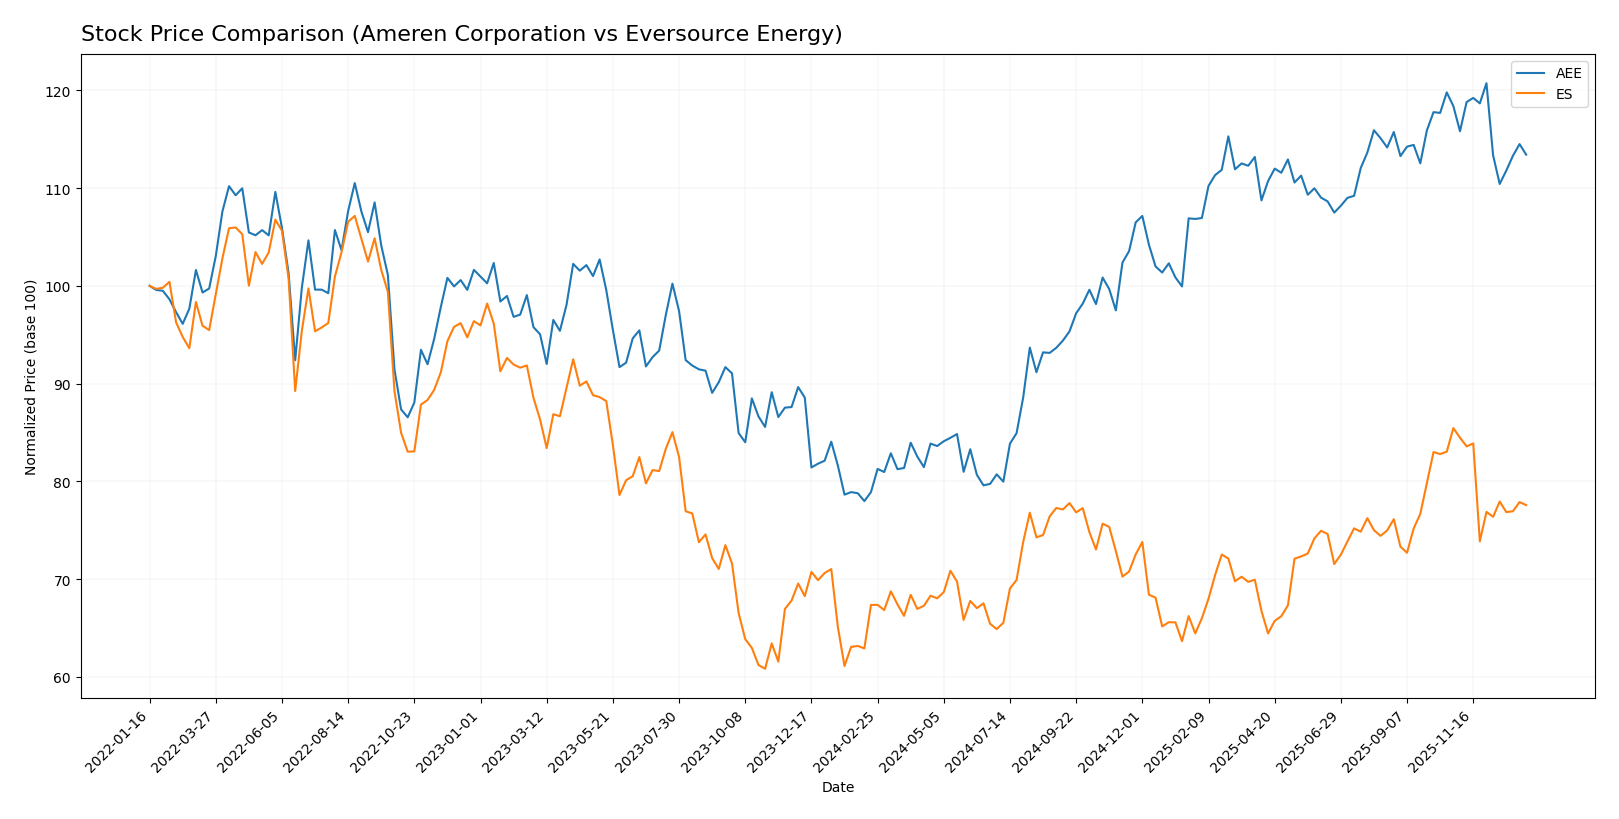
The past year showed significant price appreciation for both Ameren Corporation and Eversource Energy, with Ameren experiencing a stronger bullish trend despite recent deceleration and volume declines.
Trend Analysis
Ameren Corporation (AEE) posted a 43.73% price increase over the last 12 months, marking a bullish trend with deceleration. The stock ranged between 69.51 and 106.35, showing moderate volatility at 11.4 std deviation.
Eversource Energy (ES) recorded a 15.15% gain over the same period, also bullish but with deceleration. Price fluctuated from 55.63 to 74.67 and exhibited lower volatility with a 4.5 std deviation.
Comparing both, Ameren’s stock delivered the highest market performance with a substantially larger price increase and volatility, outperforming Eversource over the past year.
Target Prices
The current analyst consensus presents a positive outlook for both Ameren Corporation and Eversource Energy.
| Company | Target High | Target Low | Consensus |
|---|---|---|---|
| Ameren Corporation | 119 | 103 | 111.86 |
| Eversource Energy | 81 | 60 | 68 |
Analysts expect Ameren’s stock to appreciate above its current price of $99.91, while Eversource’s consensus target of $68 is slightly above its current price of $67.79, indicating moderate upside potential.
Analyst Opinions Comparison
This section compares analysts’ ratings and grades for Ameren Corporation and Eversource Energy:
Rating Comparison
Ameren Corporation Rating
- Rating: B-, considered very favorable overall.
- Discounted Cash Flow Score: 1, very unfavorable valuation.
- ROE Score: 4, favorable efficiency in generating profit.
- ROA Score: 3, moderate asset utilization effectiveness.
- Debt To Equity Score: 2, moderate financial risk.
- Overall Score: 2, moderate financial standing.
Eversource Energy Rating
- Rating: C+, also considered very favorable overall.
- Discounted Cash Flow Score: 1, very unfavorable valuation.
- ROE Score: 3, moderate efficiency in generating profit.
- ROA Score: 3, moderate asset utilization effectiveness.
- Debt To Equity Score: 1, very unfavorable financial risk.
- Overall Score: 2, moderate financial standing.
Which one is the best rated?
Ameren holds a higher ROE score and a better debt-to-equity score, suggesting relatively stronger profitability and financial stability. Both firms share the same overall and discounted cash flow scores, with Ameren slightly better rated overall.
Scores Comparison
Here is a comparison of the Altman Z-Score and Piotroski Score for Ameren Corporation and Eversource Energy:
Ameren Corporation Scores
- Altman Z-Score: 0.97, indicating financial distress.
- Piotroski Score: 6, reflecting average financial health.
Eversource Energy Scores
- Altman Z-Score: 0.75, indicating financial distress.
- Piotroski Score: 6, reflecting average financial health.
Which company has the best scores?
Both Ameren Corporation and Eversource Energy are in the distress zone by Altman Z-Score, and share an average Piotroski Score of 6. Neither company shows a clear advantage based on these scores alone.
Grades Comparison
The grade analysis for Ameren Corporation and Eversource Energy is as follows:
Ameren Corporation Grades
The table below summarizes recent grades and rating actions for Ameren Corporation by recognized grading firms.
| Grading Company | Action | New Grade | Date |
|---|---|---|---|
| UBS | Maintain | Buy | 2025-12-17 |
| Keybanc | Downgrade | Sector Weight | 2025-12-12 |
| Mizuho | Maintain | Outperform | 2025-10-27 |
| Morgan Stanley | Maintain | Equal Weight | 2025-10-22 |
| Barclays | Maintain | Equal Weight | 2025-10-21 |
| Keybanc | Maintain | Overweight | 2025-10-15 |
| Morgan Stanley | Maintain | Equal Weight | 2025-09-25 |
| Keybanc | Maintain | Overweight | 2025-07-16 |
| UBS | Maintain | Buy | 2025-07-11 |
| Barclays | Maintain | Equal Weight | 2025-07-10 |
Overall, Ameren’s ratings mostly trend around Buy to Equal Weight with occasional downgrades to Sector Weight, indicating a stable but cautious outlook.
Eversource Energy Grades
The following table presents recent ratings and actions by reputable grading companies for Eversource Energy.
| Grading Company | Action | New Grade | Date |
|---|---|---|---|
| UBS | Maintain | Neutral | 2025-12-17 |
| JP Morgan | Maintain | Underweight | 2025-12-12 |
| Janney Montgomery Scott | Upgrade | Buy | 2025-11-24 |
| Scotiabank | Maintain | Sector Underperform | 2025-11-20 |
| Mizuho | Downgrade | Neutral | 2025-11-20 |
| Wells Fargo | Downgrade | Equal Weight | 2025-11-20 |
| UBS | Downgrade | Neutral | 2025-11-06 |
| BMO Capital | Maintain | Market Perform | 2025-11-06 |
| Scotiabank | Maintain | Sector Underperform | 2025-11-06 |
| Mizuho | Maintain | Outperform | 2025-10-27 |
Eversource Energy shows a mixed rating profile, with several downgrades and a notable Underweight from JP Morgan, suggesting a more cautious stance.
Which company has the best grades?
Ameren Corporation generally receives higher and more consistent grades, mostly in Buy to Overweight categories, compared to Eversource Energy’s Neutral to Underweight ratings. This may influence investors seeking steadier analyst confidence in Ameren.
Strengths and Weaknesses
The table below compares key strengths and weaknesses of Ameren Corporation (AEE) and Eversource Energy (ES) based on their latest financial and operational data.
| Criterion | Ameren Corporation (AEE) | Eversource Energy (ES) |
|---|---|---|
| Diversification | Moderate: Revenue mainly from Electricity (6.54B) and Natural Gas (1.08B) | High: Diverse segments including Electric Distribution (9.07B), Transmission (2.12B), Natural Gas (2.10B), and Water (0.23B) |
| Profitability | Moderate: Net margin 15.51% (favorable), but ROIC 3.32% below WACC (5.19%), indicating value destruction | Lower: Net margin 6.82% (neutral), ROIC 3.18% below WACC (5.01%), also shedding value |
| Innovation | Limited visible innovation focus; traditional utilities model | Slightly better scope for innovation due to diversified segments and larger scale |
| Global presence | Primarily regional (Midwest US) | Primarily regional (Northeast US), no global operations |
| Market Share | Strong in local electricity and gas markets | Stronger presence in electric and gas distribution with broader service area |
Key takeaways: Both Ameren and Eversource demonstrate strong regional market positions with stable revenues, but both companies are currently experiencing declining return on invested capital below their cost of capital, indicating caution for investors. Eversource’s broader diversification provides a slight edge in risk management.
Risk Analysis
Below is a comparison table summarizing the key risks for Ameren Corporation (AEE) and Eversource Energy (ES) based on their latest 2024 financial and operational data:
| Metric | Ameren Corporation (AEE) | Eversource Energy (ES) |
|---|---|---|
| Market Risk | Moderate (Beta 0.59, stable utility sector) | Moderate (Beta 0.77, slightly higher volatility) |
| Debt Level | High (Debt-to-Equity 1.55, interest coverage 2.92) | Higher (Debt-to-Equity 1.94, interest coverage 2.12) |
| Regulatory Risk | Significant (rate-regulated business model) | Significant (regulated utilities in multiple states) |
| Operational Risk | Moderate (diversified energy sources, some reliance on coal) | Moderate (diverse energy delivery including water services) |
| Environmental Risk | Elevated (coal and nuclear generation impact) | Moderate (focus on solar and natural gas) |
| Geopolitical Risk | Low (US-based operations, regional exposure) | Low (US-based, Northeast focused) |
In synthesis, both companies face notable regulatory and debt-related risks typical for regulated utilities. Ameren’s environmental risk is higher due to coal and nuclear exposure, while Eversource’s elevated debt and lower interest coverage pose financial caution. Their market risk remains moderate owing to their utility sector stability. Investors should weigh these factors carefully with a focus on managing debt and regulatory changes.
Which Stock to Choose?
Ameren Corporation (AEE) shows a generally favorable income evolution with 31.57% revenue growth over 2020-2024 and solid profitability margins, despite a slightly unfavorable debt profile and a slightly unfavorable overall financial ratios evaluation. Its rating is very favorable (B-), though the company is classified in the distress zone for bankruptcy risk.
Eversource Energy (ES) presents mixed income results, with favorable short-term margin growth but an overall decline in net income and EPS over the period. Financial ratios are mostly unfavorable, especially regarding debt, and its rating is very favorable (C+), though it also falls in the distress zone according to bankruptcy scores.
Considering ratings and global financial evaluations, AEE might appear more suitable for investors prioritizing income stability and profitability, while ES could be interpreted as appealing to those accepting higher operational fluctuations but seeking dividend yield. Both companies face challenges in value creation as indicated by their declining ROIC versus WACC.
Disclaimer: Investment carries a risk of loss of initial capital. The past performance is not a reliable indicator of future results. Be sure to understand risks before making an investment decision.
Go Further
I encourage you to read the complete analyses of Ameren Corporation and Eversource Energy to enhance your investment decisions: