Ameren Corporation (AEE) and Evergy, Inc. (EVRG) are two prominent players in the regulated electric utility sector, both operating primarily in the U.S. Midwest. They share significant market overlap and pursue innovation through diversified energy sources, including renewables. Comparing these companies offers valuable insights into stability and growth potential in a transforming industry. This article will guide you in deciding which stock fits best in your investment portfolio today.
Table of contents
Companies Overview
I will begin the comparison between Ameren Corporation and Evergy, Inc. by providing an overview of these two companies and their main differences.
Ameren Corporation Overview
Ameren Corporation is a public utility holding company operating primarily in regulated electric and natural gas sectors in the US. It engages in electric generation, transmission, and distribution through its segments Ameren Missouri, Ameren Illinois Electric Distribution, Ameren Illinois Natural Gas, and Ameren Transmission. Ameren serves residential, commercial, and industrial customers, generating electricity from coal, nuclear, natural gas, and renewable sources like hydroelectric and wind.
Evergy, Inc. Overview
Evergy, Inc. operates in electricity generation, transmission, distribution, and sales in Kansas and Missouri. It produces power from coal, hydroelectric, landfill gas, uranium, natural gas, oil, and various renewable sources, including solar and wind. Evergy serves about 1.62M customers with extensive transmission and distribution infrastructure. Incorporated in 2017, it focuses on regulated electric utility services within its regional footprint.
Key similarities and differences
Both Ameren and Evergy operate as regulated electric utilities serving residential and commercial customers, generating electricity from a mix of fossil fuels and renewable sources. Ameren also includes natural gas distribution, while Evergy focuses more on electric transmission and distribution infrastructure. Ameren is larger by market cap and employee count and has a longer corporate history compared to the younger, more regionally concentrated Evergy.
Income Statement Comparison
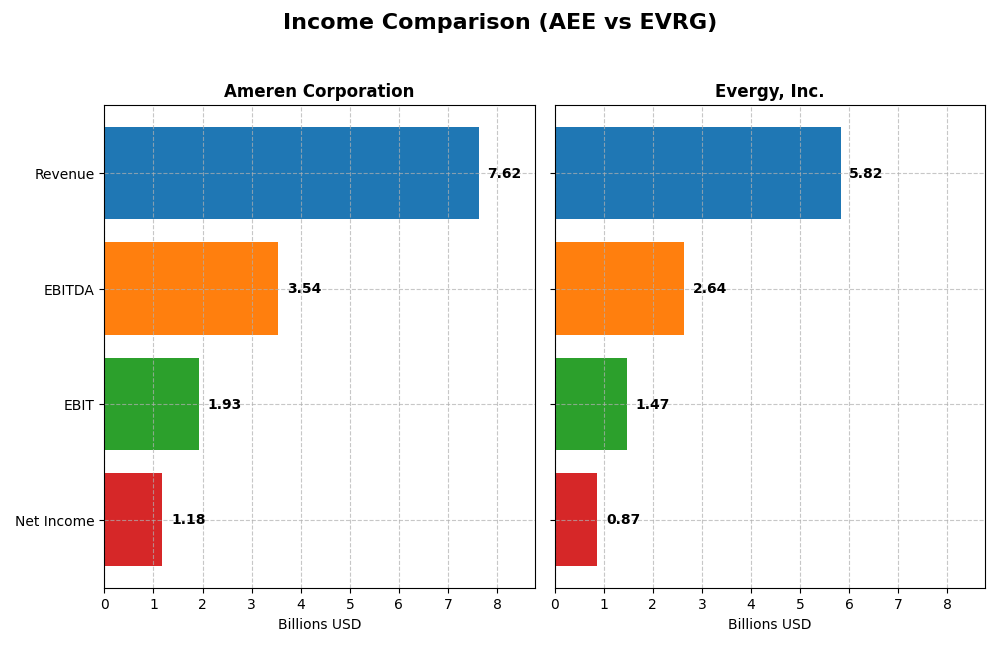
The table below compares key income statement metrics for Ameren Corporation and Evergy, Inc. for the fiscal year 2024.
| Metric | Ameren Corporation | Evergy, Inc. |
|---|---|---|
| Market Cap | 27.0B | 16.8B |
| Revenue | 7.62B | 5.82B |
| EBITDA | 3.54B | 2.64B |
| EBIT | 1.93B | 1.47B |
| Net Income | 1.18B | 874M |
| EPS | 4.43 | 3.79 |
| Fiscal Year | 2024 | 2024 |
Income Statement Interpretations
Ameren Corporation
Ameren Corporation’s revenue rose steadily from $5.79B in 2020 to $7.62B in 2024, reflecting a 31.57% increase over five years. Net income similarly grew by 35.71%, reaching $1.18B in 2024. Margins remained strong and stable, with a gross margin near 48% and net margin around 15.5%. The latest year showed slower revenue growth at 1.64%, though gross profit improved by 5.36%.
Evergy, Inc.
Evergy, Inc. experienced revenue growth from $4.91B in 2020 to $5.82B in 2024, an 18.53% rise. Net income expanded by 41.27% to $873.5M in 2024. Margins held firm with a gross margin of 32.6% and net margin at 15%. The most recent year’s revenue increased 6.17%, while net margin and earnings per share grew favorably by 12.5% and 19.56%, respectively, indicating solid operational improvements.
Which one has the stronger fundamentals?
Both companies display favorable income statement fundamentals with sustained revenue and net income growth, and healthy margins. Ameren boasts higher absolute revenue and net income, with stable margins but slower recent revenue growth. Evergy shows stronger recent growth rates in net margin and EPS, coupled with a higher proportion of favorable evaluations. Overall, Evergy’s growth momentum contrasts with Ameren’s scale and margin stability.
Financial Ratios Comparison
The table below presents a side-by-side comparison of key financial ratios for Ameren Corporation (AEE) and Evergy, Inc. (EVRG) based on their latest fiscal year data ending in 2024.
| Ratios | Ameren Corporation (AEE) | Evergy, Inc. (EVRG) |
|---|---|---|
| ROE | 9.76% | 8.77% |
| ROIC | 3.32% | 4.52% |
| P/E | 20.1 | 16.2 |
| P/B | 1.96 | 1.42 |
| Current Ratio | 0.66 | 0.50 |
| Quick Ratio | 0.44 | 0.27 |
| D/E (Debt-to-Equity) | 1.55 | 1.41 |
| Debt-to-Assets | 41.98% | 43.58% |
| Interest Coverage | 2.29 | 2.57 |
| Asset Turnover | 0.17 | 0.18 |
| Fixed Asset Turnover | 0.21 | 0.23 |
| Payout Ratio | 60.4% | 68.3% |
| Dividend Yield | 3.00% | 4.21% |
Interpretation of the Ratios
Ameren Corporation
Ameren shows a mix of strengths and weaknesses in its ratios. Net margin and dividend yield are favorable, indicating profitability and shareholder returns. However, return on equity, return on invested capital, low current and quick ratios, and asset turnover ratios are unfavorable, pointing to efficiency and liquidity concerns. The company pays dividends with a stable yield near 3%, supported by cash flow but with potential risk from elevated debt.
Evergy, Inc.
Evergy displays similar challenges, with favorable net margin, dividend yield of 4.21%, and price-to-book ratio, but unfavorable returns on equity and invested capital, weak liquidity ratios, and low asset turnover. Like Ameren, it pays dividends with a reasonable yield, balancing shareholder returns and financial constraints. Neutral ratings on interest coverage and debt-to-assets reflect moderate financial risk.
Which one has the best ratios?
Both Ameren and Evergy face liquidity and efficiency challenges, with half of their ratios flagged as unfavorable. Evergy has a slightly higher proportion of favorable ratios, driven by better dividend yield and price-to-book ratio. However, both companies share a “slightly unfavorable” global ratios opinion, suggesting neither decisively outperforms the other in financial health or risk profile.
Strategic Positioning
This section compares the strategic positioning of Ameren Corporation and Evergy, Inc., focusing on market position, key segments, and exposure to technological disruption:
Ameren Corporation
- Larger market cap at 27B, operating in regulated electric utilities with moderate competition.
- Key segments include electricity generation (6.54B) and natural gas (1.08B), with diversified generation sources.
- Generates electricity using coal, nuclear, natural gas, and renewables; exposed to gradual energy transition risks.
Evergy, Inc.
- Smaller market cap at 16.8B, also in regulated electric utilities facing similar competitive pressure.
- Primarily electric utility segment (~2.7B), serving 1.62M customers across Kansas and Missouri.
- Uses coal, hydroelectric, landfill gas, uranium, natural gas, and renewables, facing similar disruption exposure.
Ameren Corporation vs Evergy, Inc. Positioning
Ameren has a more diversified revenue base across electricity and natural gas segments, with a broader generation mix. Evergy concentrates mainly on electricity with significant customer reach but less segment diversification. Both operate in regulated markets with comparable disruption risks.
Which has the best competitive advantage?
Neither company currently creates economic value as both have ROIC below WACC. Evergy shows improving profitability trends, while Ameren’s profitability declines, indicating Evergy has a slightly stronger competitive position despite value erosion.
Stock Comparison
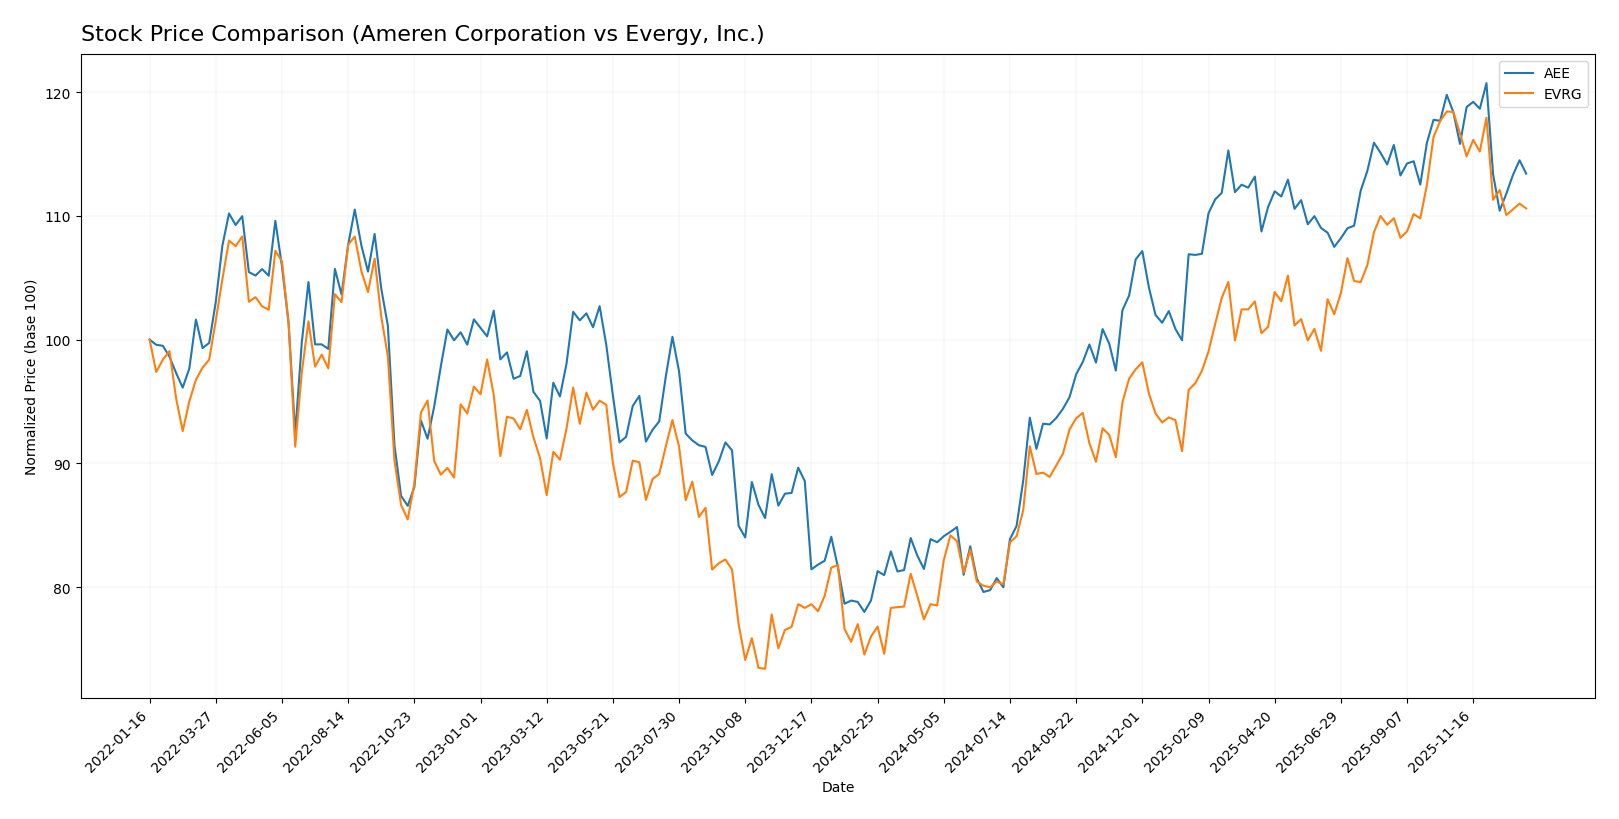
The stock price charts of Ameren Corporation (AEE) and Evergy, Inc. (EVRG) over the past 12 months reveal strong bullish trends with notable price appreciations followed by recent deceleration and slight declines in early 2026.
Trend Analysis
Ameren Corporation (AEE) showed a bullish trend over the past year with a 43.73% price increase, though the trend is decelerating. The stock hit a high of 106.35 and a low of 69.51, with volatility measured by an 11.4 standard deviation. Recently, it declined by 4.19%.
Evergy, Inc. (EVRG) also exhibited a bullish trend with a 45.55% rise over the last 12 months, but similarly experienced deceleration. Its price ranged between 49.12 and 77.98, showing lower volatility at 7.94 standard deviation. The recent trend shows a 6.59% decrease.
Comparing both, Evergy (EVRG) delivered a slightly higher market performance over the year, although both stocks experienced recent downward adjustments and slowing momentum.
Target Prices
The current analyst consensus for target prices indicates moderate upside potential for both Ameren Corporation and Evergy, Inc.
| Company | Target High | Target Low | Consensus |
|---|---|---|---|
| Ameren Corporation | 119 | 103 | 111.86 |
| Evergy, Inc. | 93 | 76 | 82.67 |
Analysts expect Ameren’s stock to rise from its current price of $99.91 toward the consensus target near $111.86, while Evergy’s stock at $72.82 shows potential appreciation aligned with a consensus target of $82.67.
Analyst Opinions Comparison
This section compares analysts’ ratings and grades for Ameren Corporation and Evergy, Inc.:
Rating Comparison
Ameren Corporation Rating
- Rating: B-, considered very favorable by analysts.
- Discounted Cash Flow Score: 1, indicating a very unfavorable valuation.
- ROE Score: 4, reflecting a favorable ability to generate profit from equity.
- ROA Score: 3, moderate effectiveness in asset utilization.
- Debt To Equity Score: 2, moderate financial risk.
- Overall Score: 2, indicating a moderate overall financial standing.
Evergy, Inc. Rating
- Rating: B-, also considered very favorable by analysts.
- Discounted Cash Flow Score: 1, indicating a very unfavorable valuation.
- ROE Score: 3, showing a moderate efficiency in generating profit from equity.
- ROA Score: 3, moderate effectiveness in asset utilization.
- Debt To Equity Score: 2, moderate financial risk.
- Overall Score: 2, indicating a moderate overall financial standing.
Which one is the best rated?
Both Ameren and Evergy share the same overall rating of B- and equal overall scores. Ameren has a higher ROE score, indicating better profitability from equity, while Evergy matches or slightly surpasses on other metrics.
Scores Comparison
Here is a comparison of the Altman Z-Score and Piotroski Score for Ameren Corporation and Evergy, Inc.:
Ameren Corporation Scores
- Altman Z-Score: 0.97, indicating financial distress.
- Piotroski Score: 6, reflecting average financial health.
Evergy, Inc. Scores
- Altman Z-Score: 0.82, also indicating distress.
- Piotroski Score: 5, also reflecting average health.
Which company has the best scores?
Both Ameren and Evergy are in the distress zone for Altman Z-Score, but Ameren’s score is slightly higher. Ameren also has a marginally better Piotroski Score, indicating somewhat stronger financial health than Evergy based on these metrics.
Grades Comparison
Here is a detailed comparison of the recent grades assigned to Ameren Corporation and Evergy, Inc.:
Ameren Corporation Grades
The following table summarizes recent grades from major grading companies for Ameren Corporation:
| Grading Company | Action | New Grade | Date |
|---|---|---|---|
| UBS | Maintain | Buy | 2025-12-17 |
| Keybanc | Downgrade | Sector Weight | 2025-12-12 |
| Mizuho | Maintain | Outperform | 2025-10-27 |
| Morgan Stanley | Maintain | Equal Weight | 2025-10-22 |
| Barclays | Maintain | Equal Weight | 2025-10-21 |
| Keybanc | Maintain | Overweight | 2025-10-15 |
| Morgan Stanley | Maintain | Equal Weight | 2025-09-25 |
| Keybanc | Maintain | Overweight | 2025-07-16 |
| UBS | Maintain | Buy | 2025-07-11 |
| Barclays | Maintain | Equal Weight | 2025-07-10 |
Overall, Ameren Corporation’s grades show a mix of “Buy,” “Overweight,” and “Equal Weight,” indicating a stable but cautious outlook from analysts.
Evergy, Inc. Grades
The following table presents recent grades from notable grading companies for Evergy, Inc.:
| Grading Company | Action | New Grade | Date |
|---|---|---|---|
| Mizuho | Downgrade | Neutral | 2025-12-18 |
| UBS | Maintain | Buy | 2025-12-17 |
| Citigroup | Maintain | Buy | 2025-11-10 |
| Jefferies | Maintain | Buy | 2025-10-09 |
| Mizuho | Maintain | Outperform | 2025-08-08 |
| Mizuho | Maintain | Outperform | 2025-07-18 |
| Barclays | Maintain | Overweight | 2025-05-30 |
| Citigroup | Maintain | Buy | 2025-05-16 |
| UBS | Upgrade | Buy | 2025-04-28 |
| Barclays | Maintain | Overweight | 2025-04-22 |
Evergy, Inc. shows strong analyst support with mostly “Buy” and “Outperform” ratings, though a recent downgrade to “Neutral” by Mizuho indicates some caution.
Which company has the best grades?
Evergy, Inc. has received generally more favorable grades, with more consistent “Buy” and “Outperform” ratings compared to Ameren Corporation’s mixed “Hold” and “Equal Weight” grades. This difference may influence investors seeking stronger analyst conviction.
Strengths and Weaknesses
Below is a comparative summary of the key strengths and weaknesses of Ameren Corporation (AEE) and Evergy, Inc. (EVRG) based on their latest financial and operational data.
| Criterion | Ameren Corporation (AEE) | Evergy, Inc. (EVRG) |
|---|---|---|
| Diversification | Moderate: Revenue split between Electricity $6.54B and Natural Gas $1.08B | Low: Primarily Electric Utility segment $2.71B |
| Profitability | Mixed: Net margin at 15.51% favorable, but ROIC 3.32% below WACC, value destroying | Mixed: Net margin 15.0% favorable, ROIC 4.52% below WACC but improving |
| Innovation | Limited data; ROIC declining indicates challenges in value creation | Improving ROIC trend (+19%) suggests gradual efficiency gains |
| Global presence | Regional focus in U.S. Midwest, limited global footprint | Similar regional focus, no significant global presence |
| Market Share | Strong in local markets with steady electricity revenue growth | Stable market share in regional electric utility sector |
Key takeaways: Both companies operate primarily in regional electric utilities with limited diversification. Ameren shows stronger revenue diversification but struggles with declining profitability and value destruction. Evergy, though less diversified, demonstrates improving profitability trends, indicating potential operational enhancements. Investors should weigh these factors alongside risk tolerance and market outlook.
Risk Analysis
Below is a comparative overview of key risk factors for Ameren Corporation (AEE) and Evergy, Inc. (EVRG) based on the most recent data available for 2024.
| Metric | Ameren Corporation (AEE) | Evergy, Inc. (EVRG) |
|---|---|---|
| Market Risk | Beta 0.59, moderate volatility, stable regulated utility sector | Beta 0.65, slightly higher volatility, regulated market exposure |
| Debt level | Debt-to-Equity 1.55 (unfavorable), Debt-to-Assets 42% (neutral) | Debt-to-Equity 1.41 (unfavorable), Debt-to-Assets 44% (neutral) |
| Regulatory Risk | High, due to extensive rate-regulated electric and gas operations | High, operating in regulated Kansas and Missouri markets |
| Operational Risk | Moderate, exposure to coal, nuclear, natural gas, and renewables | Moderate, diverse generation mix including coal, hydro, nuclear, and renewables |
| Environmental Risk | Significant, reliance on fossil fuels with ongoing transition to renewables | Significant, similar fossil fuel exposure with renewable integration efforts |
| Geopolitical Risk | Low, primarily US-based operations with limited international exposure | Low, US-focused with stable regional market presence |
The most likely and impactful risks for both Ameren and Evergy stem from regulatory changes and environmental pressures. Both companies face challenges transitioning from fossil fuels to renewables amid tightening emissions regulations. Their unfavorable debt levels and Altman Z-Scores in the distress zone underscore financial vulnerability, necessitating cautious risk management for investors.
Which Stock to Choose?
Ameren Corporation (AEE) shows favorable income statement metrics with strong gross and EBIT margins, but revenue growth is modest. Financial ratios reveal mixed signals: some favorable margins offset by weak liquidity and leverage ratios. The company has a very favorable overall rating but a very unfavorable moat due to declining ROIC below WACC.
Evergy, Inc. (EVRG) demonstrates solid income growth and profitability with higher revenue and net income increases over five years. Its financial ratios are slightly more favorable, particularly in valuation and dividend yield, though liquidity and debt remain concerns. EVRG also holds a very favorable rating but a slightly unfavorable moat, reflecting improving profitability despite value destruction.
For investors prioritizing growth and improving profitability, EVRG’s stronger income growth and rising ROIC might appear more attractive. Conversely, those valuing established profitability and stable ratings may find AEE’s consistent margins and dividend yield worth consideration. Both companies present some financial challenges, suggesting cautious analysis aligned with individual risk tolerance.
Disclaimer: Investment carries a risk of loss of initial capital. The past performance is not a reliable indicator of future results. Be sure to understand risks before making an investment decision.
Go Further
I encourage you to read the complete analyses of Ameren Corporation and Evergy, Inc. to enhance your investment decisions: