Investors seeking stable opportunities in the regulated electric utility sector will find Ameren Corporation and Edison International compelling contenders. Both companies serve vast customer bases in the U.S., focusing on electric generation, transmission, and distribution while advancing renewable energy initiatives. Their overlapping markets and innovation strategies highlight key differences in growth potential and risk. In this article, I will help you determine which company offers the most attractive investment proposition for your portfolio.
Table of contents
Companies Overview
I will begin the comparison between Ameren Corporation and Edison International by providing an overview of these two companies and their main differences.
Ameren Corporation Overview
Ameren Corporation operates as a public utility holding company in the US, focusing on rate-regulated electric generation, transmission, and distribution, as well as natural gas distribution and transmission. It serves residential, commercial, and industrial customers primarily through coal, nuclear, natural gas, and renewable sources. Founded in 1881, Ameren is headquartered in St. Louis, Missouri, and has a market cap of 27B USD.
Edison International Overview
Edison International generates and distributes electric power in Southern, Central, and Coastal California, serving 15M customers across residential, commercial, industrial, and public sectors. It operates extensive transmission and distribution infrastructure and provides energy solutions primarily in California. Founded in 1886 and headquartered in Rosemead, California, Edison International has a market cap of 23.5B USD.
Key similarities and differences
Both companies operate in the regulated electric utility sector and serve diverse customer bases including residential and commercial users. Ameren has a broader geographic focus across multiple states with diversified generation sources, while Edison International is concentrated in California with a strong emphasis on extensive transmission and distribution networks. Ameren’s market cap is slightly larger, but Edison employs more staff, reflecting different operational scales and regional focuses.
Income Statement Comparison
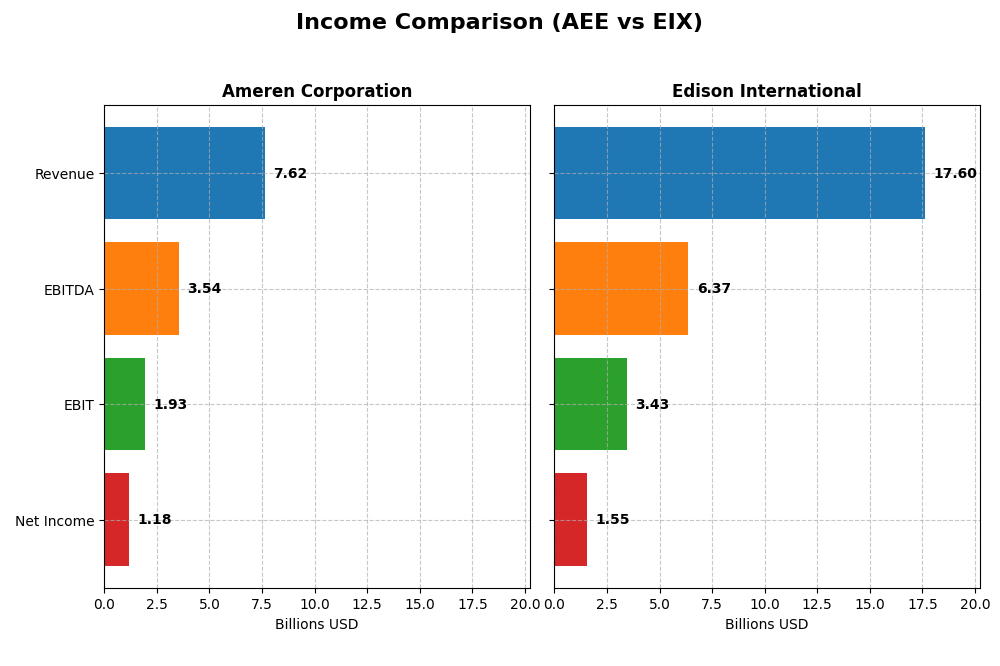
This table presents a side-by-side comparison of key income statement metrics for Ameren Corporation and Edison International for the fiscal year 2024.
| Metric | Ameren Corporation | Edison International |
|---|---|---|
| Market Cap | 27.0B | 23.5B |
| Revenue | 7.62B | 17.60B |
| EBITDA | 3.54B | 6.37B |
| EBIT | 1.93B | 3.43B |
| Net Income | 1.18B | 1.55B |
| EPS | 4.43 | 3.33 |
| Fiscal Year | 2024 | 2024 |
Income Statement Interpretations
Ameren Corporation
Ameren Corporation’s revenue grew steadily by 31.57% from 2020 to 2024, with net income increasing 35.71% over the same period. Gross and EBIT margins remained favorable, close to 48% and 25%, respectively, while net margin was stable at 15.51%. In 2024, revenue growth slowed to 1.64%, but gross profit improved, reflecting moderate margin resilience.
Edison International
Edison International experienced a 29.61% revenue increase and a substantial 77.5% net income rise from 2020 to 2024. Its gross margin improved to 41.01%, with EBIT and net margins at 19.5% and 8.78%, respectively. The latest fiscal year showed 7.72% revenue growth and strong EBIT and EPS improvements, signaling enhanced operational efficiency and profitability.
Which one has the stronger fundamentals?
Both companies display favorable income statement trends, but Edison International shows more robust growth rates in net income (77.5%) and EPS (67.17%) over the period. Ameren has higher margins overall, particularly net margin at 15.51% versus Edison’s 8.78%. Edison’s higher interest expense ratio is a downside, while Ameren’s margin stability contrasts with its slower recent revenue growth.
Financial Ratios Comparison
The table below presents a side-by-side comparison of key financial ratios for Ameren Corporation (AEE) and Edison International (EIX) based on their most recent fiscal year data ending 2024.
| Ratios | Ameren Corporation (AEE) | Edison International (EIX) |
|---|---|---|
| ROE | 9.76% | 9.93% |
| ROIC | 3.32% | 3.61% |
| P/E | 20.12 | 19.93 |
| P/B | 1.96 | 1.98 |
| Current Ratio | 0.66 | 0.85 |
| Quick Ratio | 0.44 | 0.78 |
| D/E (Debt to Equity) | 1.55 | 2.43 |
| Debt-to-Assets | 42.0% | 44.1% |
| Interest Coverage | 2.29 | 1.57 |
| Asset Turnover | 0.17 | 0.21 |
| Fixed Asset Turnover | 0.21 | 0.29 |
| Payout Ratio | 60.4% | 83.2% |
| Dividend Yield | 3.00% | 4.17% |
Interpretation of the Ratios
Ameren Corporation
Ameren shows a mixed ratio profile with favorable net margin (15.51%) and dividend yield (3.0%), but weaknesses in return on equity (9.76%), return on invested capital (3.32%), and liquidity ratios below 1. The debt-to-equity ratio of 1.55 is also a concern. Dividend payments appear sustainable given the moderate payout, though free cash flow coverage is negative, signaling caution.
Edison International
Edison International’s ratios generally reflect some challenges, with neutral net margin (8.78%) but unfavorable returns on equity (9.93%) and invested capital (3.61%). Liquidity ratios are below 1, and debt-to-equity is high at 2.43. Its dividend yield is higher at 4.17%, but interest coverage is weak, indicating possible financial strain in servicing debt despite dividend distributions.
Which one has the best ratios?
Ameren Corporation presents a slightly unfavorable overall ratio mix, with a better net margin and lower leverage than Edison International, which faces more unfavorable ratios especially in debt management and interest coverage. Both companies have dividend yields supportive to shareholders, but Ameren’s balance of favorable and neutral metrics offers a more stable profile comparatively.
Strategic Positioning
This section compares the strategic positioning of Ameren Corporation and Edison International, including market position, key segments, and exposure to technological disruption:
Ameren Corporation
- Market position and competitive pressure
- Key segments and business drivers
- Exposure to technological disruption
Edison International
- Market cap of 27B, operates in regulated electric utilities, moderate competitive pressure.
- Focuses on electricity (6.54B) and natural gas (1.08B) revenue streams.
- Generates power from coal, nuclear, natural gas, and renewables, balancing traditional and green sources.
Ameren Corporation vs Edison International Positioning
Ameren is diversified across electricity and natural gas with multiple regional segments, offering stable regulated returns. Edison is more concentrated in electric utility services within California, emphasizing transmission and competitive generation. Each strategy reflects different regional and segment focus with inherent market and operational risks.
Which has the best competitive advantage?
Both companies are shedding value relative to their cost of capital. Ameren shows declining profitability (Very Unfavorable moat), while Edison demonstrates improving profitability despite value destruction (Slightly Unfavorable moat), indicating Edison’s competitive advantage may be more resilient.
Stock Comparison
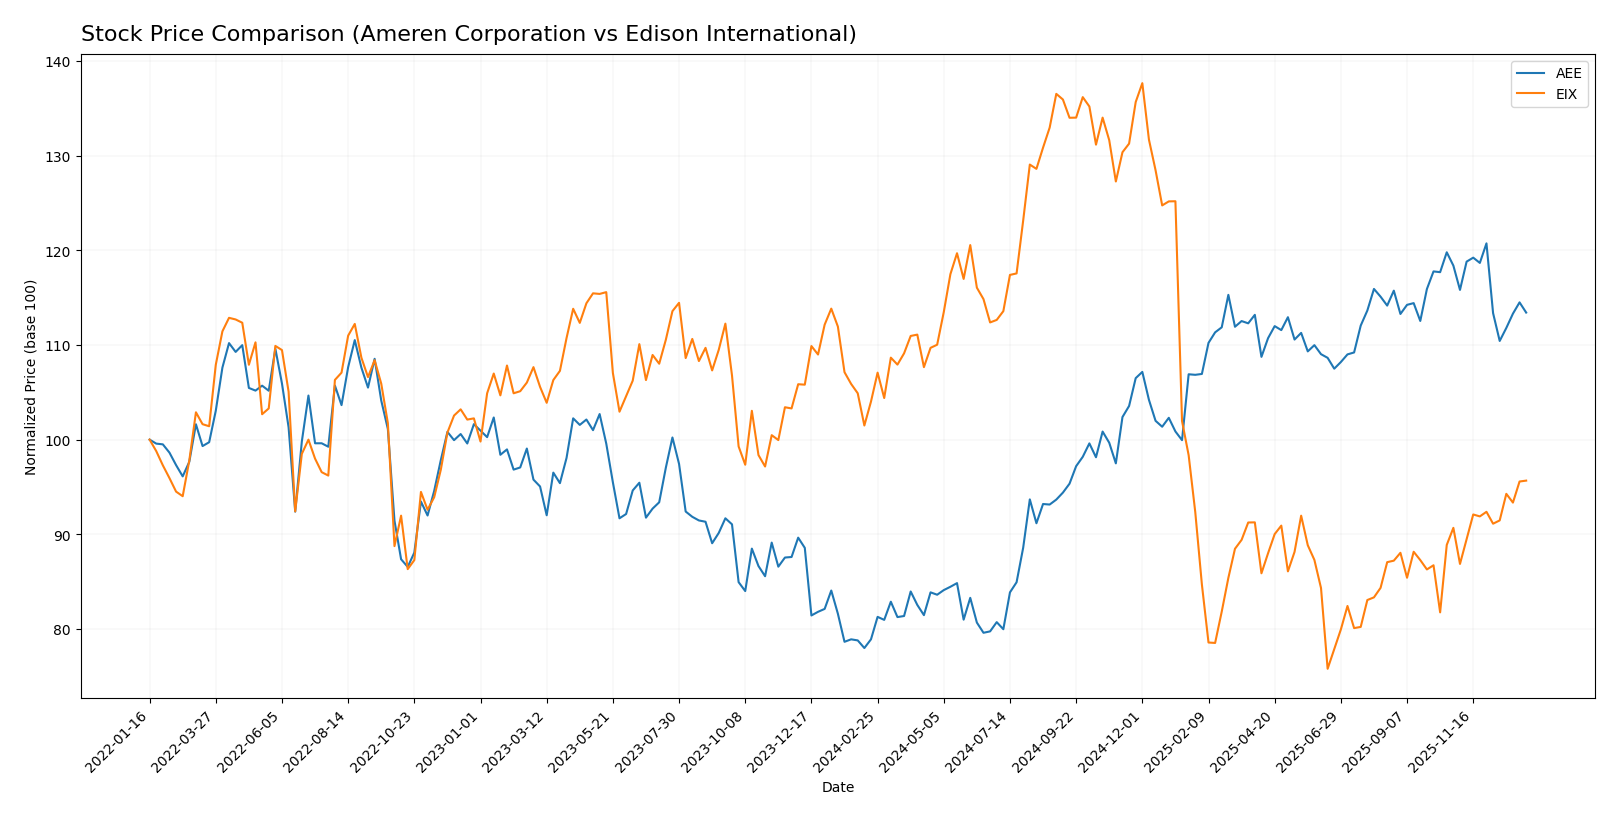
The past year saw Ameren Corporation’s stock rise sharply by 43.73%, though its recent quarter shows a slight decline, while Edison International experienced an overall 8.02% drop with a recent uptick indicating shifting momentum.
Trend Analysis
Ameren Corporation (AEE) displayed a bullish trend over the past 12 months with a 43.73% price increase, accompanied by decelerating momentum and a high volatility level (std deviation 11.4). The stock peaked at 106.35 and bottomed at 69.51.
Edison International (EIX) had a bearish trend over the same period, falling 8.02% with accelerating downward momentum and higher volatility (std deviation 12.11). The stock’s recent 5.5% gain suggests a potential trend reversal.
Comparing both, Ameren Corporation delivered the strongest market performance with a substantial 43.73% gain versus Edison International’s 8.02% loss over the past year.
Target Prices
The consensus target prices for Ameren Corporation and Edison International indicate moderate upside potential from current levels.
| Company | Target High | Target Low | Consensus |
|---|---|---|---|
| Ameren Corporation | 119 | 103 | 111.86 |
| Edison International | 70 | 56 | 62 |
Analysts expect Ameren’s stock to rise from $99.91 to around $112 on average, suggesting a positive outlook. Edison’s consensus target of $62 also implies upside from the current $60.99 price, though with more limited potential.
Analyst Opinions Comparison
This section compares analysts’ ratings and grades for Ameren Corporation and Edison International:
Rating Comparison
Ameren Corporation Rating
- Rating: B-, considered very favorable overall.
- Discounted Cash Flow Score: 1, rated very unfavorable.
- ROE Score: 4, a favorable indicator of profit generation.
- ROA Score: 3, moderate effectiveness in asset utilization.
- Debt To Equity Score: 2, moderate financial risk level.
- Overall Score: 2, moderate overall financial standing.
Edison International Rating
- Rating: B+, also very favorable overall.
- Discounted Cash Flow Score: 1, rated very unfavorable.
- ROE Score: 5, very favorable, showing strong profit efficiency.
- ROA Score: 4, favorable asset utilization.
- Debt To Equity Score: 1, very unfavorable due to higher risk.
- Overall Score: 3, moderate but higher than Ameren’s.
Which one is the best rated?
Edison International holds a higher overall rating (B+) and scores better on ROE and ROA, indicating stronger profitability and asset use. Ameren has a slightly better debt to equity score, but overall Edison is better rated based on these metrics.
Scores Comparison
Here is a comparison of the financial health scores for Ameren Corporation and Edison International:
Ameren Corporation Scores
- Altman Z-Score: 0.97, in distress zone indicating high bankruptcy risk.
- Piotroski Score: 6, reflecting average financial strength.
Edison International Scores
- Altman Z-Score: 0.72, in distress zone indicating high bankruptcy risk.
- Piotroski Score: 6, reflecting average financial strength.
Which company has the best scores?
Both Ameren and Edison show high bankruptcy risk with Altman Z-Scores in the distress zone. Their Piotroski Scores are identical at 6, signaling average financial strength. Neither company demonstrates superior scores based on this data.
Grades Comparison
Here is a summary of the latest grades for Ameren Corporation and Edison International from recognized grading firms:
Ameren Corporation Grades
The table below shows recent grades assigned to Ameren Corporation by major financial institutions.
| Grading Company | Action | New Grade | Date |
|---|---|---|---|
| UBS | Maintain | Buy | 2025-12-17 |
| Keybanc | Downgrade | Sector Weight | 2025-12-12 |
| Mizuho | Maintain | Outperform | 2025-10-27 |
| Morgan Stanley | Maintain | Equal Weight | 2025-10-22 |
| Barclays | Maintain | Equal Weight | 2025-10-21 |
| Keybanc | Maintain | Overweight | 2025-10-15 |
| Morgan Stanley | Maintain | Equal Weight | 2025-09-25 |
| Keybanc | Maintain | Overweight | 2025-07-16 |
| UBS | Maintain | Buy | 2025-07-11 |
| Barclays | Maintain | Equal Weight | 2025-07-10 |
Ameren’s grades predominantly range from “Buy” to “Equal Weight,” with occasional downgrades but mostly stable outlooks.
Edison International Grades
Below is the grading summary for Edison International from reputable financial firms.
| Grading Company | Action | New Grade | Date |
|---|---|---|---|
| Morgan Stanley | Maintain | Underweight | 2025-12-17 |
| JP Morgan | Maintain | Neutral | 2025-12-12 |
| UBS | Maintain | Buy | 2025-12-02 |
| Ladenburg Thalmann | Maintain | Neutral | 2025-10-30 |
| Barclays | Maintain | Overweight | 2025-10-29 |
| Jefferies | Maintain | Hold | 2025-10-22 |
| Morgan Stanley | Maintain | Underweight | 2025-10-22 |
| Barclays | Maintain | Overweight | 2025-10-21 |
| Jefferies | Downgrade | Hold | 2025-10-02 |
| JP Morgan | Maintain | Neutral | 2025-09-25 |
Edison International’s grades vary more widely, from “Underweight” to “Buy,” with a notable mix of neutral and hold ratings.
Which company has the best grades?
Edison International holds a higher consensus rating of “Buy” with more buy recommendations, whereas Ameren Corporation’s consensus is “Hold” with a balanced mix of buy and hold ratings. This suggests Edison International may currently enjoy stronger analyst confidence, which could influence investor sentiment and portfolio positioning.
Strengths and Weaknesses
The table below compares key strengths and weaknesses of Ameren Corporation (AEE) and Edison International (EIX) based on their recent financial and operational data:
| Criterion | Ameren Corporation (AEE) | Edison International (EIX) |
|---|---|---|
| Diversification | Focused on Electricity (6.54B) and Natural Gas (1.08B) revenues, moderate product mix | Primarily Electric Utility (10.58B) and Competitive Power Generation (2.19B), less diversified |
| Profitability | Net Margin 15.5% (favorable), ROIC 3.3% (unfavorable), declining profitability | Net Margin 8.8% (neutral), ROIC 3.6% (unfavorable), improving profitability trend |
| Innovation | Limited indication of innovation; ROIC trend declining, value destruction | ROIC trend growing, suggesting improving efficiency or innovation |
| Global presence | Primarily regional focus in the US Midwest | US-focused, mainly California, limited global footprint |
| Market Share | Stable in regional utilities; moderate asset turnover | Stronger asset turnover than AEE but still low, competitive market position |
Key takeaways: Both companies face challenges with ROIC below WACC, indicating value destruction. Ameren shows higher net margins but declining returns and weaker liquidity ratios. Edison International’s profitability is improving, though overall financial health remains unfavorable. Caution is advised, with attention to their strategies for operational efficiency and capital use.
Risk Analysis
Below is a comparative table outlining key risks for Ameren Corporation (AEE) and Edison International (EIX) based on the latest data from 2024-2026.
| Metric | Ameren Corporation (AEE) | Edison International (EIX) |
|---|---|---|
| Market Risk | Moderate beta 0.59, stable price range | Slightly higher beta 0.83, more volatile price range |
| Debt level | Debt-to-equity 1.55 (unfavorable), interest coverage 2.92 (neutral) | Debt-to-equity 2.43 (unfavorable), interest coverage 1.84 (unfavorable) |
| Regulatory Risk | High, due to reliance on regulated electric and natural gas markets | High, with significant operations in California subject to strict regulations |
| Operational Risk | Moderate, diverse energy sources including coal, nuclear, renewables | Moderate to high, complex transmission and distribution network in wildfire-prone areas |
| Environmental Risk | Exposure to coal and nuclear energy generation impacts | High risk, California wildfires and carbon regulations impact operations |
| Geopolitical Risk | Low, primarily US-focused utility | Low, primarily US-focused utility |
In summary, both companies face significant regulatory and environmental risks, with Edison International exposed to higher operational challenges due to wildfire threats in California. Both have elevated debt levels with Edison showing weaker interest coverage, increasing financial vulnerability. Market risk is moderate, with EIX slightly more volatile. Investors should weigh these factors carefully given the potential impact on earnings and stability.
Which Stock to Choose?
Ameren Corporation (AEE) shows a favorable income statement with stable profitability and a 15.51% net margin, despite a slight revenue growth slowdown. Its financial ratios reveal some weaknesses in liquidity and leverage, resulting in a slightly unfavorable overall ratio status and a very unfavorable MOAT due to declining ROIC compared to WACC. The company holds a moderate overall rating of B- with mixed score evaluations.
Edison International (EIX) has a favorable and improving income statement with higher net income growth and margin expansion. Financial ratios indicate more challenges, especially in debt management and interest coverage, leading to an unfavorable global ratio opinion and a slightly unfavorable MOAT despite a growing ROIC trend. Edison’s rating is slightly better at B+, but it also faces distress zone signals in bankruptcy risk scores.
From an analytical perspective, investors seeking growth and improving profitability might find Edison International’s income and ROIC trend more appealing, while those prioritizing a more balanced financial ratio profile may see Ameren’s consistent income metrics as relevant. The ratings and financial health nuances suggest the choice could depend on an investor’s risk tolerance and focus on either improving profitability or financial stability.
Disclaimer: Investment carries a risk of loss of initial capital. The past performance is not a reliable indicator of future results. Be sure to understand risks before making an investment decision.
Go Further
I encourage you to read the complete analyses of Ameren Corporation and Edison International to enhance your investment decisions: