Ameren Corporation (AEE) and DTE Energy Company (DTE) both operate in the regulated electric utility sector, providing essential power and natural gas services to millions of customers in the United States. Their shared focus on integrating renewable energy sources alongside traditional generation highlights their innovation strategies amid evolving energy markets. This article will explore their strengths and risks to help you identify which company stands out as a compelling investment opportunity in 2026.
Table of contents
Companies Overview
I will begin the comparison between Ameren Corporation and DTE Energy Company by providing an overview of these two companies and their main differences.
Ameren Corporation Overview
Ameren Corporation operates as a public utility holding company in the US, focusing on rate-regulated electric generation, transmission, and distribution, alongside natural gas distribution and transmission. The company generates electricity through coal, nuclear, natural gas, and renewable sources like hydroelectric, wind, methane gas, and solar. Founded in 1881 and headquartered in St. Louis, Missouri, Ameren serves residential, commercial, and industrial customers.
DTE Energy Company Overview
DTE Energy Company is a utility operator primarily serving southeastern Michigan, with electric and gas segments. It generates electricity using fossil fuels, hydroelectric pumped storage, nuclear, wind, and other renewables. The gas segment supplies natural gas to a broad customer base, supported by extensive pipeline infrastructure. DTE also offers industrial products and energy trading services. Founded in 1903, it is based in Detroit, Michigan.
Key similarities and differences
Both companies operate in the regulated electric utilities industry with diversified energy generation portfolios including fossil fuels and renewables. While Ameren operates across multiple states with a broader utility holding structure, DTE focuses on Michigan with additional gas distribution and industrial project segments. Ameren employs roughly 9,000 staff compared to DTE’s 4,750, reflecting their different operational scales and market coverage.
Income Statement Comparison
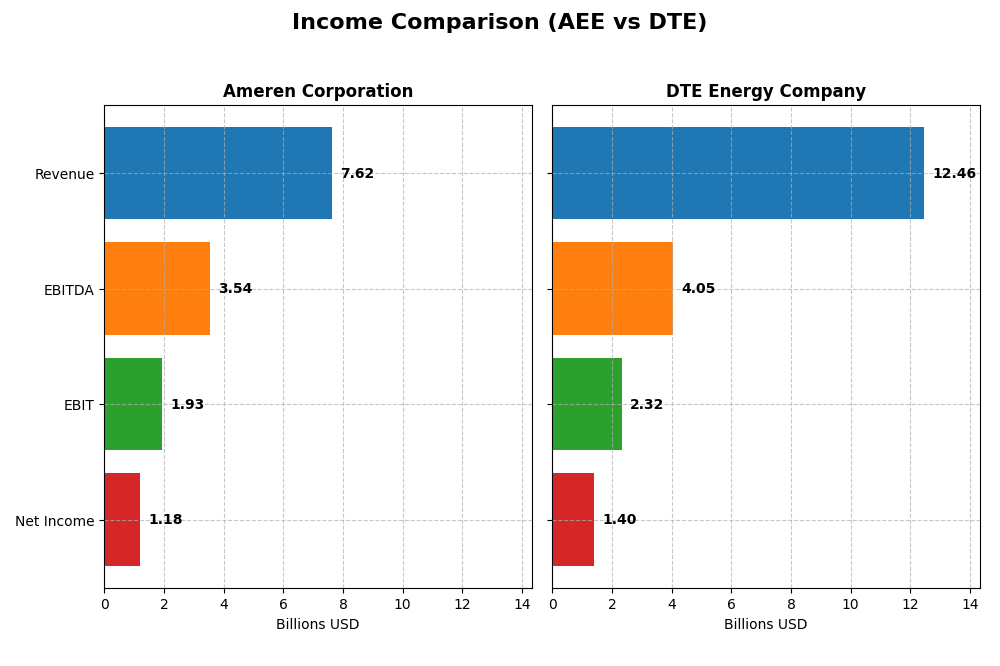
This table compares the key income statement metrics for Ameren Corporation and DTE Energy Company for the most recent fiscal year, 2024, providing a snapshot of their financial performance.
| Metric | Ameren Corporation (AEE) | DTE Energy Company (DTE) |
|---|---|---|
| Market Cap | 27.0B | 27.0B |
| Revenue | 7.62B | 12.46B |
| EBITDA | 3.54B | 4.05B |
| EBIT | 1.93B | 2.32B |
| Net Income | 1.18B | 1.40B |
| EPS | 4.43 | 6.78 |
| Fiscal Year | 2024 | 2024 |
Income Statement Interpretations
Ameren Corporation
Ameren’s revenue showed steady growth over 2020-2024, increasing by 31.6%, with net income rising 35.7%. Margins remained stable, boasting a favorable gross margin near 48% and an EBIT margin above 25%. In 2024, revenue growth slowed slightly to 1.64%, but gross profit and net income margins improved modestly, reflecting operational resilience.
DTE Energy Company
DTE’s revenue grew 9.05% from 2020 to 2024, with net income increasing marginally by 2.4%. Margins were lower than Ameren’s but favorable, with gross margin at 34.8% and EBIT margin at 18.6%. The most recent year saw a 2.26% revenue decline and a slight EBIT contraction, though net margin and EPS remained relatively stable, indicating some operational challenges.
Which one has the stronger fundamentals?
Ameren demonstrates stronger fundamentals, supported by higher margin levels and more robust growth in both revenue and net income over the period. DTE’s growth is more modest with some unfavorable trends in recent years, including shrinking revenue and EBIT. Overall, Ameren’s income statement displays a more favorable and consistent performance profile compared to DTE.
Financial Ratios Comparison
The table below presents a side-by-side comparison of key financial ratios for Ameren Corporation (AEE) and DTE Energy Company (DTE) based on their most recent fiscal year data, 2024.
| Ratios | Ameren Corporation (AEE) | DTE Energy Company (DTE) |
|---|---|---|
| ROE | 9.76% | 12.00% |
| ROIC | 3.32% | 4.65% |
| P/E | 20.12 | 17.80 |
| P/B | 1.96 | 2.14 |
| Current Ratio | 0.66 | 0.71 |
| Quick Ratio | 0.44 | 0.46 |
| D/E (Debt-to-Equity) | 1.55 | 1.99 |
| Debt-to-Assets | 41.98% | 47.58% |
| Interest Coverage | 2.29 | 2.20 |
| Asset Turnover | 0.17 | 0.26 |
| Fixed Asset Turnover | 0.21 | 0.40 |
| Payout Ratio | 60.41% | 57.69% |
| Dividend Yield | 3.00% | 3.24% |
Interpretation of the Ratios
Ameren Corporation
Ameren shows a mixed ratio profile with strong net margin (15.51%) and favorable dividend yield (3.0%), but weaker returns on equity (9.76%) and invested capital (3.32%). Liquidity ratios are below 1, signaling potential short-term risk, and debt levels are moderately high. The company pays dividends, supported by a stable payout, but free cash flow coverage is negative, indicating some financial strain.
DTE Energy Company
DTE Energy presents a solid net margin (11.27%) and a slightly higher dividend yield (3.24%), with neutral return on equity (12.0%) and unfavorable return on invested capital (4.65%). Liquidity remains below ideal levels, and debt ratios are on the higher side. Dividends are paid consistently, but free cash flow yields are negative, suggesting caution regarding dividend sustainability and capital allocation.
Which one has the best ratios?
Both companies have slightly unfavorable global ratio profiles, with equal favorable ratios (21.43%) but differing unfavorable ratios: Ameren at 50.0% versus DTE at 42.86%. DTE displays better returns and dividend yield, while Ameren’s liquidity and leverage metrics are marginally weaker. Overall, neither company has a distinctly superior ratio set.
Strategic Positioning
This section compares the strategic positioning of Ameren Corporation and DTE Energy Company, including market position, key segments, and exposure to technological disruption:
Ameren Corporation
- Stable market cap near 27B USD, operating under regulated electric utility industry with moderate beta
- Revenue primarily from electricity (6.54B) and natural gas (1.08B); serves residential, commercial, and industrial segments
- Utilizes coal, nuclear, natural gas, and renewables; no explicit mention of disruption risk or digital transformation
DTE Energy Company
- Market cap close to 27B USD, regulated electric utility with lower beta, facing competitive pressures in Michigan
- Diverse segments: electric (5.82B), gas (1.75B), energy trading (4.61B), and industrial projects providing metallurgical coke and services
- Generates electricity from fossil fuels, nuclear, hydroelectric, wind, renewables; includes energy trading and infrastructure services
Ameren Corporation vs DTE Energy Company Positioning
Ameren focuses on regulated electric and natural gas distribution within defined regions with steady revenue streams, while DTE presents a more diversified portfolio including energy trading and industrial projects. Ameren’s concentration contrasts with DTE’s broader business drivers and geographic focus.
Which has the best competitive advantage?
Both companies currently shed value as ROIC is below WACC; however, DTE shows improving ROIC trends indicating potential recovery, whereas Ameren experiences declining profitability, reflecting a weaker competitive moat position.
Stock Comparison
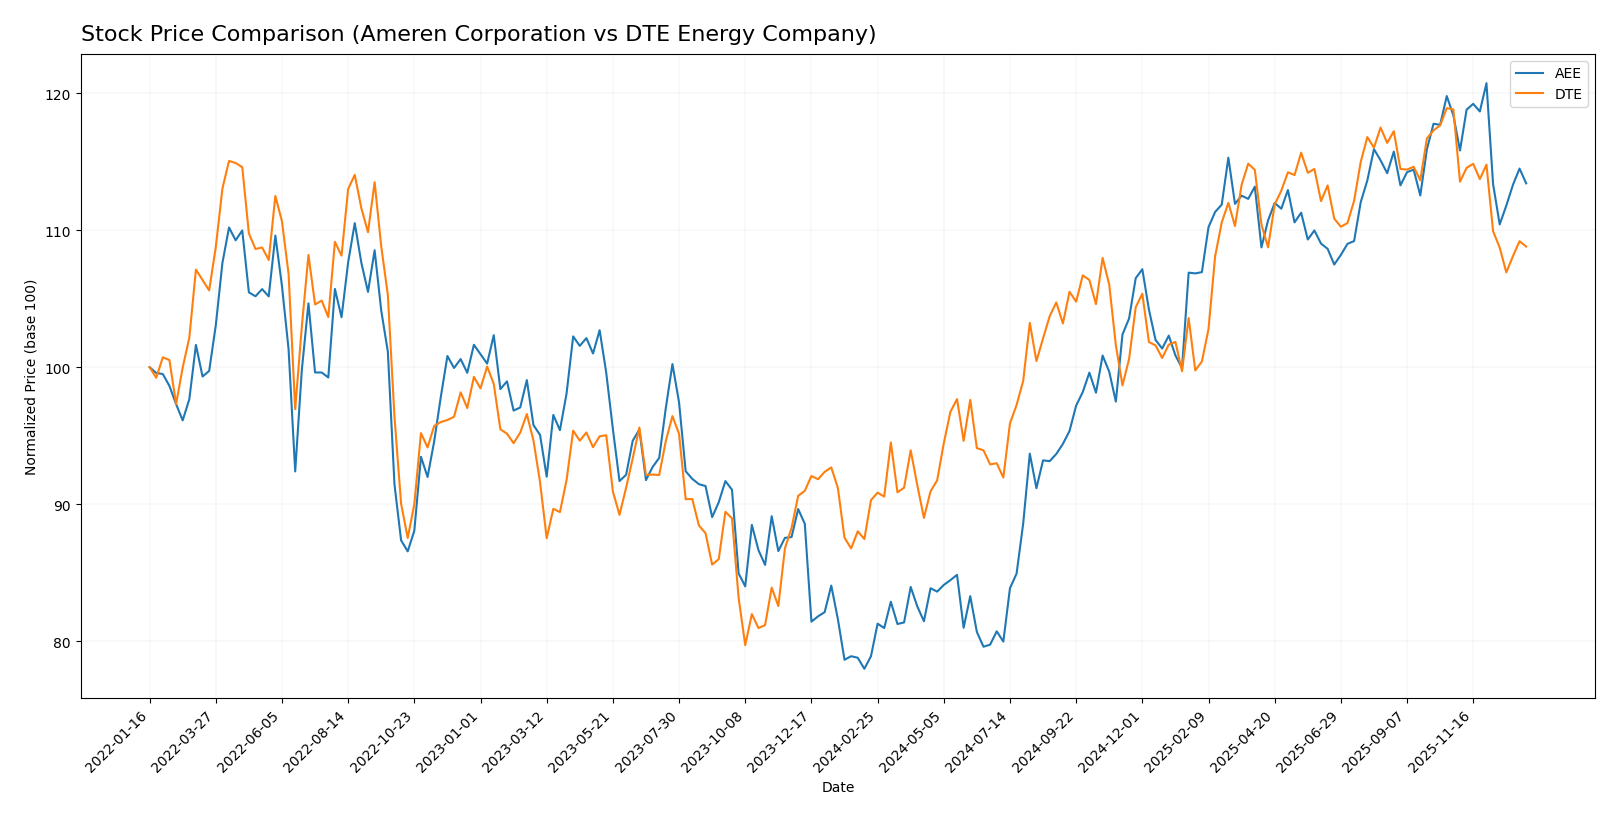
The stock price movements of Ameren Corporation (AEE) and DTE Energy Company (DTE) over the past 12 months reveal significant bullish trends with deceleration, followed by recent downward pressure in the last quarter of 2025 into early 2026.
Trend Analysis
Ameren Corporation (AEE) experienced a strong bullish trend over the past year with a 43.73% price increase, showing deceleration and a high volatility level with an 11.4 standard deviation. Recent months reflect a mild bearish correction of -4.19%.
DTE Energy Company (DTE) posted a 20.49% bullish trend over the same period, also with deceleration and a 10.2 standard deviation. The recent trend indicates a sharper bearish move of -8.42% accompanied by increased volatility.
Comparing both, AEE outperformed DTE in market returns over the past year, despite recent declines, delivering the highest overall price appreciation among the two.
Target Prices
The current analyst consensus for target prices reflects a positive outlook for both Ameren Corporation and DTE Energy Company.
| Company | Target High | Target Low | Consensus |
|---|---|---|---|
| Ameren Corporation | 119 | 103 | 111.86 |
| DTE Energy Company | 157 | 138 | 148.29 |
Analysts expect Ameren’s stock to rise from its current price of 99.91 to around 111.86 on average, while DTE’s consensus target of 148.29 suggests a notable upside from its current 129.89 price.
Analyst Opinions Comparison
This section compares analysts’ ratings and grades for Ameren Corporation and DTE Energy Company:
Rating Comparison
Ameren Corporation Rating
- Rating: B-, considered very favorable by analysts.
- Discounted Cash Flow Score: 1, indicating very unfavorable valuation.
- ROE Score: 4, showing favorable efficiency in generating shareholder profits.
- ROA Score: 3, moderate effectiveness in asset utilization.
- Debt To Equity Score: 2, moderate financial risk level.
- Overall Score: 2, moderate overall financial standing.
DTE Energy Company Rating
- Rating: C, also rated very favorable by analysts.
- Discounted Cash Flow Score: 1, similarly very unfavorable.
- ROE Score: 3, moderate level of efficiency in profit generation.
- ROA Score: 2, moderate but lower effectiveness in asset use.
- Debt To Equity Score: 1, indicating very unfavorable financial risk.
- Overall Score: 2, also moderate overall standing.
Which one is the best rated?
Based strictly on the provided data, Ameren Corporation holds a better rating (B-) compared to DTE Energy Company’s C. Ameren also scores higher in ROE, ROA, and debt-to-equity, indicating relatively stronger financial metrics.
Scores Comparison
The comparison of scores for Ameren Corporation and DTE Energy Company is as follows:
Ameren Corporation Scores
- Altman Z-Score: 0.97, in the distress zone, high bankruptcy risk.
- Piotroski Score: 6, average financial strength.
DTE Energy Company Scores
- Altman Z-Score: 1.03, in the distress zone, high bankruptcy risk.
- Piotroski Score: 7, strong financial strength.
Which company has the best scores?
DTE Energy shows slightly better financial health with a higher Altman Z-Score and a stronger Piotroski Score compared to Ameren Corporation, which remains in distress with an average Piotroski rating.
Grades Comparison
Here is the detailed grades comparison for Ameren Corporation and DTE Energy Company:
Ameren Corporation Grades
The table below shows recent grades from reputable grading companies for Ameren Corporation:
| Grading Company | Action | New Grade | Date |
|---|---|---|---|
| UBS | Maintain | Buy | 2025-12-17 |
| Keybanc | Downgrade | Sector Weight | 2025-12-12 |
| Mizuho | Maintain | Outperform | 2025-10-27 |
| Morgan Stanley | Maintain | Equal Weight | 2025-10-22 |
| Barclays | Maintain | Equal Weight | 2025-10-21 |
| Keybanc | Maintain | Overweight | 2025-10-15 |
| Morgan Stanley | Maintain | Equal Weight | 2025-09-25 |
| Keybanc | Maintain | Overweight | 2025-07-16 |
| UBS | Maintain | Buy | 2025-07-11 |
| Barclays | Maintain | Equal Weight | 2025-07-10 |
Ameren’s grades show a mix of “Buy,” “Outperform,” and “Equal Weight,” with some recent downgrades from Keybanc, indicating a cautious but generally stable outlook.
DTE Energy Company Grades
The table below presents recent grades from reliable grading companies for DTE Energy Company:
| Grading Company | Action | New Grade | Date |
|---|---|---|---|
| BMO Capital | Maintain | Market Perform | 2025-12-24 |
| UBS | Maintain | Buy | 2025-12-17 |
| JP Morgan | Maintain | Neutral | 2025-12-11 |
| Jefferies | Upgrade | Buy | 2025-12-11 |
| B of A Securities | Maintain | Buy | 2025-11-05 |
| Scotiabank | Maintain | Sector Perform | 2025-10-31 |
| Morgan Stanley | Maintain | Overweight | 2025-10-22 |
| Barclays | Maintain | Equal Weight | 2025-10-14 |
| UBS | Maintain | Buy | 2025-10-10 |
| Scotiabank | Downgrade | Sector Perform | 2025-10-03 |
DTE’s grades reflect a generally positive stance, with multiple “Buy” and “Overweight” ratings, despite a recent downgrade by Scotiabank.
Which company has the best grades?
Both Ameren Corporation and DTE Energy Company have consensus ratings of “Hold.” However, DTE Energy has a higher number of “Buy” ratings and recent upgrades, suggesting a more favorable analyst sentiment. This could influence investors seeking slightly stronger growth signals.
Strengths and Weaknesses
The table below summarizes the key strengths and weaknesses of Ameren Corporation (AEE) and DTE Energy Company (DTE) based on their latest financial and operational data.
| Criterion | Ameren Corporation (AEE) | DTE Energy Company (DTE) |
|---|---|---|
| Diversification | Moderate: Mainly electricity (6.54B) and natural gas (1.08B) revenues | High: Multiple segments including electric (5.82B), gas (1.75B), energy trading (4.61B), and DTE Vantage (0.81B) |
| Profitability | Mixed: Net margin favorable (15.5%), but ROIC (3.3%) and ROE (9.8%) unfavorable | Mixed: Net margin favorable (11.3%), ROIC low (4.7%), ROE neutral (12%) |
| Innovation | Limited visibility on innovation initiatives | Diversified innovation via DTE Vantage clean energy business (0.81B revenue) |
| Global presence | Primarily regional U.S. utility operations | Primarily regional U.S. utility operations with energy trading exposure |
| Market Share | Stable in Midwestern U.S. utility markets | Stable in Michigan and Midwest markets with diversified activities |
In summary, Ameren shows solid net margins but struggles with value creation and efficiency, reflecting a declining ROIC trend. DTE, while also shedding value overall, demonstrates improving profitability and benefits from greater diversification and innovation exposure, making it a slightly more favorable option with cautious risk management advised.
Risk Analysis
Below is a comparison of key risks for Ameren Corporation (AEE) and DTE Energy Company (DTE) based on 2024 data.
| Metric | Ameren Corporation (AEE) | DTE Energy Company (DTE) |
|---|---|---|
| Market Risk | Moderate (Beta 0.59) | Moderate (Beta 0.48) |
| Debt level | High (Debt/Equity 1.55, Neutral debt-to-assets 42%) | Higher (Debt/Equity 1.99, Neutral debt-to-assets 48%) |
| Regulatory Risk | Elevated, due to utilities sector | Elevated, similar regulatory exposure |
| Operational Risk | Medium, asset turnover low (0.17) | Medium, asset turnover low (0.26) |
| Environmental Risk | Moderate, reliance on coal and gas with renewables | Moderate, similar energy mix including fossil fuels |
| Geopolitical Risk | Low (US-based, stable region) | Low (US-based, stable region) |
Both companies share a slightly unfavorable financial profile with moderately high debt levels and operational efficiency challenges. The most impactful risks are their regulatory environment and debt burden, which could affect profitability and credit stability. Notably, both are in the distress zone per Altman Z-Score, signaling caution on financial health despite favorable dividend yields.
Which Stock to Choose?
Ameren Corporation (AEE) shows a favorable income statement with 31.57% revenue growth overall and 15.51% net margin, yet its financial ratios are slightly unfavorable, with a 9.76% ROE and net debt to EBITDA of 5.29. Its credit rating is very favorable at B-, despite a very unfavorable economic moat due to declining ROIC below WACC.
DTE Energy Company (DTE) presents a less favorable income statement, with only 9.05% revenue growth overall and 11.25% net margin. Its financial ratios are also slightly unfavorable but with a higher ROE of 12.0% and net debt to EBITDA of 5.73. DTE holds a very favorable credit rating of C and a slightly unfavorable moat with improving ROIC.
For investors prioritizing growth, AEE’s stronger income growth and favorable margins could appear more attractive. Conversely, those valuing improving profitability and a stronger ROE might find DTE’s profile more suitable, despite its lower income growth. Both companies exhibit some financial risks, suggesting caution depending on risk tolerance.
Disclaimer: Investment carries a risk of loss of initial capital. The past performance is not a reliable indicator of future results. Be sure to understand risks before making an investment decision.
Go Further
I encourage you to read the complete analyses of Ameren Corporation and DTE Energy Company to enhance your investment decisions: