Dominion Energy, Inc. and Ameren Corporation are two key players in the regulated electric utility sector, serving millions of customers across multiple states in the US. Both companies focus on energy generation, transmission, and distribution while advancing renewable energy initiatives. Their shared market presence and innovation strategies make them worthy of comparison. In this article, I will analyze which company presents a more compelling investment opportunity for your portfolio.
Table of contents
Companies Overview
I will begin the comparison between Dominion Energy and Ameren Corporation by providing an overview of these two companies and their main differences.
Dominion Energy Overview
Dominion Energy, Inc. is a U.S.-based utility company focused on producing and distributing energy through regulated electric and gas operations. It serves approximately 7 million customers across Virginia, North Carolina, South Carolina, and several other states. Its portfolio includes 30.2GW of electric capacity and extensive transmission and distribution infrastructure, complemented by nonregulated renewable energy and gas liquefaction assets.
Ameren Corporation Overview
Ameren Corporation operates as a public utility holding company primarily engaged in rate-regulated electric generation, transmission, and distribution, along with natural gas distribution and transmission. It serves residential, commercial, and industrial customers mainly in Missouri and Illinois. Ameren generates electricity using coal, nuclear, natural gas, and renewable sources such as hydroelectric, wind, and solar, positioning itself in a diversified energy market.
Key similarities and differences
Both Dominion Energy and Ameren operate in the regulated electric and gas utilities sector in the U.S., serving millions of customers with a mix of traditional and renewable energy sources. Dominion has a larger market cap ($49.5B vs. $27B) and broader footprint across multiple states, while Ameren focuses on Missouri and Illinois with a diversified energy generation mix including coal and nuclear. Both companies emphasize regulated operations but differ in scale and geographic reach.
Income Statement Comparison
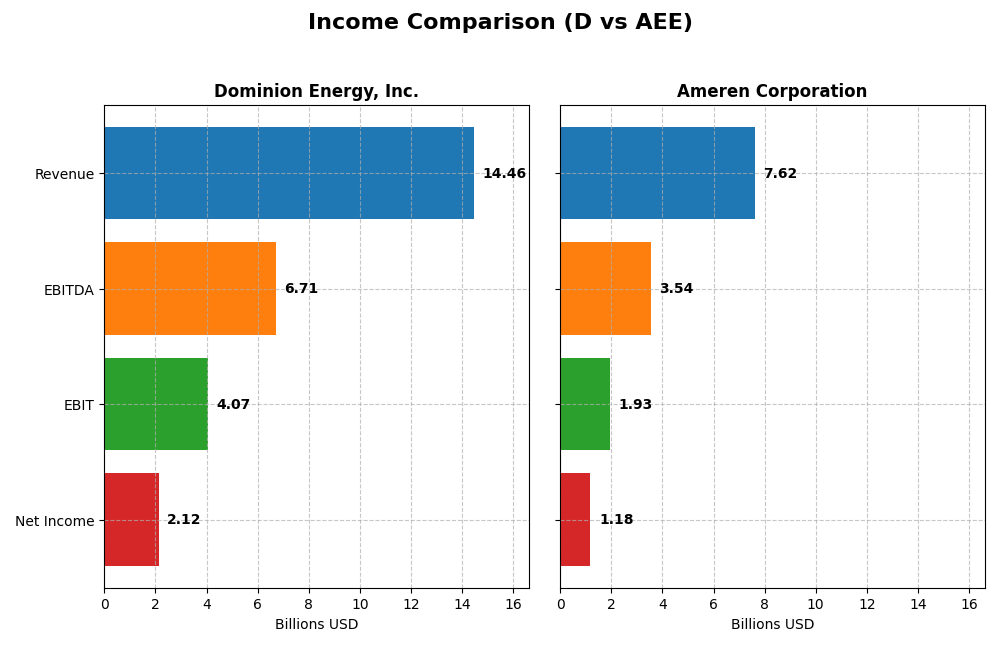
The table below presents a side-by-side comparison of key income statement metrics for Dominion Energy, Inc. and Ameren Corporation for their fiscal year 2024.
| Metric | Dominion Energy, Inc. | Ameren Corporation |
|---|---|---|
| Market Cap | 49.5B | 27.0B |
| Revenue | 14.5B | 7.6B |
| EBITDA | 6.7B | 3.5B |
| EBIT | 4.1B | 1.9B |
| Net Income | 2.1B | 1.2B |
| EPS | 2.44 | 4.43 |
| Fiscal Year | 2024 | 2024 |
Income Statement Interpretations
Dominion Energy, Inc.
Dominion Energy’s revenue showed minimal growth, increasing by 0.46% in 2024, with an overall period growth of 2.03%. Net income surged significantly by 629.68% over the period, supported by a 6.55% EPS growth in the most recent year. Margins remain strong, with a favorable gross margin near 48% and an improving net margin, despite an unfavorable rise in interest expenses.
Ameren Corporation
Ameren demonstrated steady revenue growth of 1.64% in 2024 and a solid 31.57% increase over five years. Net income growth is moderate but positive at 35.71% overall, with stable EPS growth. Gross margin slightly improved to 47.92%, while EBIT and net margins are favorable. Interest expense remains neutral, reflecting stable cost control amid operating expense growth.
Which one has the stronger fundamentals?
Dominion Energy exhibits stronger net income and EPS growth, with robust margin improvements, though challenged by higher interest expenses. Ameren shows consistent revenue and profit advancement with better interest expense management and stable margins. Both companies have favorable income statement evaluations, but Dominion’s exceptional net income growth contrasts with Ameren’s steadier financial progress.
Financial Ratios Comparison
The following table presents key financial ratios for Dominion Energy, Inc. and Ameren Corporation based on their most recent fiscal year 2024 data, providing a clear snapshot for comparison.
| Ratios | Dominion Energy, Inc. (D) | Ameren Corporation (AEE) |
|---|---|---|
| ROE | 7.79% | 9.76% |
| ROIC | 2.86% | 3.32% |
| P/E | 21.28 | 20.12 |
| P/B | 1.66 | 1.96 |
| Current Ratio | 0.71 | 0.66 |
| Quick Ratio | 0.52 | 0.44 |
| D/E | 1.53 | 1.55 |
| Debt-to-Assets | 40.77% | 41.98% |
| Interest Coverage | 1.72 | 2.29 |
| Asset Turnover | 0.14 | 0.17 |
| Fixed Asset Turnover | 0.21 | 0.21 |
| Payout ratio | 105.4% | 60.4% |
| Dividend yield | 4.95% | 3.00% |
Interpretation of the Ratios
Dominion Energy, Inc.
Dominion Energy shows a mixed financial profile with a favorable net margin of 14.69% but unfavorable returns on equity (7.79%) and invested capital (2.86%). Liquidity ratios are weak, with a current ratio of 0.71 and quick ratio of 0.52, indicating potential short-term liquidity concerns. The company pays dividends with a solid 4.95% yield, suggesting steady shareholder returns supported by payout coverage, though some caution is warranted due to the mixed operational efficiency.
Ameren Corporation
Ameren Corporation presents a slightly better net margin at 15.51%, but similarly unfavorable returns on equity (9.76%) and invested capital (3.32%), alongside weak liquidity ratios (current ratio 0.66, quick ratio 0.44). Its dividend yield is lower at 3.0%, reflecting more conservative shareholder returns. Despite these weaknesses, Ameren maintains stable coverage ratios and moderate operational efficiency, balancing risks in payout sustainability.
Which one has the best ratios?
Both Dominion Energy and Ameren have an identical ratio evaluation distribution with 21.43% favorable, 50% unfavorable, and 28.57% neutral ratios, leading to a slightly unfavorable global opinion. Ameren’s marginally higher net margin and return on equity contrast with Dominion’s stronger dividend yield. Neither company distinctly outperforms the other, as both exhibit strengths and vulnerabilities in their financial ratios.
Strategic Positioning
This section compares the strategic positioning of Dominion Energy and Ameren Corporation, including market position, key segments, and exposure to technological disruption:
Dominion Energy, Inc.
- Large market cap of 49.5B in regulated electric with moderate competitive pressure.
- Diversified segments: Virginia and South Carolina electricity, gas distribution, contracted renewable energy assets.
- Exposure to renewable energy through contracted assets and nonregulated renewable natural gas facilities.
Ameren Corporation
- Smaller market cap of 27B in regulated electric facing moderate competition.
- Focused on rate-regulated electricity and natural gas generation, distribution, and transmission.
- Generates power from coal, nuclear, natural gas, and renewables such as hydro, wind, methane, and solar.
Dominion Energy vs Ameren Corporation Positioning
Dominion Energy has a diversified geographic and product base with significant presence in both electricity and gas markets, while Ameren is more concentrated in regulated electric and natural gas utilities. Dominion’s broader segment mix may offer multiple revenue drivers; Ameren’s focused approach centers on traditional and renewable generation.
Which has the best competitive advantage?
Both companies are currently shedding value with ROIC below WACC. Dominion Energy shows improving profitability with a growing ROIC trend, while Ameren faces declining ROIC and worsening profitability, indicating a relatively weaker competitive advantage.
Stock Comparison
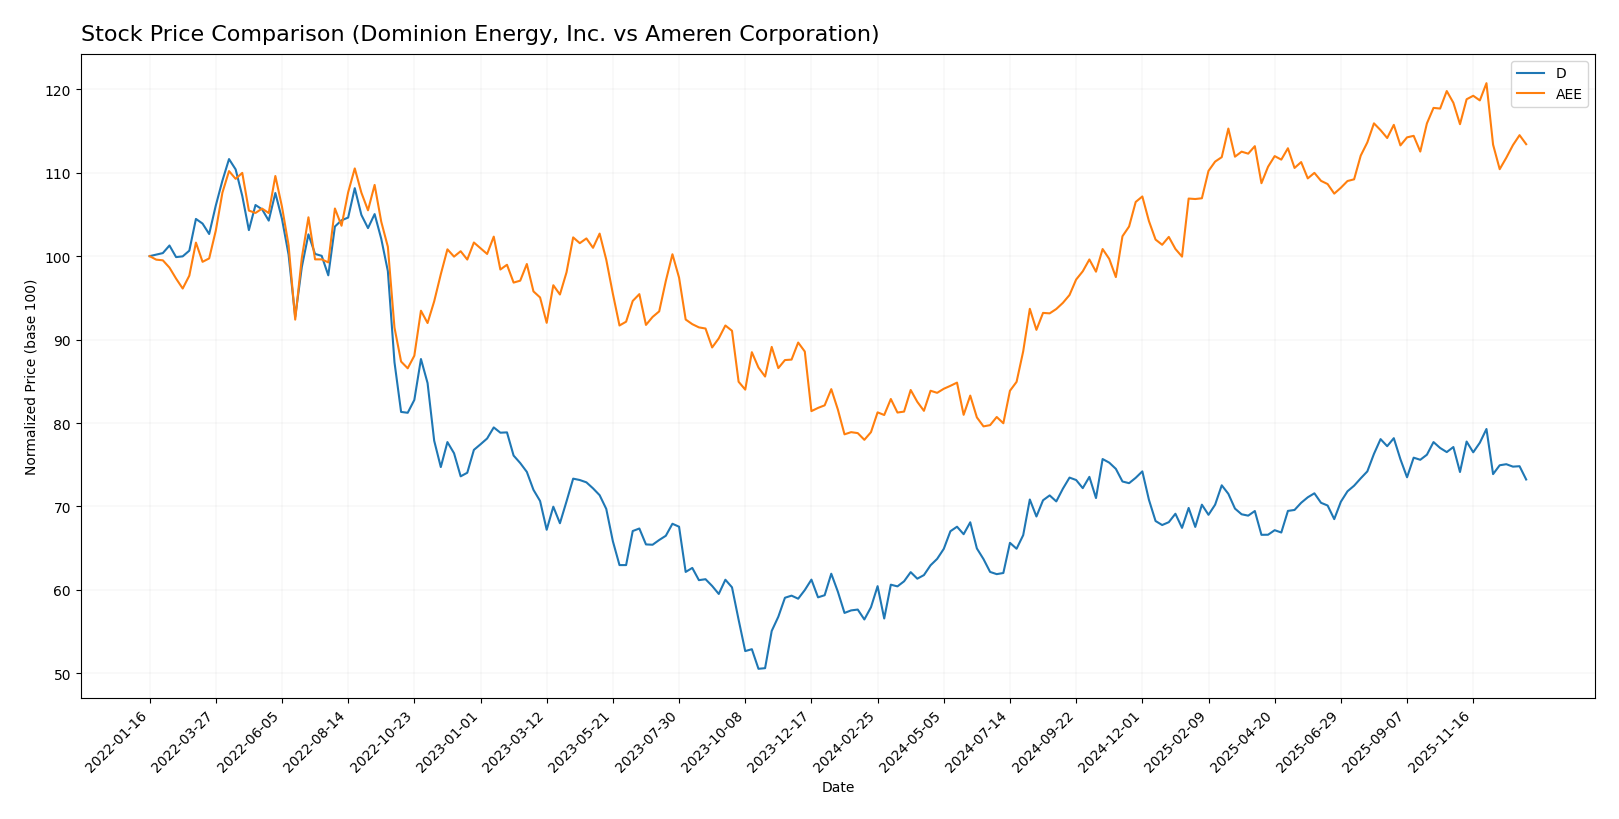
The stock price movements of Dominion Energy, Inc. and Ameren Corporation over the past 12 months reveal significant bullish trends with decelerating momentum, highlighting key price levels and shifting trading volumes.
Trend Analysis
Dominion Energy, Inc. shows a 26.43% price increase over the last year, indicating a bullish trend with deceleration in growth. The stock reached a high of 62.77 and a low of 44.79, with moderate volatility (4.03 std deviation).
Ameren Corporation experienced a stronger 43.73% price rise over the same period, also bullish with deceleration. It exhibited higher volatility (11.4 std deviation), with prices ranging from 69.51 to 106.35.
Comparing both, Ameren Corporation delivered the highest market performance, outperforming Dominion Energy with a larger percentage gain despite greater price volatility.
Target Prices
The current analyst consensus for target prices reflects moderate upside potential for both Dominion Energy, Inc. and Ameren Corporation.
| Company | Target High | Target Low | Consensus |
|---|---|---|---|
| Dominion Energy, Inc. | 70 | 63 | 66 |
| Ameren Corporation | 119 | 103 | 111.86 |
Analysts expect Dominion Energy’s stock to rise from its current price of $57.98 to around $66, indicating potential appreciation. Ameren’s target consensus at $111.86 suggests a similarly positive outlook compared to its current price near $99.91.
Analyst Opinions Comparison
This section compares analysts’ ratings and grades for Dominion Energy, Inc. (D) and Ameren Corporation (AEE):
Rating Comparison
D Rating
- Rating: C+ rated as Very Favorable overall.
- Discounted Cash Flow Score: 4, considered Favorable for valuation.
- ROE Score: 3, a Moderate efficiency in generating profit from equity.
- ROA Score: 1, considered Very Unfavorable in asset utilization.
- Debt To Equity Score: 3, Moderate financial risk indicated.
- Overall Score: 2, reflects a Moderate summary financial standing.
AEE Rating
- Rating: B- rated as Very Favorable overall.
- Discounted Cash Flow Score: 1, considered Very Unfavorable for valuation.
- ROE Score: 4, a Favorable efficiency in generating profit from equity.
- ROA Score: 3, considered Moderate in asset utilization.
- Debt To Equity Score: 2, Moderate financial risk indicated.
- Overall Score: 2, reflects a Moderate summary financial standing.
Which one is the best rated?
Based strictly on provided data, AEE holds a better rating (B-) versus D’s C+, with higher ROE and ROA scores. However, D outperforms AEE in discounted cash flow, indicating differing strengths in their financial profiles.
Scores Comparison
The scores comparison between Dominion Energy, Inc. and Ameren Corporation is as follows:
Dominion Energy, Inc. Scores
- Altman Z-Score: Unavailable, no data provided.
- Piotroski Score: 7, strong financial health.
Ameren Corporation Scores
- Altman Z-Score: 0.97, in distress zone indicating high bankruptcy risk.
- Piotroski Score: 6, average financial health.
Which company has the best scores?
Dominion Energy has a stronger Piotroski Score of 7 compared to Ameren’s 6, indicating better financial health. However, Ameren’s available Altman Z-Score shows distress, while Dominion’s Altman Z-Score is unavailable.
Grades Comparison
Here is a detailed comparison of the recent grades assigned to Dominion Energy, Inc. and Ameren Corporation by reputable grading companies:
Dominion Energy, Inc. Grades
The following table summarizes recent grades given by established financial institutions for Dominion Energy, Inc.:
| Grading Company | Action | New Grade | Date |
|---|---|---|---|
| Barclays | Maintain | Overweight | 2025-12-17 |
| JP Morgan | Maintain | Underweight | 2025-12-11 |
| BMO Capital | Maintain | Market Perform | 2025-11-03 |
| Morgan Stanley | Maintain | Equal Weight | 2025-10-22 |
| Barclays | Maintain | Overweight | 2025-10-07 |
| Morgan Stanley | Maintain | Equal Weight | 2025-09-25 |
| JP Morgan | Maintain | Underweight | 2025-08-21 |
| JP Morgan | Maintain | Underweight | 2025-07-15 |
| Morgan Stanley | Maintain | Equal Weight | 2025-06-18 |
| Morgan Stanley | Maintain | Equal Weight | 2025-05-22 |
Dominion Energy’s grades show a mixed trend with multiple “Equal Weight” and “Underweight” ratings, balanced by “Overweight” assessments from Barclays.
Ameren Corporation Grades
The table below shows recent grades from recognized grading companies for Ameren Corporation:
| Grading Company | Action | New Grade | Date |
|---|---|---|---|
| UBS | Maintain | Buy | 2025-12-17 |
| Keybanc | Downgrade | Sector Weight | 2025-12-12 |
| Mizuho | Maintain | Outperform | 2025-10-27 |
| Morgan Stanley | Maintain | Equal Weight | 2025-10-22 |
| Barclays | Maintain | Equal Weight | 2025-10-21 |
| Keybanc | Maintain | Overweight | 2025-10-15 |
| Morgan Stanley | Maintain | Equal Weight | 2025-09-25 |
| Keybanc | Maintain | Overweight | 2025-07-16 |
| UBS | Maintain | Buy | 2025-07-11 |
| Barclays | Maintain | Equal Weight | 2025-07-10 |
Ameren Corporation’s grades predominantly range from “Equal Weight” to “Buy” and “Outperform,” with a single recent downgrade to “Sector Weight” by Keybanc.
Which company has the best grades?
Ameren Corporation holds generally stronger grades than Dominion Energy, with more “Buy” and “Outperform” ratings compared to Dominion’s mixed “Overweight,” “Equal Weight,” and “Underweight” grades. This contrast may influence investors’ views on growth potential and risk profiles differently.
Strengths and Weaknesses
Here is a comparative overview of key strengths and weaknesses of Dominion Energy, Inc. (D) and Ameren Corporation (AEE) based on the latest data:
| Criterion | Dominion Energy, Inc. (D) | Ameren Corporation (AEE) |
|---|---|---|
| Diversification | Moderate: Focus on electricity and gas with regional concentration in Virginia and South Carolina | Moderate: Electricity and natural gas with strong presence in Illinois and Missouri |
| Profitability | Net margin favorable at 14.69%, but ROIC (2.86%) below WACC (5.34%), indicating value destruction despite improving ROIC trend | Net margin favorable at 15.51%, but ROIC (3.32%) below WACC (5.19%), with declining ROIC trend reflecting worsening value destruction |
| Innovation | Limited innovation signals; stable operations in regulated energy markets | Limited innovation signals; traditional utility model with steady operations |
| Global presence | Mainly regional U.S. operations concentrated in Virginia and South Carolina | Mainly regional U.S. operations concentrated in Illinois and Missouri |
| Market Share | Leading utility in Virginia with large revenue base (~$10.2B) from this segment | Strong regional utility in Illinois and Missouri with ~$6.5B electricity revenue |
Key takeaways: Both companies operate primarily as regional utilities with moderate diversification. Dominion shows a slightly more favorable profitability trend with growing ROIC, while Ameren’s profitability is declining. Both face challenges in innovation and have similar financial health concerns, suggesting cautious investment consideration.
Risk Analysis
The table below presents a comparison of key risks for Dominion Energy, Inc. (D) and Ameren Corporation (AEE) based on the most recent data from 2024.
| Metric | Dominion Energy, Inc. (D) | Ameren Corporation (AEE) |
|---|---|---|
| Market Risk | Moderate (Beta 0.699) | Moderate (Beta 0.592) |
| Debt level | High (Debt/Equity 1.53) | High (Debt/Equity 1.55) |
| Regulatory Risk | Elevated due to utility sector regulation | Elevated, subject to state and federal utility regulations |
| Operational Risk | Moderate, infrastructure heavy | Moderate, diverse energy sources |
| Environmental Risk | Medium, transitioning to renewables but legacy assets remain | Medium, coal and nuclear exposure with growing renewables |
| Geopolitical Risk | Low, primarily US operations | Low, primarily US operations |
Dominion and Ameren share similar risk profiles with significant debt levels and moderate market risk due to their utility sector nature. Environmental and regulatory risks are notable, especially as both navigate energy transition pressures. Ameren’s distress-zone Altman Z-score signals higher financial risk, warranting cautious monitoring.
Which Stock to Choose?
Dominion Energy, Inc. (D) shows modest revenue growth of 0.46% in 2024 but strong net income growth of 630% over 2020-2024. Its profitability is favorable with a net margin of 14.69%, though return on equity (7.79%) and return on invested capital (2.86%) are less favorable. The company carries significant debt (net debt to EBITDA of 6.18) and its overall rating is very favorable (C+), despite some unfavorable financial ratios.
Ameren Corporation (AEE) reports better revenue growth of 1.64% in 2024 and solid net income growth of 36% over the five-year period. It has a slightly higher net margin of 15.51%, but also less favorable returns on equity (9.76%) and invested capital (3.32%). Debt levels are comparable (net debt to EBITDA of 5.29) and the company holds a very favorable rating (B-), with a similar mixed ratio profile.
For investors prioritizing growth potential and improving profitability, Dominion Energy’s strong income growth and favorable income statement might appear attractive. Conversely, Ameren’s steadier revenue expansion and higher return metrics may be more appealing for those valuing consistent financial stability. Both companies face challenges with debt and financial ratios, suggesting cautious consideration aligned with one’s risk tolerance and investment strategy.
Disclaimer: Investment carries a risk of loss of initial capital. The past performance is not a reliable indicator of future results. Be sure to understand risks before making an investment decision.
Go Further
I encourage you to read the complete analyses of Dominion Energy, Inc. and Ameren Corporation to enhance your investment decisions: