Investors seeking stable returns often turn to regulated electric utilities, a sector known for its resilience and steady dividends. Consolidated Edison, Inc. (ED) and Ameren Corporation (AEE) stand out as two prominent players in this space, both serving large customer bases with a mix of traditional and renewable energy sources. This comparison explores their market positions, innovation strategies, and growth potential to help you decide which company might best fit your investment portfolio.
Table of contents
Companies Overview
I will begin the comparison between Consolidated Edison, Inc. and Ameren Corporation by providing an overview of these two companies and their main differences.
Consolidated Edison, Inc. Overview
Consolidated Edison, Inc. operates primarily in the regulated electric, gas, and steam delivery sectors in the US. It serves approximately 3.5M electric customers in New York City and Westchester County, alongside 1.1M gas customers in Manhattan and adjacent areas. The company also owns extensive transmission and distribution infrastructure and invests in renewable energy projects, positioning itself as a key utility provider in the New York metropolitan area.
Ameren Corporation Overview
Ameren Corporation is a public utility holding company focused on rate-regulated electric generation, transmission, and distribution, as well as natural gas services. It operates through four segments covering Missouri and Illinois, generating electricity from coal, nuclear, natural gas, and renewable sources like hydroelectric and wind. Ameren serves residential, commercial, and industrial customers, with its headquarters in St. Louis and a workforce of nearly 9K employees.
Key similarities and differences
Both companies operate within the regulated electric utility sector and serve residential, commercial, and industrial customers in the US. While Consolidated Edison emphasizes electric, gas, and steam delivery primarily in the New York region, Ameren covers a broader geographic area with diversified energy generation sources including nuclear and renewables. Additionally, Consolidated Edison has a larger workforce and a more concentrated service area compared to Ameren’s multi-segment regional operations.
Income Statement Comparison
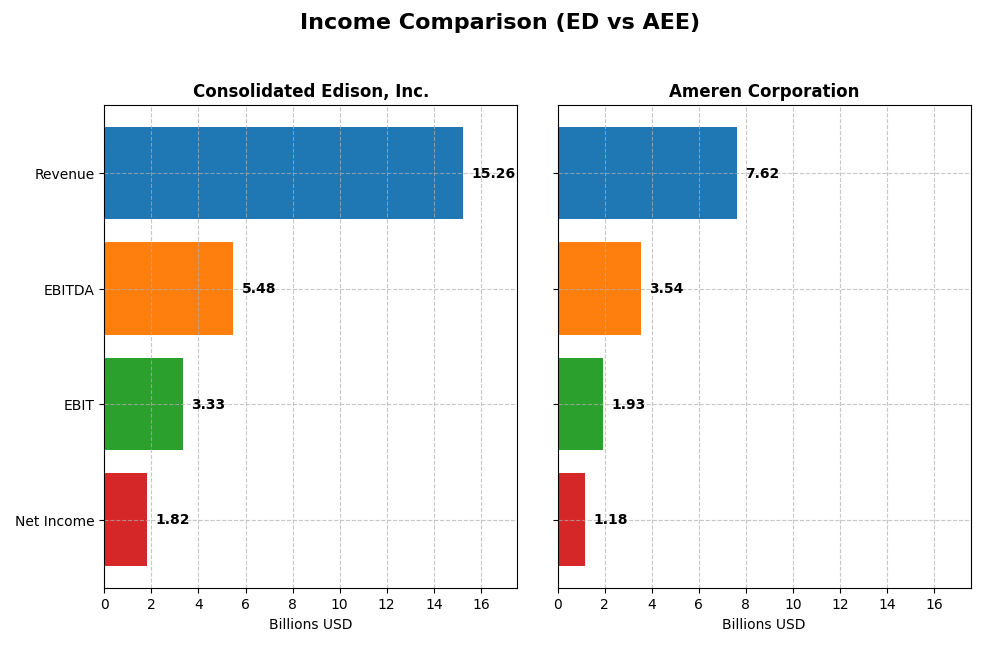
This table presents a side-by-side comparison of key income statement metrics for Consolidated Edison, Inc. and Ameren Corporation for the fiscal year 2024.
| Metric | Consolidated Edison, Inc. (ED) | Ameren Corporation (AEE) |
|---|---|---|
| Market Cap | 35.8B | 27.0B |
| Revenue | 15.3B | 7.6B |
| EBITDA | 5.5B | 3.5B |
| EBIT | 3.3B | 1.9B |
| Net Income | 1.8B | 1.2B |
| EPS | 5.26 | 4.43 |
| Fiscal Year | 2024 | 2024 |
Income Statement Interpretations
Consolidated Edison, Inc.
Consolidated Edison, Inc. exhibited overall revenue growth of 24.65% and net income growth of 65.3% from 2020 to 2024, with favorable gross and net margins at 63.99% and 11.93%, respectively. However, in 2024, growth slowed to 4.16% in revenue and net income declined significantly by 27.32%, reflecting an unfavorable contraction in EBIT and net margins despite a generally favorable margin profile.
Ameren Corporation
Ameren Corporation showed a 31.57% revenue increase and 35.71% net income growth over the 2020-2024 period, maintaining favorable gross (47.92%) and net margins (15.51%). In 2024, revenue growth slowed to 1.64%, with net income and EPS rising modestly by around 0.9%, while EBIT growth was neutral. Margins remained stable, supporting a generally favorable income statement trend.
Which one has the stronger fundamentals?
Both companies present favorable income statement fundamentals with positive overall revenue and net income growth. Consolidated Edison boasts higher gross margins and stronger long-term net income growth but suffered a notable income contraction in the latest year. Ameren shows steadier recent growth with solid margins and less volatility. The choice depends on the preference between stronger historical growth versus recent stability.
Financial Ratios Comparison
The following table presents a side-by-side comparison of key financial ratios for Consolidated Edison, Inc. (ED) and Ameren Corporation (AEE) based on their most recent fiscal year data from 2024.
| Ratios | Consolidated Edison, Inc. (ED) | Ameren Corporation (AEE) |
|---|---|---|
| ROE | 8.29% | 9.76% |
| ROIC | 3.48% | 3.32% |
| P/E | 16.96 | 20.12 |
| P/B | 1.41 | 1.96 |
| Current Ratio | 1.04 | 0.66 |
| Quick Ratio | 0.96 | 0.44 |
| D/E | 1.27 | 1.55 |
| Debt-to-Assets | 39.4% | 41.98% |
| Interest Coverage | 2.30 | 2.29 |
| Asset Turnover | 0.22 | 0.17 |
| Fixed Asset Turnover | 0.29 | 0.21 |
| Payout Ratio | 60.4% | 60.4% |
| Dividend Yield | 3.56% | 3.00% |
Interpretation of the Ratios
Consolidated Edison, Inc.
Consolidated Edison shows a mix of strong and weak financial ratios. Its net margin and dividend yield are favorable, indicating solid profitability and shareholder returns. However, return on equity (8.29%) and return on invested capital (3.48%) are unfavorable, reflecting challenges in generating efficient returns. The payout appears sustainable given the 3.56% dividend yield.
Ameren Corporation
Ameren Corporation also presents a blend of strengths and weaknesses. The company posts a higher net margin (15.51%) than its peer and a decent dividend yield of 3.0%, which supports shareholder returns. Yet, its liquidity ratios and leverage (debt-to-equity at 1.55) are unfavorable, raising potential concerns over short-term financial flexibility and debt levels.
Which one has the best ratios?
Both companies have slightly unfavorable global ratios, but Consolidated Edison has a higher proportion of favorable ratios (28.57%) compared to Ameren (21.43%). Consolidated Edison’s better dividend yield and more balanced liquidity metrics contrast with Ameren’s weaker current and quick ratios, suggesting a marginal edge in ratio strength for Consolidated Edison.
Strategic Positioning
This section compares the strategic positioning of Consolidated Edison, Inc. and Ameren Corporation, including market position, key segments, and exposure to technological disruption:
Consolidated Edison, Inc.
- Leading regulated electric, gas, and steam utility in NYC; faces competitive pressure mainly from regulatory and operational factors.
- Key segments include electricity, oil and gas purchased, steam, and non-utility products; diversified energy delivery and services business drivers.
- Moderate exposure to technological disruption through renewable energy projects and energy infrastructure development within regulated frameworks.
Ameren Corporation
- Regulated electric and natural gas utility with regional focus in Missouri and Illinois; competitive pressure from regulation and energy mix transitions.
- Operates through electric generation, transmission, distribution, and natural gas segments; power generation includes coal, nuclear, gas, and renewables.
- Exposure to technological disruption via integration of renewables like hydroelectric, wind, solar, and methane gas in generation mix.
Consolidated Edison, Inc. vs Ameren Corporation Positioning
Consolidated Edison has a more diversified energy portfolio including steam and non-utility products, while Ameren concentrates on regulated electric and natural gas with diverse generation sources. Consolidated Edison’s broad customer base contrasts with Ameren’s regional focus, affecting scale and operational dynamics.
Which has the best competitive advantage?
Both companies exhibit very unfavorable MOAT statuses with declining ROIC trends and value destruction, indicating weak competitive advantages and challenges in sustaining profitability in their regulated utility sectors.
Stock Comparison
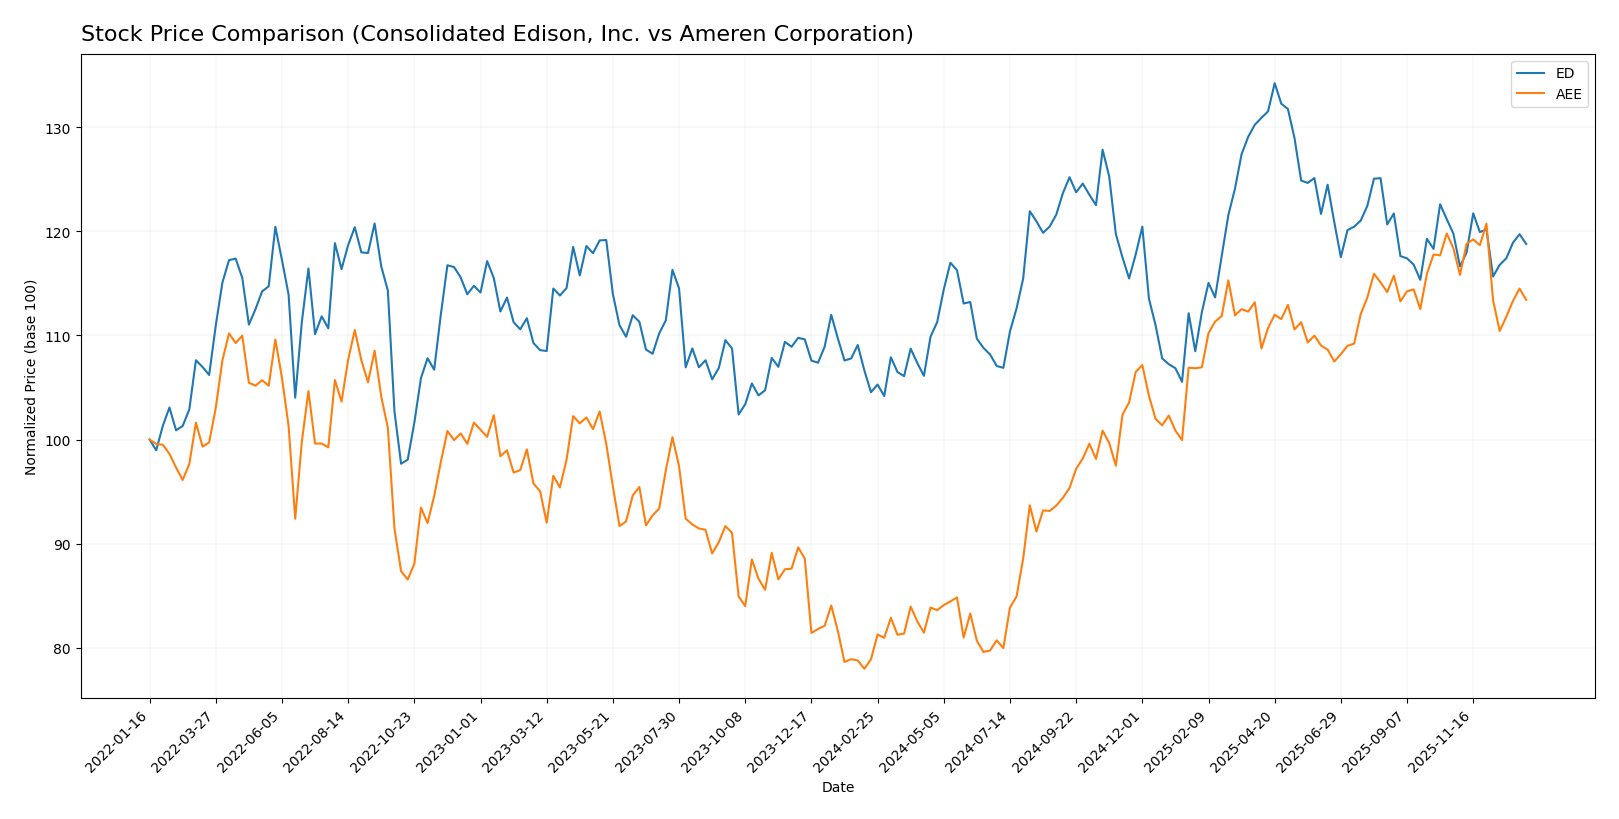
The stock price movements of Consolidated Edison, Inc. and Ameren Corporation over the past 12 months reveal notable bullish trends with decelerating momentum, contrasting recent short-term declines and varying buyer-seller dynamics.
Trend Analysis
Consolidated Edison, Inc. (ED) exhibited a bullish trend over the past year with a 13.62% price increase and decelerating growth, reaching a high of 112.1 and a low of 87.01. Recent weeks show a slight negative trend of -0.83%.
Ameren Corporation (AEE) showed a stronger bullish trend with a 43.73% gain over the same period, also decelerating. Its price ranged between 69.51 and 106.35, but recent activity indicates a sharper short-term decline of -4.19%.
Comparing both, Ameren delivered the highest market performance with a 43.73% annual increase versus Consolidated Edison’s 13.62%, despite both experiencing recent downward pressure.
Target Prices
The consensus target prices indicate moderate upside potential for both Consolidated Edison, Inc. and Ameren Corporation.
| Company | Target High | Target Low | Consensus |
|---|---|---|---|
| Consolidated Edison, Inc. | 106 | 86 | 99.86 |
| Ameren Corporation | 119 | 103 | 111.86 |
Analysts expect Ameren Corporation’s stock to outperform Consolidated Edison, with consensus targets above current prices of about 99.21 and 99.91 respectively, suggesting cautious optimism in the sector.
Analyst Opinions Comparison
This section compares analysts’ ratings and grades for Consolidated Edison, Inc. (ED) and Ameren Corporation (AEE):
Rating Comparison
ED Rating
- Rating: B-, classified as Very Favorable by analysts.
- Discounted Cash Flow Score: 1, indicating a Very Unfavorable valuation view.
- ROE Score: 3, suggesting Moderate efficiency in generating profit from equity.
- ROA Score: 3, Moderate effectiveness in asset utilization.
- Debt To Equity Score: 2, Moderate financial risk.
- Overall Score: 2, reflecting a Moderate overall financial standing.
AEE Rating
- Rating: B-, also classified as Very Favorable by analysts.
- Discounted Cash Flow Score: 1, similarly Very Unfavorable valuation view.
- ROE Score: 4, a Favorable rating showing better profit generation efficiency.
- ROA Score: 3, Moderate asset utilization, equal to ED.
- Debt To Equity Score: 2, also Moderate financial risk, matching ED.
- Overall Score: 2, indicating Moderate overall financial standing, equal to ED.
Which one is the best rated?
Both ED and AEE share the same overall rating of B- and identical overall scores of 2, indicating moderate financial standing. However, AEE has a higher ROE score of 4 compared to ED’s 3, suggesting AEE is slightly better rated in profitability efficiency.
Scores Comparison
The following table compares the Altman Z-Score and Piotroski Score of Consolidated Edison, Inc. (ED) and Ameren Corporation (AEE):
ED Scores
- Altman Z-Score: 1.19, indicating financial distress and high bankruptcy risk.
- Piotroski Score: 7, reflecting strong financial health and investment quality.
AEE Scores
- Altman Z-Score: 0.97, also in distress zone with high bankruptcy risk.
- Piotroski Score: 6, showing average financial strength and investment quality.
Which company has the best scores?
Based on the provided scores, ED has a higher Piotroski Score (7 vs. 6), indicating stronger financial health, while both companies are in the Altman Z-Score distress zone, with AEE slightly lower than ED.
Grades Comparison
Here is a detailed comparison of the latest grades assigned to Consolidated Edison, Inc. and Ameren Corporation by leading grading companies:
Consolidated Edison, Inc. Grades
The table below summarizes recent grades from recognized grading firms for Consolidated Edison, Inc.:
| Grading Company | Action | New Grade | Date |
|---|---|---|---|
| UBS | Maintain | Neutral | 2026-01-07 |
| UBS | Maintain | Neutral | 2025-12-17 |
| Keybanc | Maintain | Underweight | 2025-12-12 |
| JP Morgan | Maintain | Underweight | 2025-12-12 |
| Barclays | Maintain | Underweight | 2025-11-10 |
| Barclays | Maintain | Underweight | 2025-10-22 |
| Morgan Stanley | Maintain | Underweight | 2025-10-22 |
| Barclays | Maintain | Underweight | 2025-10-21 |
| Keybanc | Maintain | Underweight | 2025-10-15 |
| Morgan Stanley | Maintain | Underweight | 2025-09-25 |
Grades for Consolidated Edison, Inc. predominantly trend toward “Underweight” and “Neutral,” indicating cautious sentiment among analysts.
Ameren Corporation Grades
The following table shows recent grades for Ameren Corporation by reputable grading companies:
| Grading Company | Action | New Grade | Date |
|---|---|---|---|
| UBS | Maintain | Buy | 2025-12-17 |
| Keybanc | Downgrade | Sector Weight | 2025-12-12 |
| Mizuho | Maintain | Outperform | 2025-10-27 |
| Morgan Stanley | Maintain | Equal Weight | 2025-10-22 |
| Barclays | Maintain | Equal Weight | 2025-10-21 |
| Keybanc | Maintain | Overweight | 2025-10-15 |
| Morgan Stanley | Maintain | Equal Weight | 2025-09-25 |
| Keybanc | Maintain | Overweight | 2025-07-16 |
| UBS | Maintain | Buy | 2025-07-11 |
| Barclays | Maintain | Equal Weight | 2025-07-10 |
Ameren Corporation’s grades mostly lie between “Buy,” “Overweight,” and “Equal Weight,” reflecting moderately positive analyst sentiment.
Which company has the best grades?
Ameren Corporation has received generally more favorable grades than Consolidated Edison, Inc., with multiple “Buy” and “Outperform” ratings versus Consolidated Edison’s “Underweight” and “Neutral” stance. This difference may influence investors’ perception of growth potential and risk exposure between the two utilities.
Strengths and Weaknesses
Below is a comparison of key strengths and weaknesses of Consolidated Edison, Inc. (ED) and Ameren Corporation (AEE) based on recent financial and operational data.
| Criterion | Consolidated Edison, Inc. (ED) | Ameren Corporation (AEE) |
|---|---|---|
| Diversification | Moderate: Electricity (10.8B), Oil & Gas Purchased (3.1B), Steam (569M) revenue streams | Moderate: Electricity (6.5B), Natural Gas (1.1B) revenue streams |
| Profitability | Net margin 11.93% (favorable); ROIC 3.48% (unfavorable, below WACC 4.72%) | Net margin 15.51% (favorable); ROIC 3.32% (unfavorable, below WACC 5.19%) |
| Innovation | Limited data on innovation; declining ROIC trend over 2020-2024 suggests challenges | Similar declining ROIC trend; no strong innovation indicators reported |
| Global presence | Primarily US-focused utility company | Primarily US-focused utility company |
| Market Share | Strong regional utility presence with steady electricity revenue growth | Stable electricity revenue, smaller scale than ED, focused in Midwest region |
Key takeaways: Both companies show stable core electricity revenues with moderate diversification in energy products. However, both face declining returns on invested capital, indicating weakening profitability and competitive positions. Investors should be cautious and monitor efficiency improvements and capital allocation strategies closely.
Risk Analysis
Below is a comparison of key risks for Consolidated Edison, Inc. (ED) and Ameren Corporation (AEE) based on the most recent data from 2024-2026.
| Metric | Consolidated Edison, Inc. (ED) | Ameren Corporation (AEE) |
|---|---|---|
| Market Risk | Low beta (0.38) indicates lower volatility versus the market | Moderate beta (0.59) suggests moderate market sensitivity |
| Debt Level | Debt-to-equity 1.27 (unfavorable), interest coverage 2.8 (neutral) | Higher debt-to-equity 1.55 (unfavorable), interest coverage 2.92 (neutral) |
| Regulatory Risk | High, as a regulated utility in NY with evolving energy policies | High, regulated utility with exposure to multiple states and policy changes |
| Operational Risk | Extensive infrastructure (electric, gas, steam) increases maintenance risk | Diverse generation sources (coal, nuclear, gas, renewables) add complexity |
| Environmental Risk | Transition pressure to renewables; investments ongoing but legacy fossil assets remain | Reliance on coal and nuclear poses environmental and regulatory challenges |
| Geopolitical Risk | Low; primarily US-focused with stable political environment | Low; US operations but exposure to regional regulatory shifts |
Synthesis: Both utilities face significant regulatory and environmental risks due to energy transition and compliance demands. Ameren’s higher debt and lower liquidity ratios elevate its financial risk slightly more than Consolidated Edison. Market risk is moderate to low given their utility status. The most impactful risks remain regulatory shifts and environmental policy enforcement affecting operations and capital expenditures.
Which Stock to Choose?
Consolidated Edison, Inc. (ED) shows a favorable income statement with 11.93% net margin but mixed financial ratios—28.57% favorable and 35.71% unfavorable—and a very favorable B- rating. Its ROIC is below WACC, indicating value destruction.
Ameren Corporation (AEE) displays a favorable income statement with a 15.51% net margin and a less favorable ratio profile, with 21.43% favorable and 50.0% unfavorable metrics. It shares the same very favorable B- rating but also has a ROIC below WACC, signaling value destruction.
For investors focused on income statement strength, ED might appear slightly more favorable, while those prioritizing higher net margins and return on equity might see AEE as more appealing. Both companies exhibit declining ROICs and slight financial weaknesses, suggesting cautious evaluation based on risk tolerance.
Disclaimer: Investment carries a risk of loss of initial capital. The past performance is not a reliable indicator of future results. Be sure to understand risks before making an investment decision.
Go Further
I encourage you to read the complete analyses of Consolidated Edison, Inc. and Ameren Corporation to enhance your investment decisions: