Home > Comparison > Utilities > AEE vs CMS
The strategic rivalry between Ameren Corporation and CMS Energy Corporation shapes the Utilities sector’s future. Ameren operates as a multi-state regulated electric and gas utility with diversified generation assets. CMS focuses on integrated electric and gas utilities primarily in Michigan, with extensive transmission infrastructure. This analysis contrasts their operational models to identify which company offers a superior risk-adjusted return, guiding investors seeking stable, regulated utility exposure in a shifting energy landscape.
Table of contents
Companies Overview
Ameren Corporation and CMS Energy Corporation both dominate the regulated electric utility sector in the US Midwest.
Ameren Corporation: Integrated Energy Provider
Ameren operates as a public utility holding company focused on regulated electric generation, transmission, and distribution. It generates revenue primarily through rate-regulated electricity and natural gas services across Missouri and Illinois. In 2026, Ameren prioritizes expanding its renewable energy portfolio alongside traditional coal and nuclear assets to balance sustainability with reliability.
CMS Energy Corporation: Comprehensive Energy Utility
CMS Energy serves 3.7M customers in Michigan, generating revenue through electric and gas utility operations. Its diversified infrastructure includes extensive transmission and distribution networks for both electricity and natural gas. The company stresses growth in renewable independent power production while maintaining a robust base in coal, gas, and nuclear generation.
Strategic Collision: Similarities & Divergences
Both companies rely on regulated utility models with a strong emphasis on energy generation and distribution. Ameren leans into a mixed generation strategy with a focus on renewables, while CMS balances electric and gas services with a significant enterprise segment for independent power. Their primary competition lies in capturing regional market share amid evolving energy demands. Investors face distinct profiles: Ameren as a renewable transition leader and CMS as a utility with broad energy infrastructure exposure.
Income Statement Comparison
This data dissects the core profitability and scalability of both corporate engines to reveal who dominates the bottom line:
| Metric | Ameren Corporation (AEE) | CMS Energy Corporation (CMS) |
|---|---|---|
| Revenue | 7.62B | 7.52B |
| Cost of Revenue | 3.97B | 4.31B |
| Operating Expenses | 2.14B | 1.72B |
| Gross Profit | 3.65B | 3.21B |
| EBITDA | 3.54B | 3.07B |
| EBIT | 1.93B | 1.83B |
| Interest Expense | 663M | 708M |
| Net Income | 1.18B | 1.00B |
| EPS | 4.43 | 3.34 |
| Fiscal Year | 2024 | 2024 |
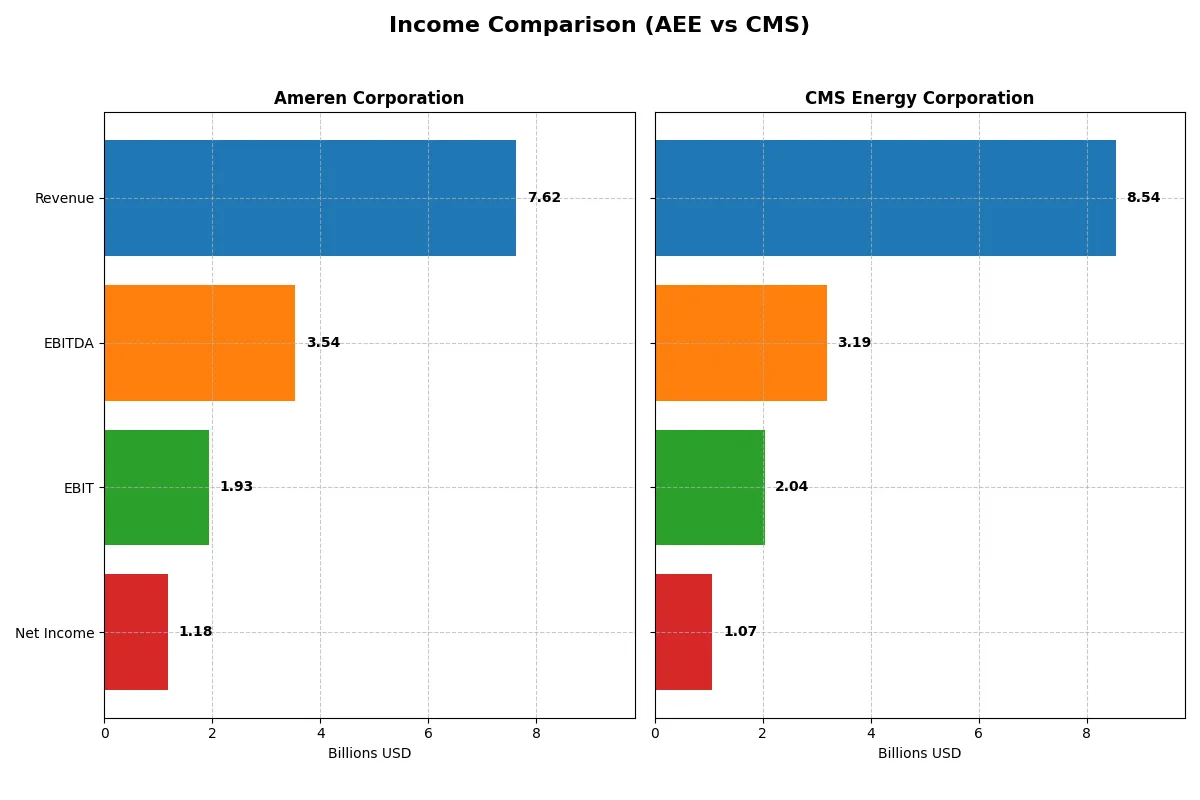
Income Statement Analysis: The Bottom-Line Duel
This income statement comparison reveals the true efficiency and profitability of two major utility companies over recent years.
Ameren Corporation Analysis
Ameren’s revenue steadily climbed from 5.8B in 2020 to 7.6B in 2024, with net income rising from 871M to 1.18B. Gross margin improved to nearly 48%, reflecting solid cost control. Its 2024 net margin of 15.5% signals strong profitability, supported by consistent EBIT growth, suggesting operational momentum and margin resilience.
CMS Energy Corporation Analysis
CMS expanded revenue from 7.3B in 2021 to 8.5B in 2025, showing robust top-line growth. Gross margin peaked at 61% in 2025, outperforming Ameren, though net margin slipped to 12.5%. Despite strong earnings growth in 2025, CMS’s net income declined overall since 2021, indicating margin compression and efficiency pressures.
Margin Strength vs. Growth Trajectory
Ameren delivers steady net income growth with improving margins, highlighting operational efficiency and earnings stability. CMS boasts superior gross margin and revenue acceleration but faces declining net income and margin erosion. For investors prioritizing consistent profitability, Ameren’s profile looks more attractive, while CMS appeals to those valuing top-line expansion despite margin risks.
Financial Ratios Comparison
These vital ratios act as a diagnostic tool to expose the underlying fiscal health, valuation premiums, and capital efficiency of the companies analyzed:
| Ratios | Ameren Corporation (AEE) | CMS Energy Corporation (CMS) |
|---|---|---|
| ROE | 9.76% | 12.01% |
| ROIC | 3.32% | 3.71% |
| P/E | 20.12 | 19.49 |
| P/B | 1.96 | 2.34 |
| Current Ratio | 0.66 | 1.34 |
| Quick Ratio | 0.44 | 1.34 |
| D/E | 1.55 | 2.12 |
| Debt-to-Assets | 42.0% | 47.3% |
| Interest Coverage | 2.29 | 2.19 |
| Asset Turnover | 0.17 | 0.21 |
| Fixed Asset Turnover | 0.21 | 0.28 |
| Payout ratio | 60.4% | 60.5% |
| Dividend yield | 3.00% | 3.10% |
| Fiscal Year | 2024 | 2025 |
Efficiency & Valuation Duel: The Vital Signs
Financial ratios act as a company’s DNA, unveiling hidden risks and operational excellence critical for investment decisions.
Ameren Corporation
Ameren shows a moderate 9.8% ROE, signaling below-average profitability versus sector leaders. Its 20.1 P/E and 1.96 P/B suggest a fairly valued stock, neither cheap nor stretched. The 3.0% dividend yield rewards shareholders consistently, reflecting a stable payout policy over aggressive reinvestment.
CMS Energy Corporation
CMS delivers a stronger 12.0% ROE and a slightly lower net margin of 12.5%, indicating efficient capital use with decent profitability. Its 19.5 P/E and 2.34 P/B ratios place it in neutral valuation territory. CMS also supports shareholders with a 3.1% dividend, balancing income and growth.
Balanced Efficiency vs. Valuation Neutrality
CMS offers a slightly better profitability profile with neutral valuation and solid dividend yield. Ameren’s lower ROE and mixed ratio signals suggest more operational challenges. CMS fits investors seeking moderate risk with steady returns; Ameren suits those prioritizing dividend stability amid operational headwinds.
Which one offers the Superior Shareholder Reward?
I compare Ameren Corporation (AEE) and CMS Energy Corporation (CMS) based on dividends and buybacks. AEE yields 3.0% with a payout ratio near 60%, but shows negative free cash flow (-6.2/share), signaling dividend coverage risk. CMS yields slightly higher at 3.1%, with a similar payout ratio (~60%) but positive free cash flow of 7.5/share, supporting sustainable dividends. Both firms maintain steady buyback programs, yet CMS’s positive free cash flow and stronger cash ratios suggest a more reliable capital return model. I conclude CMS offers a superior total shareholder return profile in 2026 due to healthier free cash flow backing and balanced capital allocation.
Comparative Score Analysis: The Strategic Profile
The radar chart reveals the core DNA and trade-offs of Ameren Corporation and CMS Energy Corporation, highlighting their financial strengths and weaknesses:
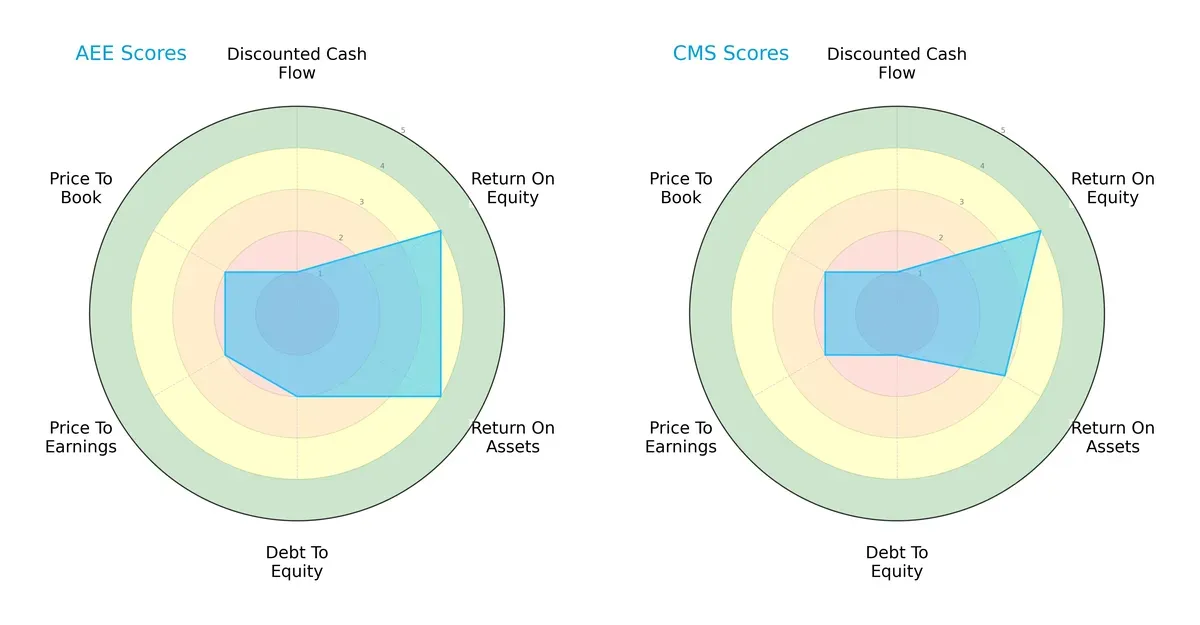
Ameren shows stronger asset efficiency (ROA 4 vs. 3) and a better equity return (ROE 4 each) but carries more financial risk (Debt/Equity 2 vs. 1). Both companies suffer from poor valuation scores (P/E and P/B at 2), indicating potential market skepticism. Ameren offers a more balanced profile, while CMS relies heavily on conservative leverage management.
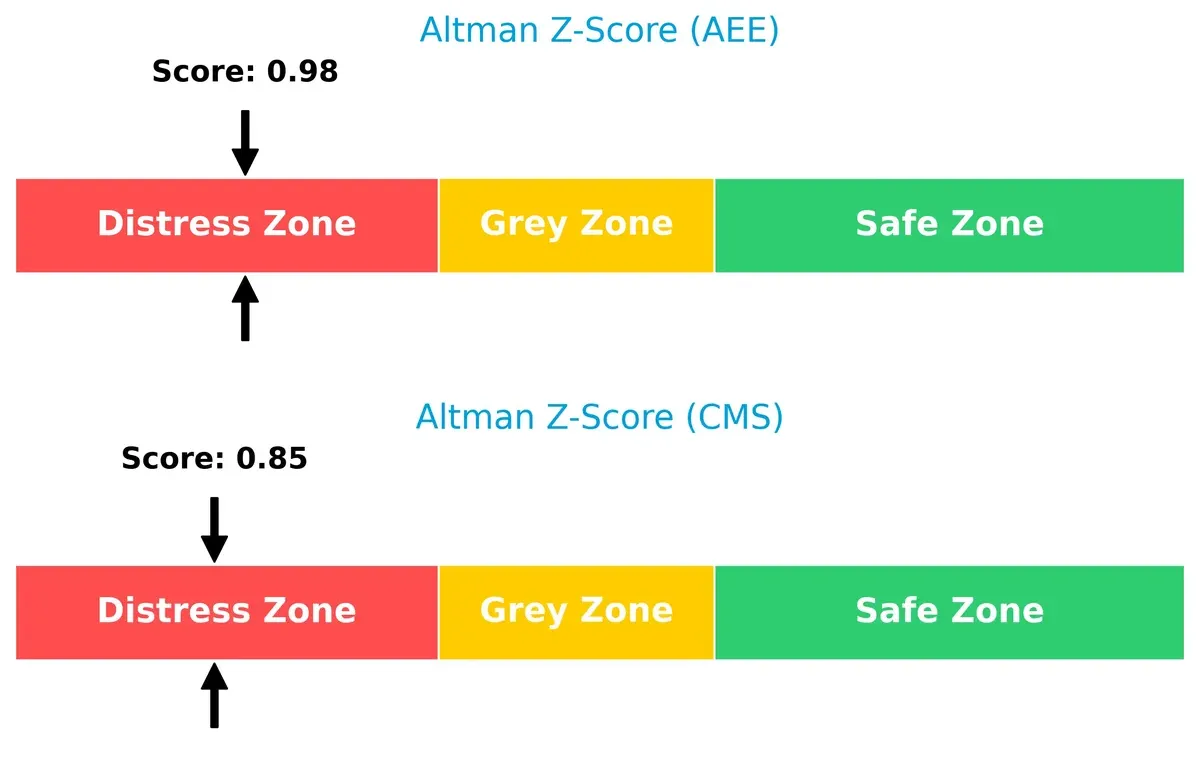
Bankruptcy Risk: Solvency Showdown
Both Ameren and CMS fall into the distress zone with Altman Z-Scores below 1.8. This signals elevated bankruptcy risk and financial fragility amid current market pressures:
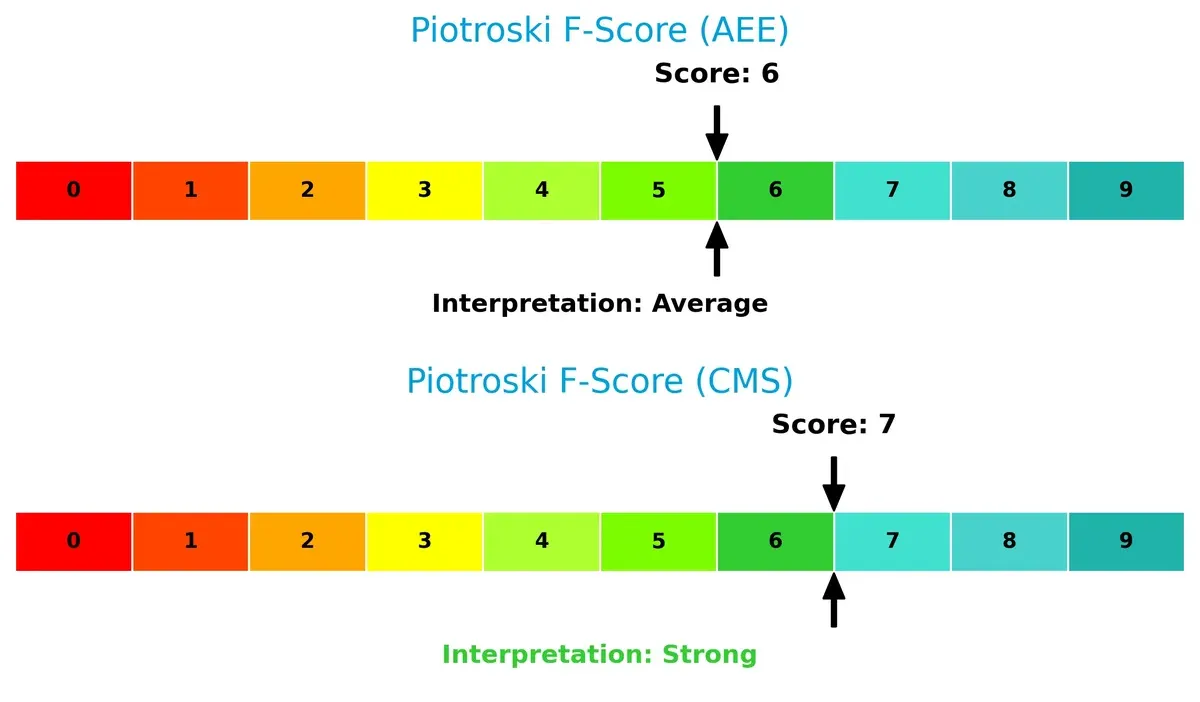
Financial Health: Quality of Operations
CMS edges Ameren in operational quality with a Piotroski F-Score of 7 versus 6. CMS exhibits stronger internal financial health, while Ameren’s average score suggests room for improvement:
How are the two companies positioned?
This section dissects Ameren and CMS’s operational DNA by comparing revenue distribution and internal dynamics. The goal is to confront their economic moats and identify which model delivers the most resilient competitive advantage today.
Revenue Segmentation: The Strategic Mix
This visual comparison dissects how Ameren Corporation and CMS Energy Corporation diversify their income streams and where their primary sector bets lie:
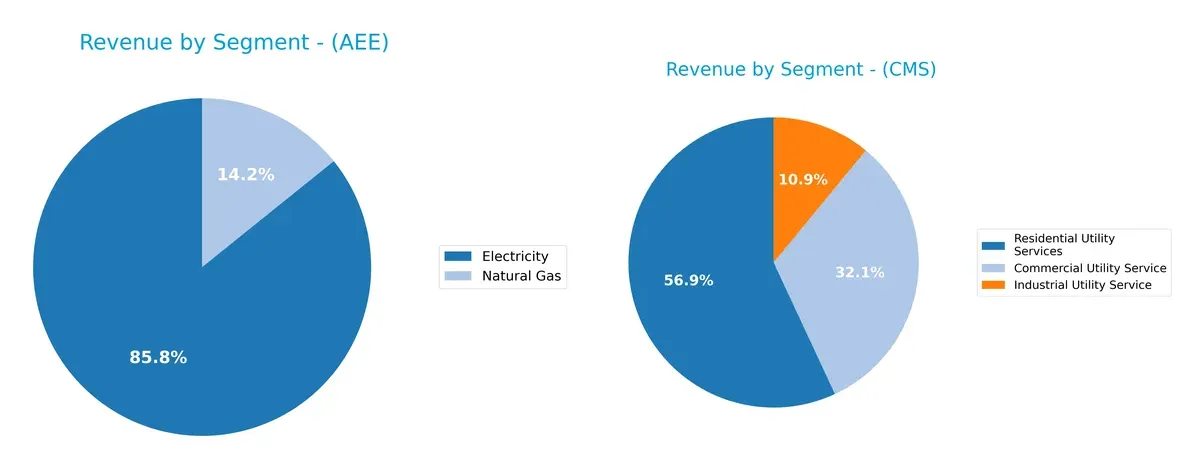
Ameren leans heavily on Electricity, generating $6.54B in 2024, with Natural Gas trailing at $1.08B. CMS shows a more balanced mix: Residential Utility Services anchor $3.75B, Commercial Utility Service adds $2.11B, and Industrial Utility Service contributes $720M. Ameren’s concentration signals infrastructure dominance but raises concentration risk. CMS’s diversified streams reduce risk and enhance resilience across consumer segments.
Strengths and Weaknesses Comparison
This table compares the strengths and weaknesses of Ameren Corporation and CMS Energy Corporation:
Ameren Corporation Strengths
- Higher net margin at 15.51%
- Favorable WACC at 5.22%
- Consistent dividend yield of 3.0%
- Strong electricity revenue around 6.5B USD
CMS Energy Corporation Strengths
- Favorable net margin at 12.54%
- Better current and quick ratios (1.34 each)
- Dividend yield slightly higher at 3.1%
- Neutral ROE at 12.01%
Ameren Corporation Weaknesses
- Unfavorable ROE at 9.76% and ROIC at 3.32%
- Low liquidity with current ratio 0.66
- High debt to equity at 1.55
- Low asset turnover at 0.17
CMS Energy Corporation Weaknesses
- Unfavorable ROIC at 3.71%
- Higher debt to equity at 2.12
- Unfavorable asset turnover at 0.21
- Neutral interest coverage at 2.58
Ameren shows strength in profitability margins and cost of capital but suffers from weak liquidity and asset efficiency. CMS maintains better liquidity and a more balanced profitability profile but carries higher leverage with modest returns on invested capital. These factors shape their financial flexibility and risk profiles.
The Moat Duel: Analyzing Competitive Defensibility
A structural moat alone shields long-term profits from relentless competitive erosion. Here’s how Ameren Corporation and CMS Energy Corporation defend their turf:
Ameren Corporation: Regulated Utility with Operational Scale
Ameren’s primary moat stems from regulatory protections and scale advantages. Its stable margins reflect efficient capital deployment despite a declining ROIC trend. Expansion into renewables in 2026 could stabilize returns.
CMS Energy Corporation: Integrated Utility with Customer Base Stickiness
CMS leverages its integrated electric and gas operations, creating switching costs and operational synergies. Though also facing a declining ROIC, CMS’s recent revenue growth signals potential for value recovery and market expansion.
Regulated Scale vs. Integration Synergies: The Moat Faceoff
Both firms suffer from value erosion as their ROICs fall below WACC, signaling shrinking moats. Ameren’s scale-driven moat remains wider, but CMS’s integration offers a deeper operational advantage. Ameren appears better positioned to defend market share amid regulatory shifts in 2026.
Which stock offers better returns?
The past 12 months show Ameren Corporation’s strong price growth contrasted with CMS Energy Corporation’s more moderate gains and recent slight decline in trading momentum.
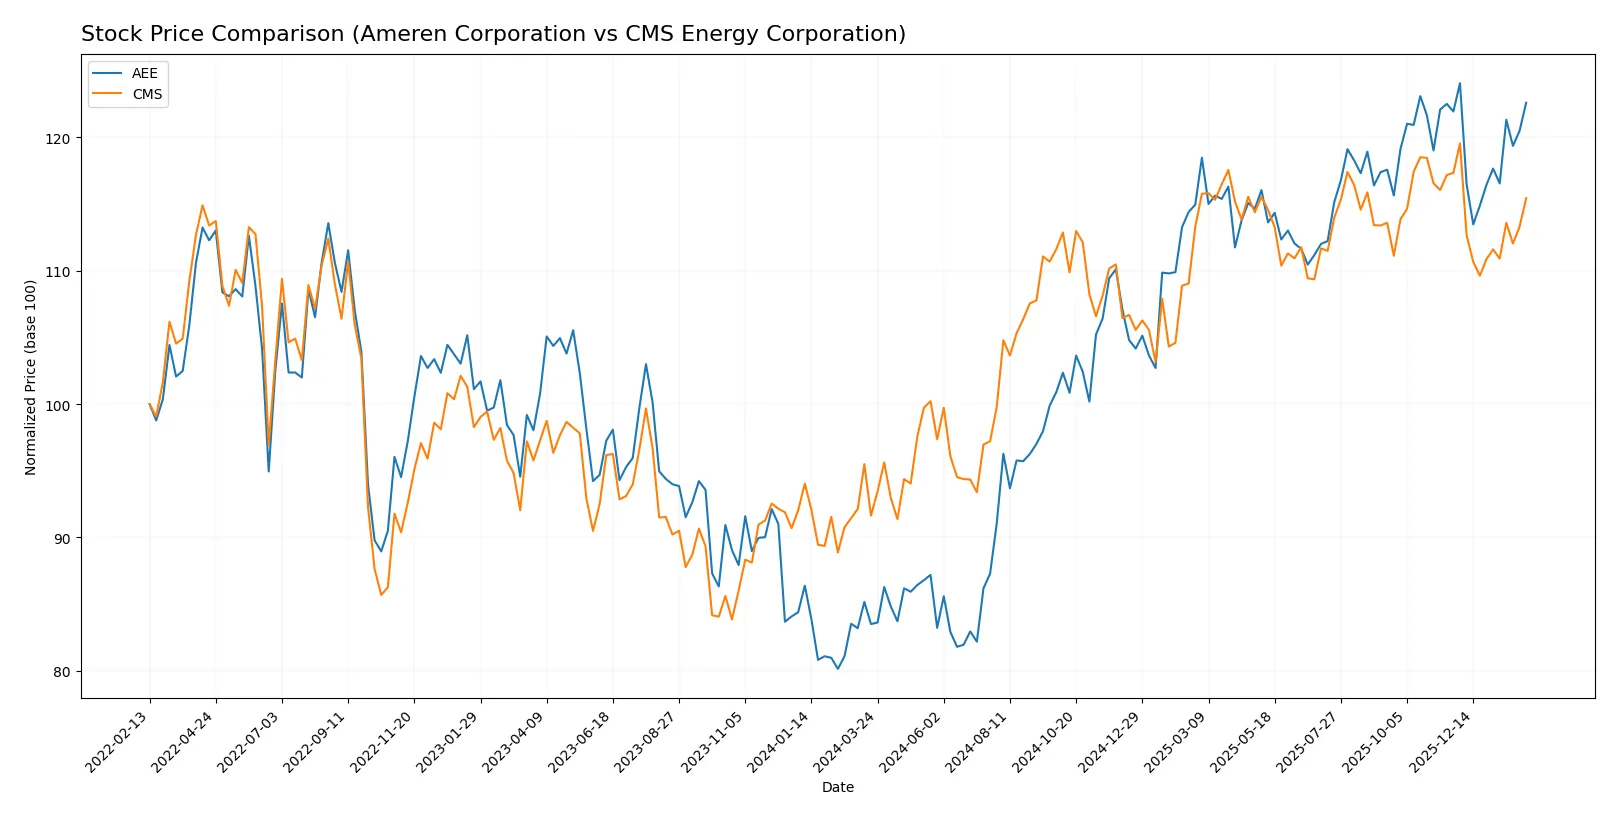
Trend Comparison
Ameren Corporation’s stock rose 46.81% over the past year, marking a bullish trend with decelerating gains. The price ranged from 70.12 to 106.35, with volatility measured by an 11.03 standard deviation.
CMS Energy Corporation’s stock gained 25.98% over the year, also bullish but with decelerating momentum. The price fluctuated between 57.66 and 75.44, showing less volatility at a 4.7 standard deviation.
Ameren outperformed CMS, delivering the highest market returns over the 12-month period despite recent slower price acceleration.
Target Prices
Analysts present a clear consensus on target prices for Ameren Corporation and CMS Energy Corporation.
| Company | Target Low | Target High | Consensus |
|---|---|---|---|
| Ameren Corporation | 104 | 116 | 111 |
| CMS Energy Corporation | 74 | 82 | 78.14 |
The target consensus for Ameren stands about 6% above its current price of 105.09, signaling modest upside. CMS’s consensus target exceeds its current 72.84 price by roughly 7%, reflecting moderate growth expectations.

Don’t Let Luck Decide Your Entry Point
Optimize your entry points with our advanced ProRealTime indicators. You’ll get efficient buy signals with precise price targets for maximum performance. Start outperforming now!
How do institutions grade them?
Here is a summary of recent institutional grades for Ameren Corporation and CMS Energy Corporation:
Ameren Corporation Grades
The following table shows the latest grades issued by major financial institutions for Ameren Corporation.
| Grading Company | Action | New Grade | Date |
|---|---|---|---|
| Wells Fargo | maintain | Overweight | 2026-01-20 |
| Barclays | maintain | Equal Weight | 2026-01-15 |
| JP Morgan | maintain | Neutral | 2026-01-15 |
| UBS | maintain | Buy | 2025-12-17 |
| Keybanc | downgrade | Sector Weight | 2025-12-12 |
| Mizuho | maintain | Outperform | 2025-10-27 |
| Morgan Stanley | maintain | Equal Weight | 2025-10-22 |
| Barclays | maintain | Equal Weight | 2025-10-21 |
| Keybanc | maintain | Overweight | 2025-10-15 |
| Morgan Stanley | maintain | Equal Weight | 2025-09-25 |
CMS Energy Corporation Grades
This table displays recent grades from reputable institutions for CMS Energy Corporation.
| Grading Company | Action | New Grade | Date |
|---|---|---|---|
| Mizuho | maintain | Neutral | 2026-02-06 |
| Morgan Stanley | maintain | Equal Weight | 2026-02-02 |
| Jefferies | maintain | Buy | 2026-01-28 |
| Wells Fargo | maintain | Equal Weight | 2026-01-20 |
| Jefferies | maintain | Buy | 2026-01-15 |
| JP Morgan | maintain | Overweight | 2026-01-15 |
| Barclays | maintain | Overweight | 2026-01-15 |
| UBS | maintain | Neutral | 2025-12-17 |
| JP Morgan | maintain | Overweight | 2025-12-11 |
| Morgan Stanley | maintain | Equal Weight | 2025-10-22 |
Which company has the best grades?
CMS Energy Corporation holds generally higher grades, including multiple Buy and Overweight ratings. Ameren Corporation’s grades are more mixed, with several Equal Weight and Neutral assessments. Investors might interpret CMS’s stronger grades as signaling greater institutional confidence.
Risks specific to each company
The following categories identify critical pressure points and systemic threats facing both firms in the 2026 market environment:
1. Market & Competition
Ameren Corporation
- Operates in regulated electric markets with moderate competition; coal and nuclear reliance adds transition risk.
CMS Energy Corporation
- Operates primarily in Michigan with diversified energy sources; faces regional competition and growing renewable demands.
2. Capital Structure & Debt
Ameren Corporation
- Debt-to-equity at 1.55 signals high leverage; interest coverage moderate at 2.92, posing moderate financial risk.
CMS Energy Corporation
- Higher leverage at 2.12 with weaker debt-to-equity score; interest coverage lower at 2.58, increasing solvency concerns.
3. Stock Volatility
Ameren Corporation
- Beta of 0.586 indicates lower volatility than market average, aligning with stable utility sector traits.
CMS Energy Corporation
- Beta of 0.481 shows even lower volatility, reflecting defensive nature but possibly lower upside potential.
4. Regulatory & Legal
Ameren Corporation
- Subject to stringent environmental and safety regulations; potential impact from carbon emission policies.
CMS Energy Corporation
- Similar regulatory exposure; Michigan-specific regulations create additional compliance complexity and risk.
5. Supply Chain & Operations
Ameren Corporation
- Operations rely on coal, nuclear, and natural gas with ongoing renewable integration; supply chain disruptions could affect generation.
CMS Energy Corporation
- Extensive electric and gas distribution network in Michigan; operational complexity raises risk in maintenance and supply reliability.
6. ESG & Climate Transition
Ameren Corporation
- Faces pressure to reduce coal use and boost renewables; ESG scores may be impacted by slow transition pace.
CMS Energy Corporation
- More diversified energy mix supports transition; stronger ESG profile but still exposed to fossil fuel legacy risks.
7. Geopolitical Exposure
Ameren Corporation
- Primarily US-focused with limited direct geopolitical risk but vulnerable to national energy policy shifts.
CMS Energy Corporation
- Concentrated in Michigan, limiting geopolitical risk yet sensitive to state-level political changes and regulatory shifts.
Which company shows a better risk-adjusted profile?
CMS Energy’s stronger liquidity ratios and slightly better ESG transition positioning reduce immediate financial risks. However, its higher leverage and weaker debt-to-equity score remain concerns. Ameren’s moderate leverage but unfavorable liquidity ratios and distress-level Altman Z-score highlight financial vulnerability. Both firms sit in distress zones, but CMS’s stronger Piotroski score and neutral overall financial rating suggest a marginally better risk-adjusted profile. Recent data shows Ameren’s current ratio at a weak 0.66, underscoring short-term liquidity challenges.
Final Verdict: Which stock to choose?
Ameren Corporation’s superpower lies in its resilient cash flow generation and steady dividend yield, appealing to investors who value income and operational stability. Its point of vigilance is a weak liquidity position, which might challenge short-term flexibility. It fits well within an income-focused or conservative growth portfolio.
CMS Energy Corporation offers a strategic moat through strong operational margins and a safer liquidity buffer, granting it a more robust short-term financial footing compared to Ameren. Its recurring revenue stream and efficient asset use make it suitable for portfolios seeking growth at a reasonable price with moderate risk.
If you prioritize stable cash flow and income generation, Ameren stands out due to its consistent dividend and operational resilience. However, if you seek a blend of margin strength and liquidity safety with moderate growth potential, CMS offers better stability and a strategic moat, despite its own challenges. Both require cautious evaluation of their declining ROIC trends.
Disclaimer: Investment carries a risk of loss of initial capital. The past performance is not a reliable indicator of future results. Be sure to understand risks before making an investment decision.
Go Further
I encourage you to read the complete analyses of Ameren Corporation and CMS Energy Corporation to enhance your investment decisions: