American Electric Power Company, Inc. (AEP) and Ameren Corporation (AEE) are two prominent players in the regulated electric utility industry, both operating in the U.S. with extensive generation, transmission, and distribution networks. Their shared focus on integrating renewable energy sources alongside traditional power generation makes them compelling subjects for comparison. In this article, I will help you determine which company offers the most attractive investment opportunity in today’s evolving energy market.
Table of contents
Companies Overview
I will begin the comparison between American Electric Power Company, Inc. (AEP) and Ameren Corporation (AEE) by providing an overview of these two companies and their main differences.
American Electric Power Company, Inc. Overview
AEP is a major electric public utility holding company headquartered in Columbus, Ohio. It operates across the United States, engaging in generation, transmission, and distribution of electricity for retail and wholesale customers. The company uses a diverse mix of energy sources including coal, natural gas, nuclear, hydro, solar, and wind, positioning itself as a vertically integrated utility with a broad market reach.
Ameren Corporation Overview
Ameren Corporation, based in St. Louis, Missouri, is a public utility holding company serving residential, commercial, and industrial customers. It operates through four segments covering electric and natural gas distribution and transmission. Ameren generates electricity primarily from coal, nuclear, natural gas, and renewables like hydroelectric, wind, and solar, focusing on rate-regulated activities in its regional markets.
Key similarities and differences
Both AEP and Ameren operate in the regulated electric utility sector in the US, focusing on generation, transmission, and distribution. They utilize a mix of fossil fuels and renewable energy sources. However, AEP is larger with a market cap of about 62.6B and a more vertically integrated structure, while Ameren is smaller at 27B and combines electric and natural gas operations. Their geographic footprints and segment structures also differ, reflecting distinct regional strategies.
Income Statement Comparison
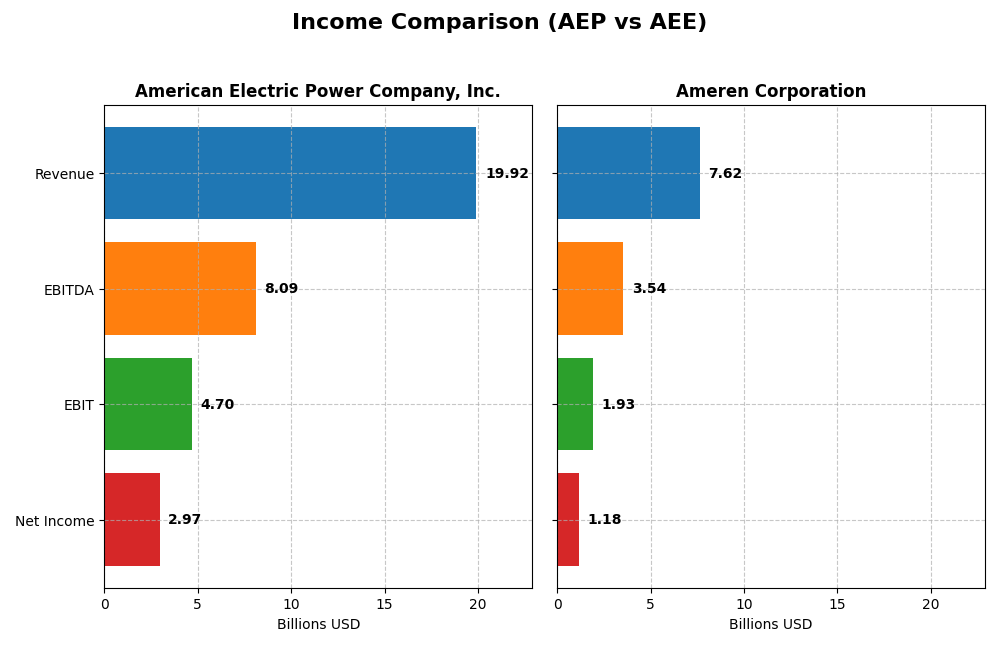
The table below presents a side-by-side comparison of key income statement metrics for American Electric Power Company, Inc. (AEP) and Ameren Corporation (AEE) for the fiscal year 2024.
| Metric | American Electric Power Company, Inc. (AEP) | Ameren Corporation (AEE) |
|---|---|---|
| Market Cap | 62.6B | 27.0B |
| Revenue | 19.9B | 7.6B |
| EBITDA | 8.1B | 3.5B |
| EBIT | 4.7B | 1.9B |
| Net Income | 3.0B | 1.2B |
| EPS | 5.60 | 4.43 |
| Fiscal Year | 2024 | 2024 |
Income Statement Interpretations
American Electric Power Company, Inc.
American Electric Power’s revenue increased from 14.9B in 2020 to 19.9B in 2024, with net income rising from 2.2B to 3.0B. Margins remained stable, with gross margin near 32% and net margin around 15%. In 2024, revenue growth slowed to 2.8%, but gross profit and net margin improved significantly, reflecting stronger operational efficiency.
Ameren Corporation
Ameren’s revenue grew from 5.8B in 2020 to 7.6B in 2024, while net income increased from 871M to 1.18B. Gross margin remained favorable at 48%, and net margin held steady at about 15.5%. The latest year showed moderate revenue growth of 1.6% and slight improvements in gross profit, though EBIT and net margin growth were neutral, indicating cautious progress.
Which one has the stronger fundamentals?
Both companies show favorable income statement fundamentals with positive revenue and net income growth over the period. American Electric Power exhibits higher margin stability and stronger growth in profitability metrics in 2024. Ameren maintains better gross margins but slower recent growth and more neutral margin expansion. Overall, AEP demonstrates more robust earnings momentum, while AEE offers steadier margin profiles.
Financial Ratios Comparison
The table below presents a side-by-side comparison of key financial ratios for American Electric Power Company, Inc. (AEP) and Ameren Corporation (AEE) for the fiscal year 2024, providing insight into their profitability, liquidity, leverage, and market valuation.
| Ratios | American Electric Power Company, Inc. (AEP) | Ameren Corporation (AEE) |
|---|---|---|
| ROE | 11.0% | 9.8% |
| ROIC | 5.0% | 3.3% |
| P/E | 16.5 | 20.1 |
| P/B | 1.81 | 1.96 |
| Current Ratio | 0.44 | 0.66 |
| Quick Ratio | 0.31 | 0.44 |
| D/E (Debt-to-Equity) | 1.70 | 1.55 |
| Debt-to-Assets | 44.4% | 42.0% |
| Interest Coverage | 2.56 | 2.29 |
| Asset Turnover | 0.19 | 0.17 |
| Fixed Asset Turnover | 0.24 | 0.21 |
| Payout Ratio | 64.2% | 60.4% |
| Dividend Yield | 3.89% | 3.00% |
Interpretation of the Ratios
American Electric Power Company, Inc.
American Electric Power shows a mixed ratio profile with a favorable net margin of 14.9% and a dividend yield of 3.89%, indicating reasonable profitability and shareholder returns. However, it faces concerns such as low current and quick ratios (0.44 and 0.31), high debt-to-equity at 1.7, and weak asset turnover, suggesting liquidity and operational efficiency challenges. The dividend appears sustainable with moderate payout risk.
Ameren Corporation
Ameren Corporation has a slightly better net margin at 15.51% but lower returns on equity (9.76%) and invested capital, which are unfavorable. The company also struggles with liquidity ratios below 1, and a debt level of 1.55 times equity, raising caution on financial leverage. Its 3.0% dividend yield is favorable, but the overall ratios indicate some operational and financial constraints.
Which one has the best ratios?
Both companies exhibit slightly unfavorable overall ratio profiles, with American Electric Power having a marginally stronger profitability and shareholder return through a higher dividend yield but weaker liquidity and asset turnover. Ameren shows a better net margin but lower return on equity and higher unfavorable ratios, making the comparison balanced with no clear superior in all financial aspects.
Strategic Positioning
This section compares the strategic positioning of American Electric Power Company, Inc. (AEP) and Ameren Corporation (AEE) regarding market position, key segments, and exposure to technological disruption:
American Electric Power Company, Inc. (AEP)
- Large market cap of 62.6B with moderate beta 0.615; faces competitive pressure in regulated electric utilities.
- Revenue diversified across vertically integrated utilities, transmission & distribution, generation and marketing segments.
- Uses a mix of coal, natural gas, nuclear, hydro, solar, and wind energy; exposed to technological shifts in renewable energies.
Ameren Corporation (AEE)
- Market cap of 27.0B with beta 0.592; competes in regulated electric and natural gas utilities.
- Revenue mainly from electricity and natural gas distribution, focusing on rate-regulated activities in Missouri and Illinois.
- Generates electricity through coal, nuclear, natural gas, and renewables like hydro, wind, and solar; also exposed to energy transition.
AEP vs AEE Positioning
AEP’s strategy is more diversified with multiple integrated segments including generation, transmission, and retail, providing broader revenue streams. AEE is more concentrated in regulated electric and natural gas distribution in specific states, which may limit geographic and segment diversification but focuses expertise regionally.
Which has the best competitive advantage?
Both companies are currently shedding value as their ROIC is below WACC; however, AEP shows improving profitability with a growing ROIC trend, whereas AEE faces declining profitability and a very unfavorable moat status.
Stock Comparison
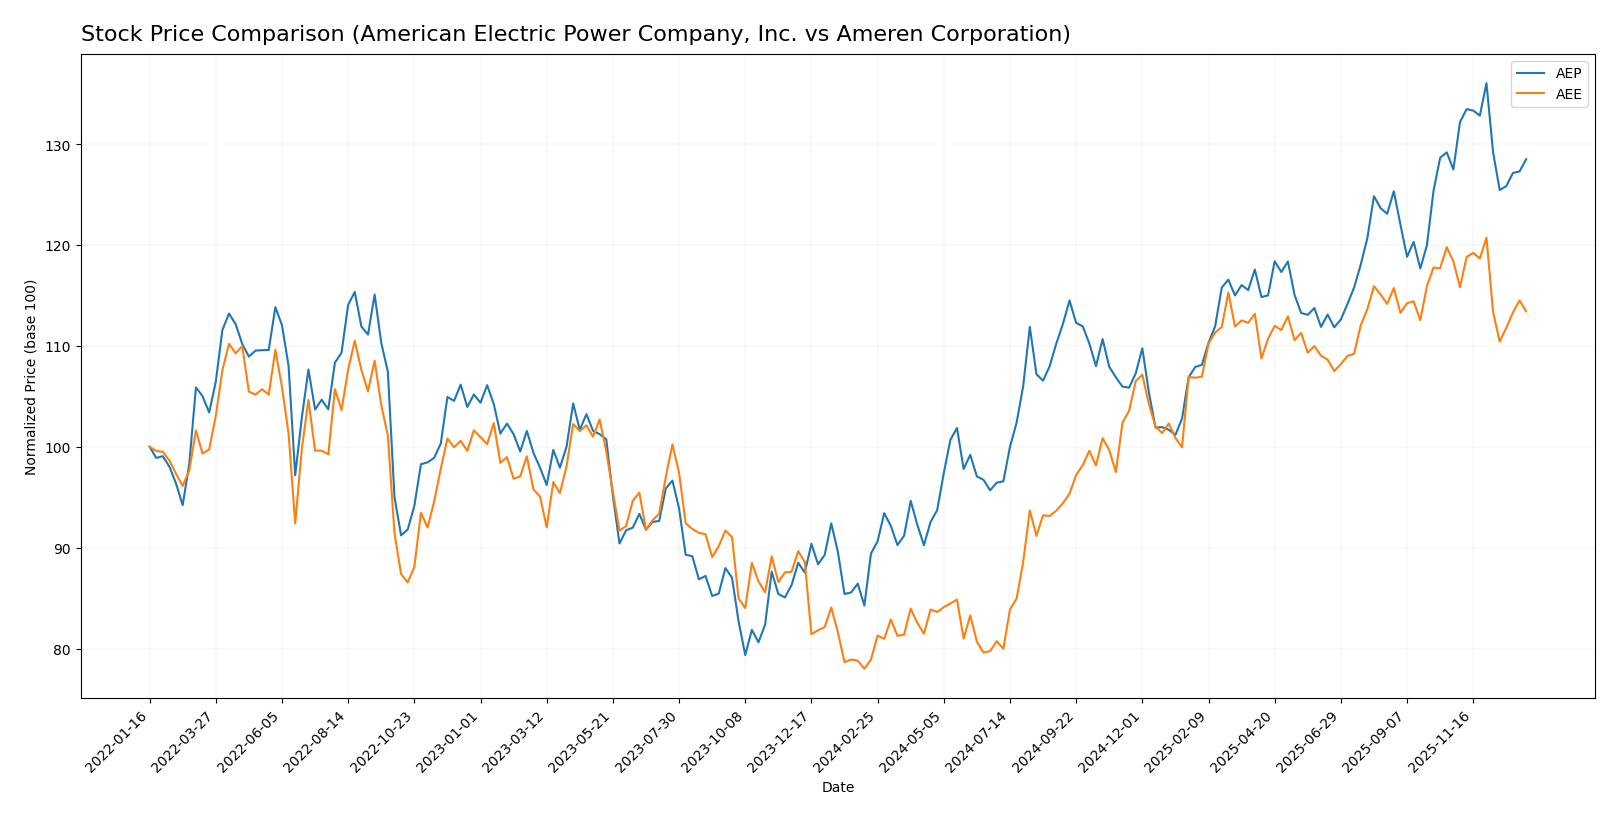
The past year has seen significant bullish trends for both American Electric Power Company, Inc. (AEP) and Ameren Corporation (AEE), with notable price appreciations and recent shifts in trading dynamics.
Trend Analysis
American Electric Power Company, Inc. (AEP) recorded a strong bullish trend over the past 12 months with a 43.71% price increase, though momentum has decelerated recently, showing a modest 0.8% rise and buyer dominance with decreasing volume.
Ameren Corporation (AEE) similarly experienced a 43.73% price increase over the past year, also with decelerating momentum, but recent performance turned bearish with a -4.19% decline and balanced buyer-seller activity.
Comparing both stocks, AEE and AEP delivered nearly identical annual gains, yet AEP’s recent stability and buyer dominance suggest a stronger short-term market performance.
Target Prices
Analysts present a cautiously optimistic consensus for American Electric Power Company, Inc. and Ameren Corporation.
| Company | Target High | Target Low | Consensus |
|---|---|---|---|
| American Electric Power Company, Inc. | 138 | 107 | 126.82 |
| Ameren Corporation | 119 | 103 | 111.86 |
The consensus target prices for both utilities exceed their current stock prices, indicating moderate upside potential in a stable sector with low volatility.
Analyst Opinions Comparison
This section compares analysts’ ratings and grades for American Electric Power Company, Inc. (AEP) and Ameren Corporation (AEE):
Rating Comparison
AEP Rating
- Rating: B+, indicating a very favorable overall assessment.
- Discounted Cash Flow Score: 4, a favorable score suggesting undervaluation.
- ROE Score: 4, favorable for efficient profit generation from equity.
- ROA Score: 4, favorable reflecting effective asset utilization.
- Debt To Equity Score: 2, moderate risk level from debt compared to equity.
- Overall Score: 3, moderate overall financial strength.
AEE Rating
- Rating: B-, also marked very favorable overall but lower than AEP.
- Discounted Cash Flow Score: 1, very unfavorable, indicating potential overvaluation.
- ROE Score: 4, equally favorable, showing strong profit generation.
- ROA Score: 3, moderate, indicating slightly less efficient asset use.
- Debt To Equity Score: 2, also moderate, similar financial risk profile.
- Overall Score: 2, moderate but lower than AEP’s overall score.
Which one is the best rated?
Based strictly on the supplied data, AEP holds a higher rating (B+) and superior scores in discounted cash flow, ROA, and overall score compared to AEE’s B- rating and lower scores. Both show equal ROE and debt-to-equity scores, but AEP is overall better rated.
Scores Comparison
Here is a comparison of the Altman Z-Score and Piotroski Score for both companies:
AEP Scores
- Altman Z-Score: 0.998, indicating financial distress zone
- Piotroski Score: 6, showing average financial strength
AEE Scores
- Altman Z-Score: 0.974, indicating financial distress zone
- Piotroski Score: 6, showing average financial strength
Which company has the best scores?
Both AEP and AEE are in the distress zone based on their Altman Z-Scores, indicating higher bankruptcy risk. Their Piotroski Scores are identical at 6, reflecting average financial strength for both companies.
Grades Comparison
Here is the grades comparison for American Electric Power Company, Inc. and Ameren Corporation:
American Electric Power Company, Inc. Grades
The table below shows recent grades assigned by major grading companies for AEP:
| Grading Company | Action | New Grade | Date |
|---|---|---|---|
| UBS | Maintain | Sell | 2025-12-17 |
| JP Morgan | Maintain | Neutral | 2025-12-12 |
| Jefferies | Upgrade | Buy | 2025-11-17 |
| Citigroup | Maintain | Neutral | 2025-10-31 |
| Wells Fargo | Maintain | Overweight | 2025-10-30 |
| Evercore ISI Group | Maintain | Outperform | 2025-10-30 |
| Morgan Stanley | Maintain | Overweight | 2025-10-30 |
| Mizuho | Maintain | Neutral | 2025-10-30 |
| BMO Capital | Downgrade | Market Perform | 2025-10-30 |
| Scotiabank | Maintain | Sector Perform | 2025-10-30 |
American Electric Power Company, Inc. shows a mixed trend with several neutral and overweight/outperform grades, alongside some downgrades and a sell rating from UBS.
Ameren Corporation Grades
The table below shows recent grades assigned by major grading companies for AEE:
| Grading Company | Action | New Grade | Date |
|---|---|---|---|
| UBS | Maintain | Buy | 2025-12-17 |
| Keybanc | Downgrade | Sector Weight | 2025-12-12 |
| Mizuho | Maintain | Outperform | 2025-10-27 |
| Morgan Stanley | Maintain | Equal Weight | 2025-10-22 |
| Barclays | Maintain | Equal Weight | 2025-10-21 |
| Keybanc | Maintain | Overweight | 2025-10-15 |
| Morgan Stanley | Maintain | Equal Weight | 2025-09-25 |
| Keybanc | Maintain | Overweight | 2025-07-16 |
| UBS | Maintain | Buy | 2025-07-11 |
| Barclays | Maintain | Equal Weight | 2025-07-10 |
Ameren Corporation’s grades generally range from equal weight to buy and outperform, with a recent downgrade to sector weight by Keybanc.
Which company has the best grades?
American Electric Power Company, Inc. has a consensus “Buy” rating with more buy recommendations but also some sell and neutral grades, while Ameren Corporation holds a consensus “Hold” with primarily equal weight and buy ratings. This suggests AEP might be viewed with slightly higher confidence, potentially impacting investor sentiment and portfolio decisions accordingly.
Strengths and Weaknesses
Below is a comparative table summarizing the key strengths and weaknesses of American Electric Power Company, Inc. (AEP) and Ameren Corporation (AEE) based on their recent financial and operational data:
| Criterion | American Electric Power Company, Inc. (AEP) | Ameren Corporation (AEE) |
|---|---|---|
| Diversification | Moderate diversification across generation, transmission, and distribution segments, with a strong focus on vertically integrated utilities. | Primarily focused on electricity and natural gas, less diversified product mix. |
| Profitability | Net margin at 14.9% (favorable), ROIC at 4.96% (unfavorable compared to WACC), showing growing profitability but currently destroying value. | Net margin at 15.5% (favorable), ROIC at 3.32% (unfavorable and declining), indicating value destruction with decreasing profitability. |
| Innovation | Gradual growth in ROIC suggests improving operational efficiencies; moderate asset turnover ratios indicate room for innovation in asset management. | Declining ROIC and unfavorable asset turnover ratios highlight challenges in operational innovation and efficiency. |
| Global presence | Primarily US-based with a focus on regional utility markets; limited global footprint. | Similar regional focus within the US, limited international presence. |
| Market Share | Strong presence in transmission and distribution with revenues over $5.8B in this segment; solid market position in vertically integrated utilities. | Dominant in electricity with $6.54B revenue and natural gas with $1.08B, strong regional market share in these utilities. |
Key takeaways: Both companies operate with regional utility dominance but face challenges in value creation, as indicated by ROIC trends below WACC. AEP shows some improvement in profitability, while AEE’s profitability declines. Diversification and innovation are moderate, with limited global exposure. Investors should weigh these factors carefully, considering the slightly unfavorable financial health and value destruction risks.
Risk Analysis
Below is a comparison table outlining key risks for American Electric Power Company, Inc. (AEP) and Ameren Corporation (AEE) as of 2026:
| Metric | American Electric Power (AEP) | Ameren Corporation (AEE) |
|---|---|---|
| Market Risk | Moderate (Beta 0.615) | Moderate (Beta 0.592) |
| Debt level | High (Debt/Equity 1.7, interest coverage 2.53) | High (Debt/Equity 1.55, interest coverage 2.92) |
| Regulatory Risk | Elevated due to energy sector regulations | Elevated, with regional rate regulation impacts |
| Operational Risk | Risks in generation mix with coal and nuclear | Similar risks; reliance on coal and nuclear |
| Environmental Risk | Medium, transitioning to renewables but coal-heavy | Medium, gradual renewable integration ongoing |
| Geopolitical Risk | Low, US domestic operations | Low, US domestic operations |
Both utilities face significant debt and operational risks tied to their energy generation mix dominated by coal and nuclear power. Regulatory pressures to reduce emissions and increase renewable capacity add environmental and compliance risk. Market risk is moderate, consistent with the sector’s beta below 1. Their Altman Z-scores place them in the distress zone, indicating financial vulnerability, while Piotroski scores suggest average financial health. Investors should weigh these risks carefully, especially the debt burden and regulatory environment.
Which Stock to Choose?
American Electric Power Company, Inc. (AEP) shows favorable income statement metrics with 71% favorable indicators, including strong net margin growth and stable profitability. The financial ratios are slightly unfavorable, with a debt-to-equity ratio of 1.7 and a current ratio of 0.44. Its return on equity is neutral at 11%, and the company is rated B+ (Very Favorable). The MOAT analysis signals slight value destruction despite a growing ROIC trend.
Ameren Corporation (AEE) also presents a favorable income statement with 50% favorable indicators but slower growth rates. Financial ratios are slightly more unfavorable than AEP, featuring a debt-to-equity of 1.55, a current ratio of 0.66, and a lower return on equity at 9.8%. The firm holds a B- rating (Very Favorable). MOAT evaluation reveals significant value destruction with a declining ROIC over the period.
For investors, AEP might appear more attractive for those focused on improving profitability and growth potential, given its stronger income growth and higher rating. Conversely, AEE could be more suited to those with a preference for companies with stable, though less dynamic, financial metrics despite a less favorable MOAT profile. The choice may depend on the investor’s tolerance for value erosion and emphasis on growth versus stability.
Disclaimer: Investment carries a risk of loss of initial capital. The past performance is not a reliable indicator of future results. Be sure to understand risks before making an investment decision.
Go Further
I encourage you to read the complete analyses of American Electric Power Company, Inc. and Ameren Corporation to enhance your investment decisions: