Home > Comparison > Consumer Cyclical > SW vs AMCR
The strategic rivalry between Smurfit Westrock Plc and Amcor plc defines the current trajectory of the global packaging sector. Smurfit Westrock operates as a capital-intensive manufacturer specializing in paper-based packaging, while Amcor focuses on diversified flexible and rigid packaging solutions with a strong direct sales model. This face-off highlights a contrast between scale-driven production and innovation-led flexibility. This analysis will determine which corporate approach offers superior risk-adjusted returns for diversified portfolios.
Table of contents
Companies Overview
Smurfit Westrock Plc and Amcor plc stand as significant players in global packaging, shaping industry standards and innovation.
Smurfit Westrock Plc: Global Paper-Based Packaging Leader
Smurfit Westrock Plc dominates in paper-based packaging, producing containerboard, corrugated containers, and diverse paper products. Its revenue stems from manufacturing and distributing packaging solutions primarily to food, e-commerce, and retail sectors. In 2026, the company emphasizes expanding sustainable packaging and recycling capabilities to meet rising environmental regulations and customer demand.
Amcor plc: Versatile Packaging Innovator
Amcor plc excels in both flexible and rigid packaging, serving food, beverage, pharmaceutical, and personal care markets worldwide. It generates revenue by producing film packaging and rigid containers, backed by an extensive direct sales force. The firm’s strategic focus in 2026 centers on advancing flexible packaging technologies and broadening its global footprint to capture emerging market opportunities.
Strategic Collision: Similarities & Divergences
Both firms compete fiercely in packaging but adopt contrasting philosophies. Smurfit Westrock prioritizes a paper-based, sustainable portfolio, while Amcor pursues a diversified approach combining flexible and rigid plastics. Their battleground lies in meeting evolving consumer preferences for eco-friendly and functional packaging. This divergence creates distinct risk-reward profiles reflecting their differing exposure to raw materials and innovation cycles.
Income Statement Comparison
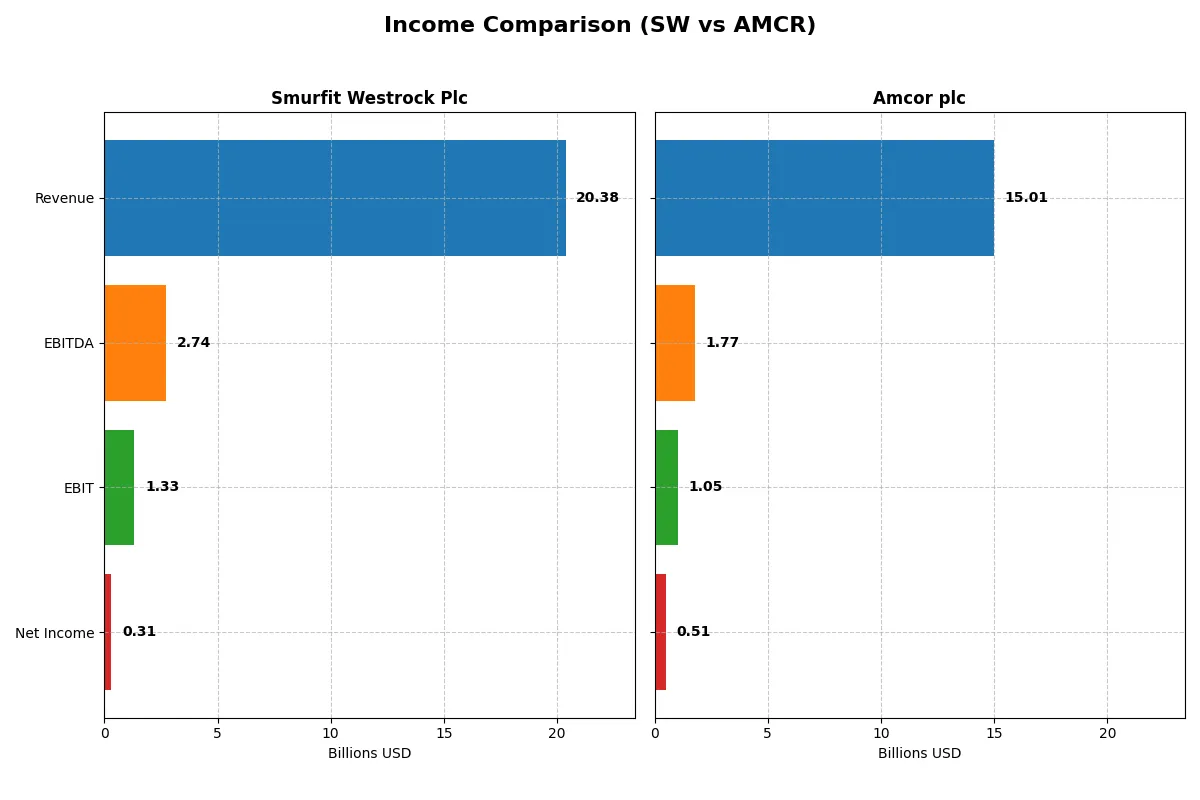
The following data dissects the core profitability and scalability of both corporate engines to reveal who dominates the bottom line:
| Metric | Smurfit Westrock Plc (SW) | Amcor plc (AMCR) |
|---|---|---|
| Revenue | 20.4B | 15.0B |
| Cost of Revenue | 16.3B | 12.2B |
| Operating Expenses | 3.1B | 1.8B |
| Gross Profit | 4.0B | 2.8B |
| EBITDA | 2.7B | 1.8B |
| EBIT | 1.3B | 1.0B |
| Interest Expense | 507M | 396M |
| Net Income | 308M | 510M |
| EPS | 0.8 | 1.6 |
| Fiscal Year | 2024 | 2025 |
Income Statement Analysis: The Bottom-Line Duel
This income statement comparison reveals which company drives profitability and operational efficiency more effectively in a competitive landscape.
Smurfit Westrock Plc Analysis
Smurfit Westrock’s revenue surged 86% in 2024 to $20.4B, yet net income plunged 78% to $308M, signaling severe margin pressure. Its gross margin held steady near 20%, but net margin contracted sharply to 1.5%. The company’s rising operating expenses eroded earnings despite revenue growth, reflecting strained cost control.
Amcor plc Analysis
Amcor grew revenues 10% in 2025 to $15B while net income declined 36% to $511M, showing weaker bottom-line momentum. Gross margin hovered near 19%, with a slightly higher net margin of 3.4%. Operating income dipped 17%, indicating efficiency challenges amid modest top-line gains and rising expenses.
Margin Resilience vs. Revenue Expansion
Smurfit Westrock demonstrates stronger revenue growth but suffers a drastic net income fall, while Amcor shows modest revenue gains paired with a less volatile profit decline. Amcor’s higher net margin and steadier operating income suggest better earnings quality. Investors favoring stable profitability may find Amcor’s profile more attractive despite slower top-line growth.
Financial Ratios Comparison
These vital ratios act as a diagnostic tool to expose the underlying fiscal health, valuation premiums, and capital efficiency of the companies compared below:
| Ratios | Smurfit Westrock Plc (SW) | Amcor plc (AMCR) |
|---|---|---|
| ROE | 1.77% | 4.36% |
| ROIC | 1.48% | 2.64% |
| P/E | 67.5 | 28.6 |
| P/B | 1.20 | 1.25 |
| Current Ratio | 1.37 | 1.21 |
| Quick Ratio | 0.89 | 0.71 |
| D/E | 0.78 | 1.28 |
| Debt-to-Assets | 31.1% | 40.5% |
| Interest Coverage | 1.92 | 2.55 |
| Asset Turnover | 0.47 | 0.40 |
| Fixed Asset Turnover | 0.90 | 1.61 |
| Payout ratio | 211% | 165% |
| Dividend yield | 3.13% | 5.79% |
| Fiscal Year | 2024 | 2025 |
Efficiency & Valuation Duel: The Vital Signs
Ratios act as a company’s DNA, revealing hidden risks and operational excellence critical for investors’ decision-making.
Smurfit Westrock Plc
Smurfit Westrock shows weak profitability with ROE at 1.77% and net margin at 1.51%, signaling operational struggles. Its P/E ratio of 67.5 suggests the stock is expensive despite a reasonable P/B of 1.2. The company rewards shareholders with a 3.13% dividend yield, balancing reinvestment with income distribution amid tepid returns.
Amcor plc
Amcor delivers modest profitability, with a 4.36% ROE and 3.4% net margin indicating limited efficiency. Its P/E of 28.6 is more reasonable but still elevated. The firm’s dividend yield stands at 5.79%, reflecting a shareholder-friendly stance despite a higher debt-to-equity ratio of 1.28, which adds leverage risk to its capital structure.
Valuation Pressure vs. Profitability Struggles
Both companies present slightly unfavorable ratio profiles, but Amcor offers a better balance with a lower P/E and higher dividend yield. Smurfit Westrock’s higher valuation multiple and weaker profitability increase risk. Investors seeking income and moderate risk may prefer Amcor’s profile, while those favoring dividend stability should weigh Smurfit Westrock carefully.
Which one offers the Superior Shareholder Reward?
I compare Smurfit Westrock Plc (SW) and Amcor plc (AMCR) focusing on dividends, payout ratios, and buybacks. SW yields 3.13% with a payout ratio over 210%, signaling unsustainable dividends likely funded by debt. AMCR offers a higher 5.79% yield with a payout ratio around 165%, also aggressive but backed by stronger free cash flow coverage near 58%. SW’s buyback activity appears minimal given its free cash flow near zero, while AMCR sustains buybacks with FCF per share at 2.5 and capex at 1.8. Historically, I’ve observed that AMCR’s balanced reinvestment and distribution strategy supports long-term value better. I conclude AMCR delivers a more attractive total return profile for investors in 2026.
Comparative Score Analysis: The Strategic Profile
The radar chart reveals the fundamental DNA and trade-offs of Smurfit Westrock Plc and Amcor plc, highlighting their core financial strengths and vulnerabilities:

Smurfit Westrock scores higher in discounted cash flow (5 vs. 4) and price-to-book (3 vs. 4), indicating a strong valuation edge. Amcor shows a weaker debt-to-equity score (1 vs. 2), signaling higher financial risk. Both share moderate returns on equity and assets. Smurfit Westrock presents a more balanced profile, while Amcor leans on valuation multiples but carries heavier leverage.
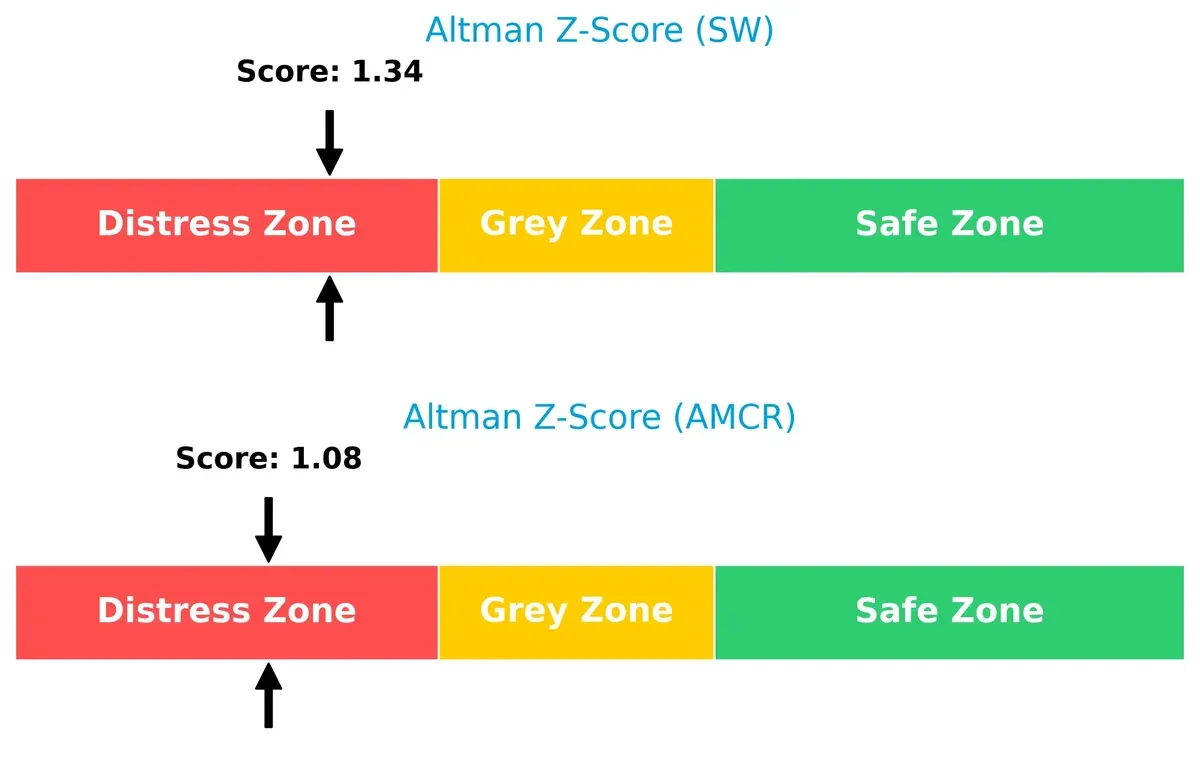
Bankruptcy Risk: Solvency Showdown
Smurfit Westrock’s Altman Z-Score (1.34) slightly outperforms Amcor’s (1.08); both fall in the distress zone, implying elevated bankruptcy risk amid current market conditions:
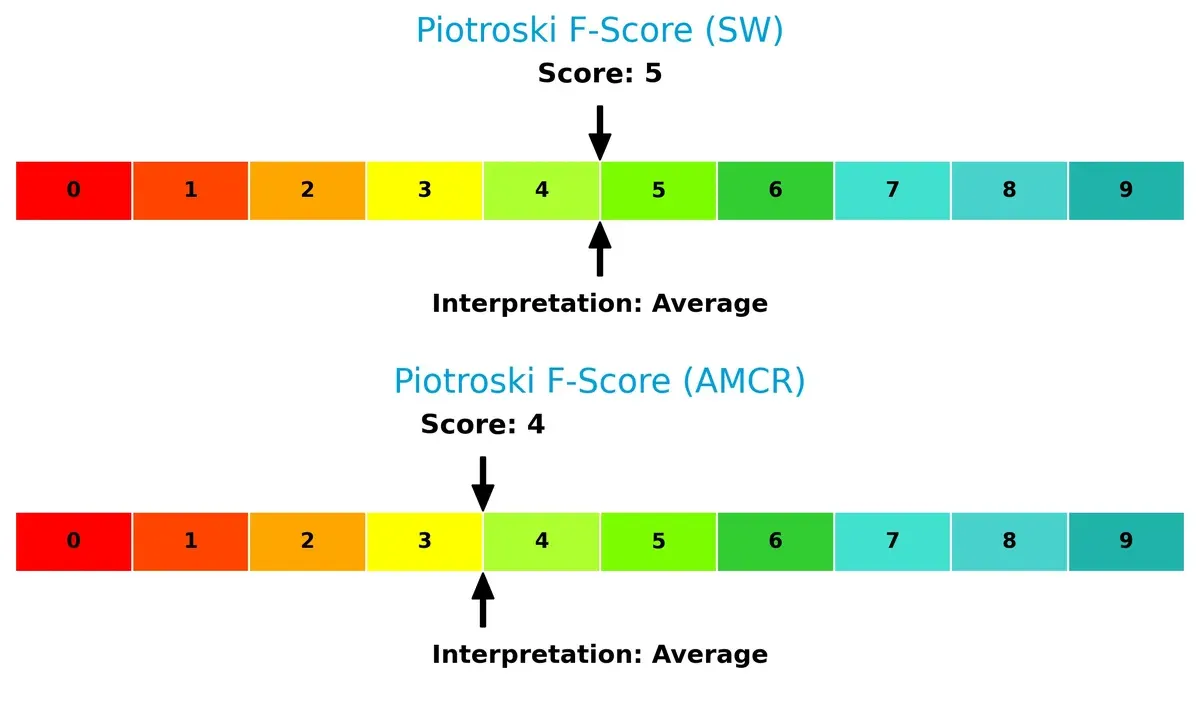
Financial Health: Quality of Operations
Smurfit Westrock edges Amcor in Piotroski F-Score (5 vs. 4), reflecting marginally stronger internal financial health. Neither firm signals peak stability; investors should watch for operational red flags:
How are the two companies positioned?
This section dissects the operational DNA of Smurfit Westrock and Amcor by comparing their revenue distribution and internal strengths and weaknesses. The goal is to confront their economic moats to determine which model offers the most resilient competitive advantage today.
Revenue Segmentation: The Strategic Mix
This visual comparison dissects how Smurfit Westrock Plc and Amcor plc diversify income streams and where their primary sector bets lie:
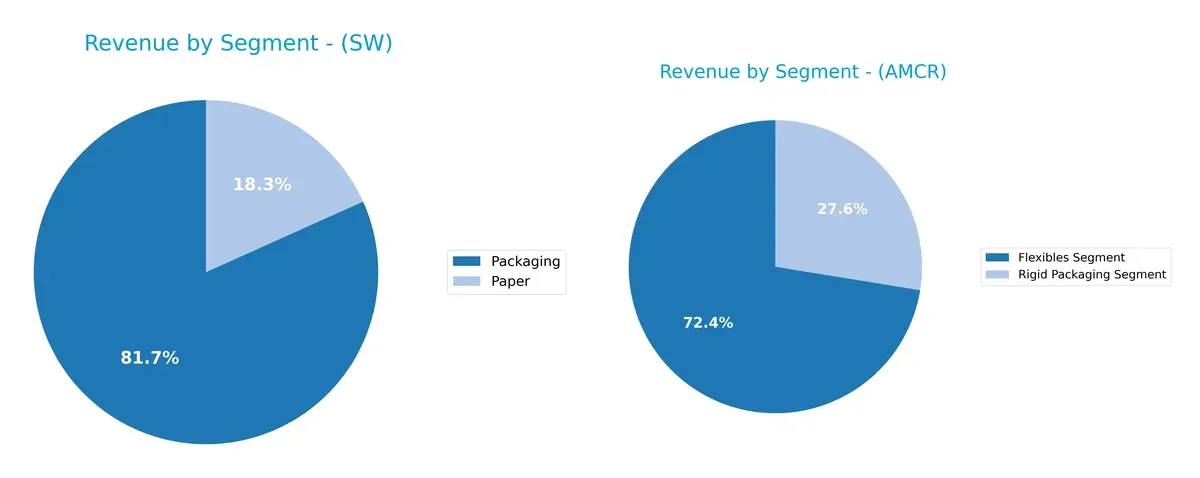
Smurfit Westrock anchors its revenues heavily in Packaging at €17.25B, with Paper trailing at €3.86B, showing moderate diversification. Amcor pivots more evenly between its Flexibles Segment at $10.87B and Rigid Packaging at $4.14B. Smurfit’s reliance on packaging signals infrastructure dominance but risks exposure to packaging market swings. Amcor’s more balanced split reduces concentration risk and supports ecosystem flexibility in packaging solutions.
Strengths and Weaknesses Comparison
This table compares the strengths and weaknesses of Smurfit Westrock Plc and Amcor plc:
Smurfit Westrock Plc Strengths
- Diverse product lines in Packaging and Paper
- Strong global presence including US and Europe
- Favorable WACC and dividend yield
- Moderate debt levels
Amcor plc Strengths
- Large flexible and rigid packaging segments
- Broad geographic reach across North America, Europe, Asia Pacific
- Favorable WACC and PB ratio
- Higher dividend yield than SW
Smurfit Westrock Plc Weaknesses
- Low profitability metrics (net margin, ROE, ROIC)
- High P/E ratio indicates overvaluation
- Unfavorable asset turnover ratios
- Neutral liquidity ratios
Amcor plc Weaknesses
- Low profitability ratios despite scale
- Unfavorable quick ratio and higher leverage (D/E)
- Elevated P/E ratio
- Unfavorable asset turnover
Both companies show slightly unfavorable profitability ratios despite solid global footprints. SW’s moderate leverage contrasts with AMCR’s higher debt burden, affecting financial flexibility. Their product diversification supports resilience but calls for operational improvement to boost returns.
The Moat Duel: Analyzing Competitive Defensibility
A structural moat is the only true protection for long-term profits against relentless competitive erosion. Let’s dissect the moat dynamics of two packaging giants:
Smurfit Westrock Plc: Intangible Assets and Scale Advantage
Smurfit Westrock leverages extensive paper-based packaging expertise and scale, reflected in stable margins despite fierce competition. However, its declining ROIC signals rising pressure on profitability in 2026.
Amcor plc: Diversified Product Portfolio and Geographic Reach
Amcor’s moat stems from product diversity and global footprint, supporting moderate margin resilience. Yet, falling ROIC and margin contraction indicate challenges sustaining returns amid market disruptions.
Verdict: Scale and Diversification Under Siege
Both firms exhibit deteriorating ROIC, signaling shrinking economic moats. Smurfit Westrock’s scale advantage faces margin pressure, while Amcor’s geographic and product diversity yield only a slightly wider moat. Neither currently defends market share robustly.
Which stock offers better returns?
The past year saw Smurfit Westrock Plc and Amcor plc both experience bearish trends, with notable price fluctuations and accelerating declines marking their trading dynamics.
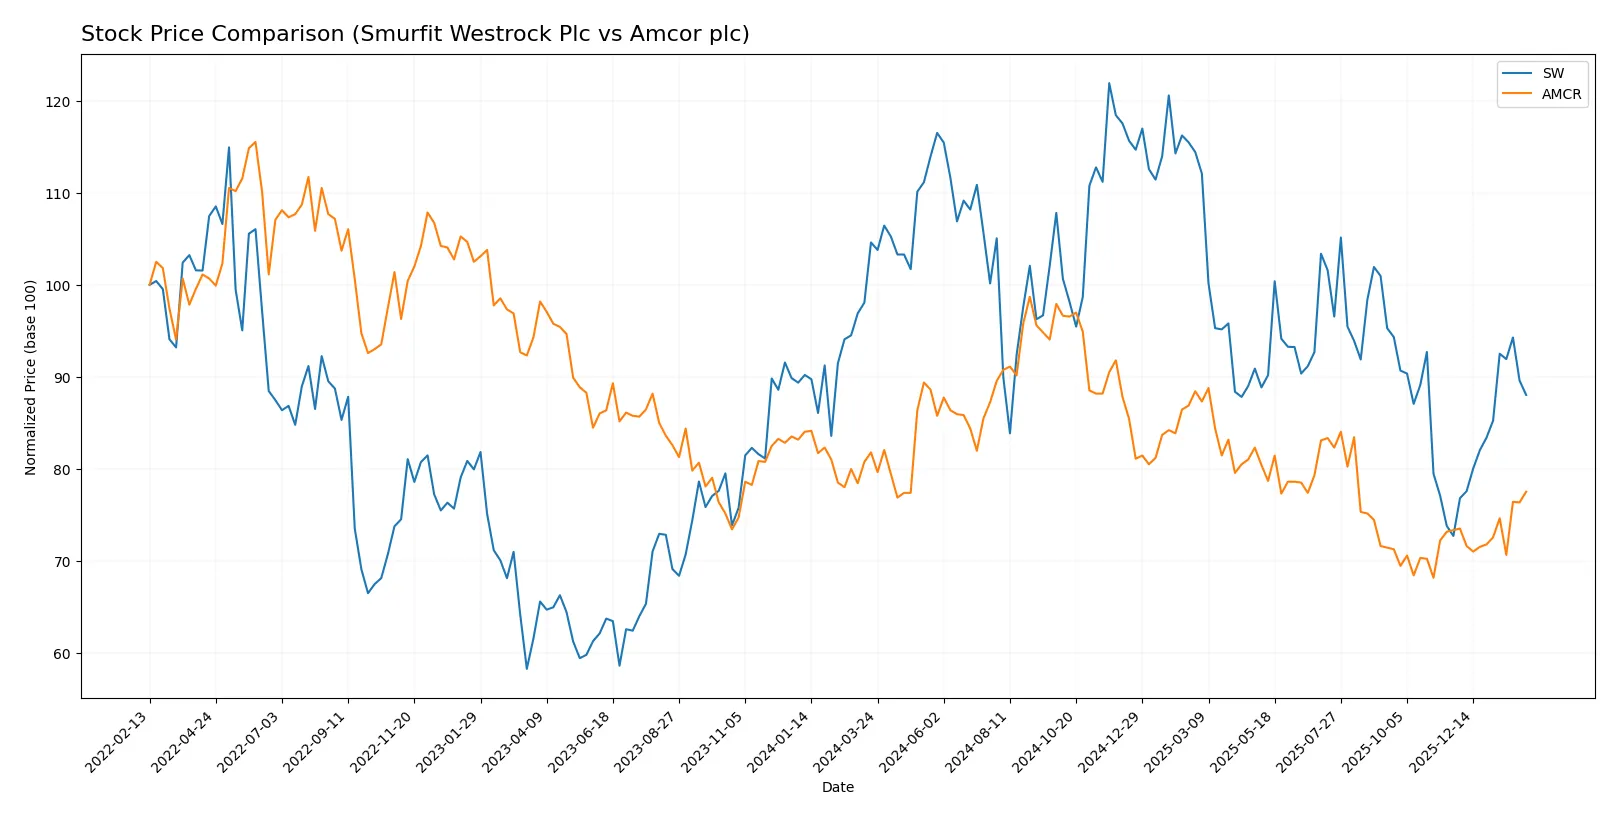
Trend Comparison
Smurfit Westrock Plc’s stock fell 15.84% over the past 12 months, showing an accelerating bearish trend with a high volatility of 5.35 and a recent rebound of 21.08%. Amcor plc’s stock declined 5.23% in the same period, also bearish but less volatile at 4.43, with a modest recent recovery of 5.69%. Smurfit Westrock Plc delivered a larger overall decline but a stronger recent price recovery than Amcor plc, indicating more pronounced market swings.
Target Prices
Analysts present a mixed but insightful target consensus for Smurfit Westrock Plc and Amcor plc.
| Company | Target Low | Target High | Consensus |
|---|---|---|---|
| Smurfit Westrock Plc | 45 | 60 | 51 |
| Amcor plc | 9 | 46 | 17.28 |
Smurfit Westrock’s target consensus at $51 suggests upside from its $40.9 price, indicating growth expectations. Amcor’s consensus of $17.28, well below its $44.92 price, signals analyst caution and potential downside risk.

Don’t Let Luck Decide Your Entry Point
Optimize your entry points with our advanced ProRealTime indicators. You’ll get efficient buy signals with precise price targets for maximum performance. Start outperforming now!
How do institutions grade them?
Here is a summary of recent institutional grades for Smurfit Westrock Plc and Amcor plc:
Smurfit Westrock Plc Grades
The table below shows recent grades from major firms for Smurfit Westrock Plc.
| Grading Company | Action | New Grade | Date |
|---|---|---|---|
| Wells Fargo | Maintain | Overweight | 2026-01-06 |
| Truist Securities | Maintain | Buy | 2026-01-06 |
| Citigroup | Maintain | Buy | 2026-01-06 |
| Argus Research | Maintain | Buy | 2025-12-09 |
| Barclays | Maintain | Overweight | 2025-11-10 |
| Wells Fargo | Maintain | Overweight | 2025-10-30 |
| RBC Capital | Maintain | Outperform | 2025-10-30 |
| Truist Securities | Maintain | Buy | 2025-10-30 |
| Truist Securities | Maintain | Buy | 2025-10-13 |
| Wells Fargo | Upgrade | Overweight | 2025-10-07 |
Amcor plc Grades
Below is a summary of recent grades from well-known firms for Amcor plc.
| Grading Company | Action | New Grade | Date |
|---|---|---|---|
| Wells Fargo | Maintain | Overweight | 2026-01-20 |
| Baird | Upgrade | Outperform | 2026-01-07 |
| Truist Securities | Maintain | Buy | 2026-01-06 |
| Wells Fargo | Maintain | Overweight | 2025-10-15 |
| Baird | Maintain | Neutral | 2025-08-15 |
| Wells Fargo | Maintain | Overweight | 2025-07-18 |
| Truist Securities | Maintain | Buy | 2025-07-11 |
| UBS | Upgrade | Buy | 2025-06-26 |
| Truist Securities | Maintain | Buy | 2025-04-22 |
| Macquarie | Upgrade | Outperform | 2024-11-27 |
Which company has the best grades?
Both companies receive mostly positive ratings, with multiple “Buy,” “Overweight,” and “Outperform” grades. Amcor shows slightly more recent upgrades to “Outperform,” suggesting stronger institutional confidence. This may influence investor sentiment and trading activity in Amcor more positively.
Risks specific to each company
The following categories identify the critical pressure points and systemic threats facing both firms in the 2026 market environment:
1. Market & Competition
Smurfit Westrock Plc
- Faces intense global packaging competition, with low net margin and ROIC signaling weak profitability.
Amcor plc
- Operates in diverse regions and segments but struggles with moderate profitability and competitive pressures.
2. Capital Structure & Debt
Smurfit Westrock Plc
- Maintains moderate debt with a debt-to-equity ratio of 0.78, showing balanced leverage and manageable interest coverage.
Amcor plc
- Higher leverage with debt-to-equity of 1.28, increasing financial risk and weaker quick ratio.
3. Stock Volatility
Smurfit Westrock Plc
- Beta near 1.0 indicates stock moves closely with the market, implying average volatility.
Amcor plc
- Lower beta at 0.67 suggests less volatility and some defensive characteristics.
4. Regulatory & Legal
Smurfit Westrock Plc
- Exposure to EU and international packaging regulations could increase compliance costs.
Amcor plc
- Faces complex multi-jurisdictional regulatory environments across continents, raising compliance risks.
5. Supply Chain & Operations
Smurfit Westrock Plc
- Large workforce and global footprint increase operational complexity and supply chain risks.
Amcor plc
- Smaller employee base but operates in diverse segments, requiring robust supply chain management.
6. ESG & Climate Transition
Smurfit Westrock Plc
- Paper-based packaging may face pressure from sustainability initiatives and carbon reduction demands.
Amcor plc
- Plastic packaging segment faces higher ESG scrutiny and transition risks amid climate regulations.
7. Geopolitical Exposure
Smurfit Westrock Plc
- Headquartered in Ireland with significant international sales, vulnerable to Brexit and EU trade policies.
Amcor plc
- Based in Switzerland with global operations, faces geopolitical risks from multi-regional exposure.
Which company shows a better risk-adjusted profile?
Smurfit Westrock’s highest risk lies in weak profitability and financial distress signals, while Amcor’s biggest threat is high leverage and ESG transition risk. Both show distress-zone bankruptcy risk, but Amcor’s higher debt and weaker quick ratio heighten its vulnerability. Smurfit Westrock presents a slightly better risk-adjusted profile, supported by more balanced capital structure and stronger dividend yield. The recent Altman Z-Scores under 1.4 for both warn investors to approach cautiously.
Final Verdict: Which stock to choose?
Smurfit Westrock Plc’s superpower lies in its capacity for rapid revenue expansion, reflecting strong top-line momentum. However, its persistent value destruction and declining profitability remain points of vigilance. It aligns better with aggressive growth portfolios willing to tolerate volatility for outsized gains.
Amcor plc boasts a strategic moat grounded in its scale and recurring revenue streams, providing more dependable cash flow stability. Compared to Smurfit Westrock, Amcor offers a safer profile despite its slower growth trajectory. It suits investors seeking GARP — growth at a reasonable price — with moderate risk tolerance.
If you prioritize aggressive growth and can weather operational challenges, Smurfit Westrock presents an intriguing scenario due to its top-line dynamism. However, if you seek better stability and a strategic moat with consistent cash generation, Amcor outshines as the more prudent choice. Both stocks carry risks, so aligning with your risk appetite is essential.
Disclaimer: Investment carries a risk of loss of initial capital. The past performance is not a reliable indicator of future results. Be sure to understand risks before making an investment decision.
Go Further
I encourage you to read the complete analyses of Smurfit Westrock Plc and Amcor plc to enhance your investment decisions: