Home > Comparison > Consumer Cyclical > AMCR vs PKG
The competitive dynamic between Amcor plc and Packaging Corporation of America shapes the packaging sector’s future. Amcor operates globally with a diversified model spanning flexible and rigid packaging. Packaging Corporation of America focuses on containerboard and corrugated products, primarily in the U.S. This analysis pits Amcor’s broad-based innovation against Packaging Corp’s specialized manufacturing to identify which offers superior risk-adjusted returns for a balanced portfolio.
Table of contents
Companies Overview
Amcor plc and Packaging Corporation of America are key players in the global packaging industry, shaping supply chains and consumer goods distribution.
Amcor plc: Global Packaging Innovator
Amcor plc dominates the flexible and rigid packaging markets across multiple continents. Its core revenue stems from producing packaging for food, beverage, pharmaceutical, and personal care sectors. In 2026, Amcor focuses strategically on expanding sustainable packaging solutions, leveraging innovation to reduce environmental impact while maximizing customer value.
Packaging Corporation of America: U.S. Containerboard Leader
Packaging Corporation of America commands the U.S. market for containerboard and corrugated packaging. Its revenue relies on manufacturing shipping containers, retail merchandising displays, and specialty paper products. The company prioritizes operational efficiency and broadening its product mix in 2026 to support growing e-commerce and supply chain demands domestically.
Strategic Collision: Similarities & Divergences
Both companies pursue packaging excellence, yet Amcor embraces a global, multi-material approach, while Packaging Corporation of America centers on U.S.-focused containerboard leadership. Their battle for market share unfolds in the evolving packaging requirements of consumer goods and logistics. Amcor offers diversified international exposure; Packaging Corp. delivers concentrated domestic scale, reflecting distinct risk and growth profiles.
Income Statement Comparison
This data dissects the core profitability and scalability of both corporate engines to reveal who dominates the bottom line:
| Metric | Amcor plc (AMCR) | Packaging Corporation of America (PKG) |
|---|---|---|
| Revenue | 15B | 9B |
| Cost of Revenue | 12.2B | 7.1B |
| Operating Expenses | 1.83B | 634M |
| Gross Profit | 2.83B | 1.89B |
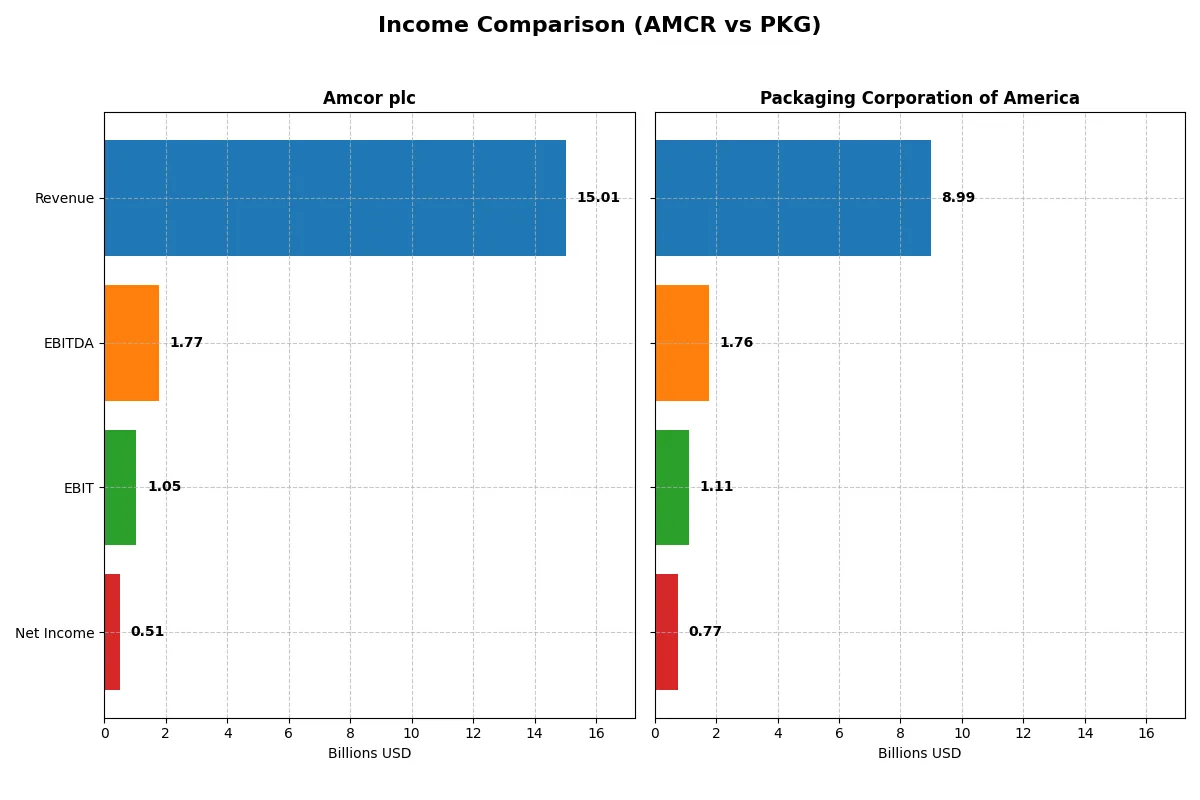
| EBITDA | 1.77B | 1.76B |
| EBIT | 1.05B | 1.11B |
| Interest Expense | 396M | 79M |
| Net Income | 511M | 769M |
| EPS | 1.6 | 8.61 |
| Fiscal Year | 2025 | 2025 |
Income Statement Analysis: The Bottom-Line Duel
This income statement comparison uncovers which company converts revenue into profit more efficiently, revealing the strength of each corporate engine.
Amcor plc Analysis
Amcor’s revenue grew 10% to $15B in 2025, but net income plunged 30% to $510M, reflecting margin pressure. Gross margin held steady near 19%, yet net margin slid to 3.4%, signaling rising costs and weaker profitability. The sharp EBIT decline confirms deteriorating efficiency despite solid top-line momentum.
Packaging Corporation of America Analysis
Packaging Corp expanded revenue 7% to $9B in 2025, with net income falling 5% to $769M. Its gross margin improved to 21%, and EBIT margin doubled Amcor’s at 12.3%, highlighting operational strength. Though net margin dipped to 8.6%, Packaging sustains better profitability and disciplined cost control, showing resilience in earnings.
Margin Discipline vs. Revenue Scale
Packaging Corp delivers superior margin quality and higher net income despite a smaller revenue base. Amcor grows faster top-line but suffers from steep margin erosion and profit decline. For investors, Packaging’s profile offers healthier returns and operational efficiency, contrasting Amcor’s volume-driven but margin-challenged model.
Financial Ratios Comparison
These vital ratios act as a diagnostic tool to expose the underlying fiscal health, valuation premiums, and capital efficiency of the companies compared below:
| Ratios | Amcor plc (AMCR) | Packaging Corporation of America (PKG) |
|---|---|---|
| ROE | 4.36% | N/A |
| ROIC | 2.64% | N/A |
| P/E | 28.58 | 30.64 |
| P/B | 1.25 | N/A |
| Current Ratio | 1.21 | 0.00 |
| Quick Ratio | 0.71 | 0.00 |
| D/E | 1.28 | 0.00 |
| Debt-to-Assets | 40.49% | 0.00 |
| Interest Coverage | 2.55 | 15.87 |
| Asset Turnover | 0.40 | 0.00 |
| Fixed Asset Turnover | 1.61 | 0.00 |
| Payout ratio | 165.36% | 74.29% |
| Dividend yield | 5.79% | 2.42% |
| Fiscal Year | 2025 | 2025 |
Efficiency & Valuation Duel: The Vital Signs
Financial ratios act as a company’s DNA, exposing hidden risks and operational efficiency that shape investor outcomes.
Amcor plc
Amcor posts a low ROE of 4.36% and thin net margins at 3.4%, signaling subdued profitability. Its P/E ratio at 28.58 suggests an expensive valuation relative to earnings. The company balances this with a 5.79% dividend yield, providing steady shareholder returns despite reinvestment needs in R&D and operational improvements.
Packaging Corporation of America
Packaging Corporation shows a stronger net margin of 8.55%, but lacks reported ROE and ROIC data, clouding profitability assessment. Its P/E ratio stands higher at 30.64, implying a stretched valuation. Dividend yield at 2.42% offers moderate income, while favorable debt ratios and interest coverage indicate solid financial health.
Valuation Stretch vs. Profitability Clarity
Both companies face slightly unfavorable ratio profiles with high valuations. Amcor’s stable dividends and clear profitability metrics contrast with Packaging’s stronger margins but incomplete return data. Investors favoring income and transparency may lean toward Amcor, while those seeking margin strength might consider Packaging’s profile.
Which one offers the Superior Shareholder Reward?
I see Amcor plc (AMCR) delivers a 5.8% dividend yield with a payout ratio above 165%, signaling risk in dividend sustainability. Its buybacks are modest, reflecting cautious capital allocation. Packaging Corporation of America (PKG) yields 2.4%-3.1%, with a payout ratio near 56%-74%, backed by strong free cash flow and robust buybacks. PKG’s lower payout ratio and aggressive buybacks indicate a more balanced, sustainable return model. I conclude PKG offers superior total shareholder reward due to healthier dividend coverage and a commitment to buybacks that enhance long-term value.
Comparative Score Analysis: The Strategic Profile
The radar chart reveals the fundamental DNA and trade-offs of Amcor plc and Packaging Corporation of America, highlighting their financial strengths and weaknesses:
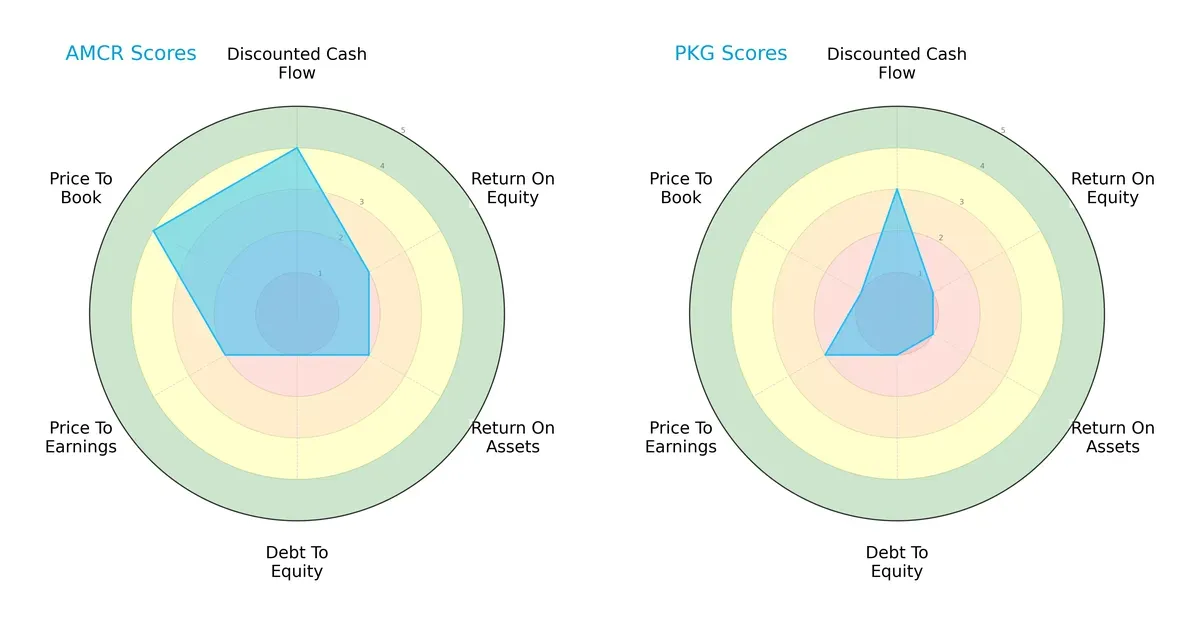
Amcor shows a more balanced profile with stronger discounted cash flow (4) and price-to-book (4) scores, indicating undervaluation and asset efficiency. Packaging relies on moderate DCF (3) but scores very low on ROE (1), ROA (1), and price-to-book (1), reflecting weaker profitability and valuation. Both struggle equally with debt-to-equity (1), but Amcor edges ahead with better operational returns.
Bankruptcy Risk: Solvency Showdown
The Altman Z-Score gap signals stark differences in bankruptcy risk between Amcor and Packaging Corporation:
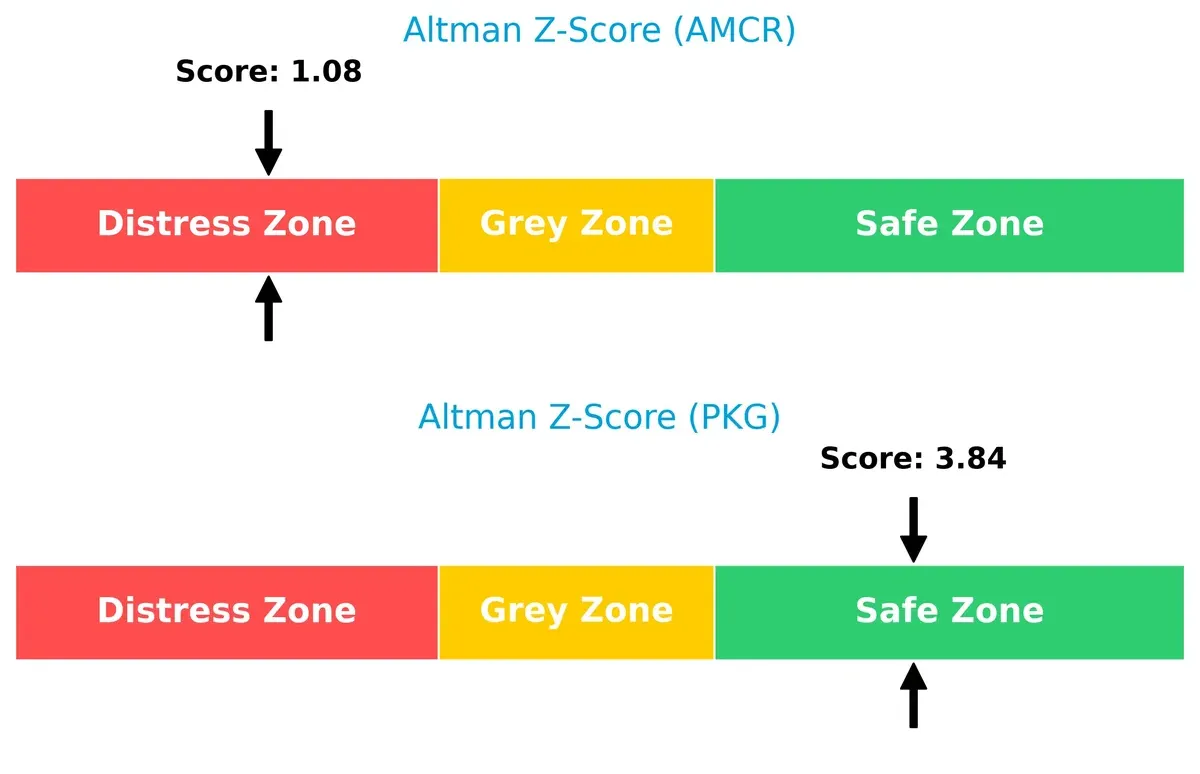
Packaging’s score (3.84) places it securely in the safe zone, implying strong financial stability and low bankruptcy risk. Amcor’s distress zone score (1.08) warns of significant solvency challenges in this cycle, raising red flags about its long-term survival.
Financial Health: Quality of Operations
Both firms share an average Piotroski F-Score of 4, indicating similar operational quality and moderate financial health:
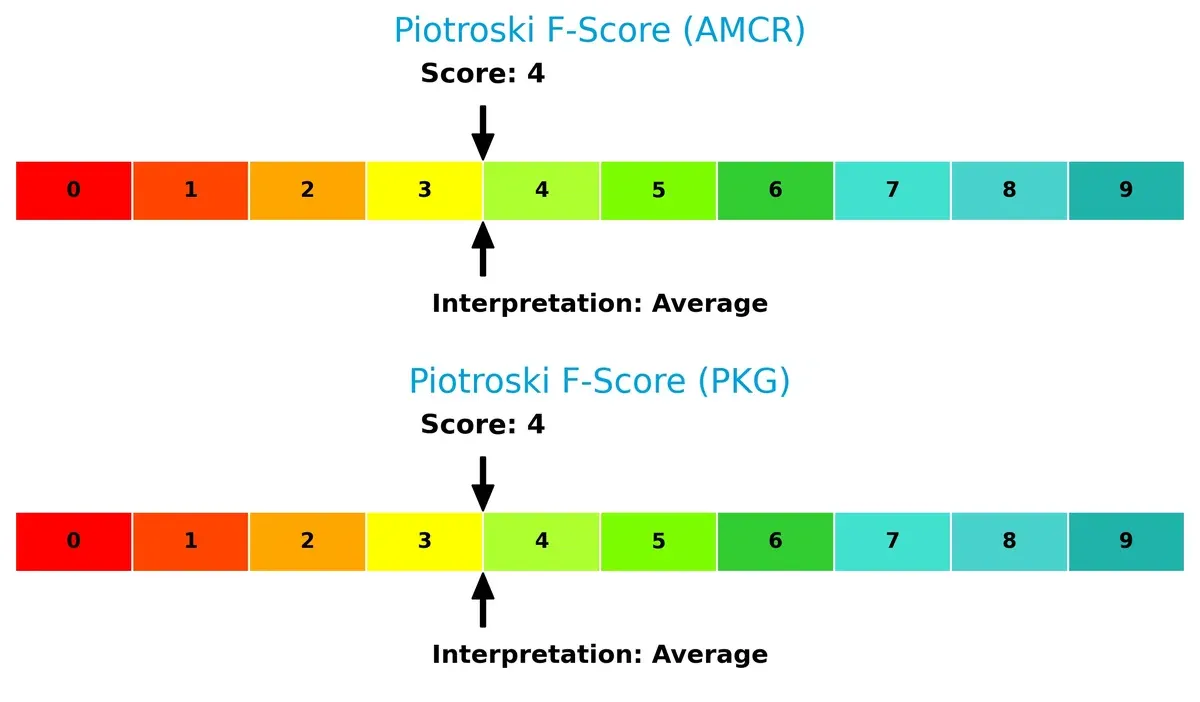
Neither company demonstrates strong internal financial metrics. This parity suggests both face operational challenges, with no clear advantage in profitability, leverage, or liquidity quality. Investors should monitor their internal improvements closely.
How are the two companies positioned?
This section dissects Amcor and Packaging Corp’s operational DNA by comparing revenue distribution and internal dynamics—strengths and weaknesses. The goal is to confront their economic moats to reveal which model delivers the most resilient competitive advantage today.
Revenue Segmentation: The Strategic Mix
This comparison dissects how Amcor plc and Packaging Corporation of America diversify their income streams and where their primary sector bets lie:
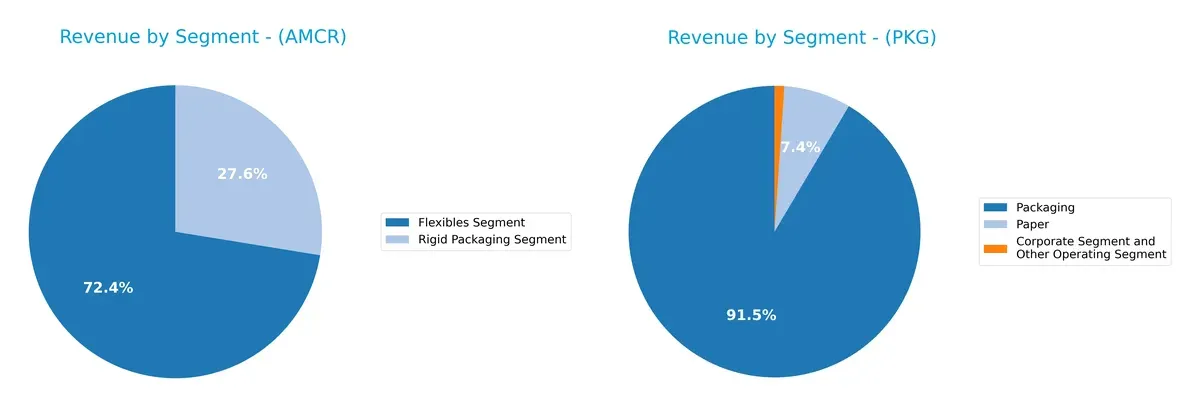
Amcor anchors its revenue in the Flexibles Segment with $10.9B in 2025, complemented by $4.1B from Rigid Packaging. This mix reflects a dual focus on flexible and rigid solutions, reducing concentration risk. Packaging Corporation of America, however, pivots heavily on its Packaging segment at $7.7B in 2024, dwarfing its Paper segment at $625M. Amcor’s broader segmentation suggests stronger ecosystem lock-in versus Packaging Corp’s infrastructure dominance.
Strengths and Weaknesses Comparison
This table compares the Strengths and Weaknesses of Amcor plc and Packaging Corporation of America:
Amcor plc Strengths
- Diverse product segments with Flexibles and Rigid Packaging
- Global presence across North America, Europe, Asia Pacific, and Latin America
- Favorable WACC and PB ratios indicating cost of capital and valuation strength
Packaging Corporation of America Strengths
- Favorable debt metrics with zero debt-to-assets and low debt-to-equity
- Strong interest coverage ratio of 13.99 signaling solid debt servicing ability
- Favorable dividend yield at 2.42%
- Neutral net margin higher than Amcor at 8.55%
Amcor plc Weaknesses
- Unfavorable profitability metrics: net margin 3.4%, ROE 4.36%, ROIC 2.64% below WACC
- Weak liquidity with quick ratio 0.71 and high debt-to-equity 1.28
- Asset turnover low at 0.4 indicating inefficient asset use
- PE ratio high at 28.58 may limit valuation upside
Packaging Corporation of America Weaknesses
- Unfavorable ROE and ROIC at 0% signaling no returns on equity or invested capital
- Unavailable WACC limits cost of capital analysis
- Poor liquidity with zero current and quick ratios
- Asset turnover and fixed asset turnover unavailable or unfavorable
- High PE ratio at 30.64 suggests expensive valuation
Amcor’s strength lies in its global diversification and more balanced capital structure, though profitability and asset efficiency remain concerns. Packaging Corp shows strong balance sheet health but faces critical issues in profitability and liquidity, which could affect operational flexibility.
The Moat Duel: Analyzing Competitive Defensibility
A structural moat is the only barrier protecting long-term profits from relentless competition and market pressures. Let’s dissect these firms’ moats:
Amcor plc: Global Scale and Diversified Product Portfolio
Amcor’s moat stems from its extensive geographic reach and product diversification, enabling margin stability despite raw material volatility. Yet, declining ROIC signals value erosion, threatening its competitive edge in 2026.
Packaging Corporation of America: Cost Leadership in Corrugated Packaging
Packaging Corp’s cost advantage in containerboard production drives superior gross and EBIT margins, supporting efficient capital use. However, its ROIC trend is also declining, raising concerns about moat durability.
Scale and Cost Efficiency: Which Moat Defends Better?
Amcor leverages scale and diversification but faces shrinking returns. Packaging Corp’s cost leadership yields better margins but also shows weakening ROIC. Neither moat is fully secure; Packaging’s margin strength edges it as better positioned to defend market share.
Which stock offers better returns?
The past year showed contrasting price dynamics: Amcor plc faced a steady decline with recent recovery, while Packaging Corporation of America recorded strong gains and sustained upward momentum.
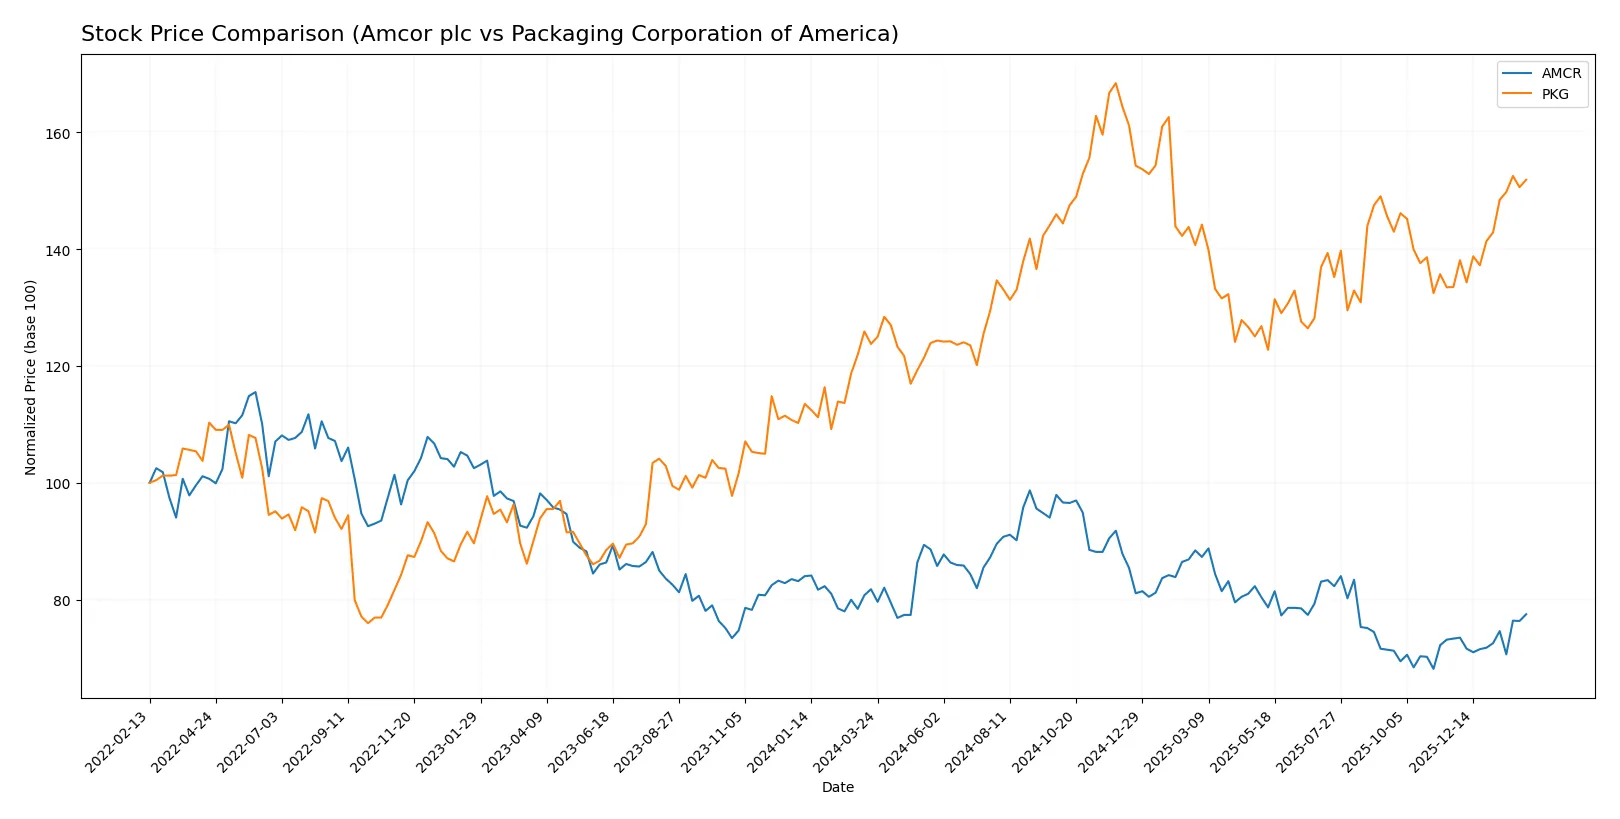
Trend Comparison
Amcor plc’s stock price fell 5.23% over the past 12 months, marking a bearish trend with accelerating decline. The price ranged between 39.5 and 57.2, with volatility measured by a 4.43 standard deviation.
Packaging Corporation of America gained 22.69% over the same period, reflecting a bullish trend with accelerating growth. Price fluctuated widely, between 172.85 and 248.85, and showed high volatility with a 17.82 standard deviation.
Packaging Corporation of America outperformed Amcor plc, delivering the highest market return with sustained bullish momentum and stronger price appreciation.
Target Prices
Analyst consensus on target prices shows a wide valuation range for Amcor plc and a tighter, bullish range for Packaging Corporation of America.
| Company | Target Low | Target High | Consensus |
|---|---|---|---|
| Amcor plc | 9 | 46 | 17.28 |
| Packaging Corporation of America | 233 | 270 | 246 |
Packaging Corporation of America’s target consensus of 246 exceeds its current price of 224.42, signaling upside potential. Amcor’s consensus target of 17.28 is well below its current 44.92 price, indicating cautious analyst sentiment.

Don’t Let Luck Decide Your Entry Point
Optimize your entry points with our advanced ProRealTime indicators. You’ll get efficient buy signals with precise price targets for maximum performance. Start outperforming now!
How do institutions grade them?
Amcor plc Grades
The latest institutional grades for Amcor plc show consistent positive sentiment:
| Grading Company | Action | New Grade | Date |
|---|---|---|---|
| Wells Fargo | Maintain | Overweight | 2026-01-20 |
| Baird | Upgrade | Outperform | 2026-01-07 |
| Truist Securities | Maintain | Buy | 2026-01-06 |
Packaging Corporation of America Grades
Institutional grades for Packaging Corporation of America indicate steady confidence:
| Grading Company | Action | New Grade | Date |
|---|---|---|---|
| Wells Fargo | Maintain | Overweight | 2026-01-29 |
| Truist Securities | Maintain | Buy | 2026-01-29 |
| Citigroup | Maintain | Neutral | 2026-01-29 |
Which company has the best grades?
Both companies receive predominantly overweight and buy ratings from top firms. Amcor shows a recent upgrade to outperform, suggesting stronger momentum. Investors may interpret this as a slightly more bullish outlook on Amcor.
Risks specific to each company
The following categories identify the critical pressure points and systemic threats facing both firms in the 2026 market environment:
1. Market & Competition
Amcor plc
- Faces margin pressure with a 3.4% net margin, indicating competitive challenges in global packaging markets.
Packaging Corporation of America
- Maintains a stronger 8.55% net margin, but zero ROE and ROIC suggest operational inefficiencies despite market presence in the US.
2. Capital Structure & Debt
Amcor plc
- Debt-to-equity ratio is high at 1.28, signaling elevated leverage and related financial risk.
Packaging Corporation of America
- Exhibits very favorable debt metrics with low leverage and strong interest coverage at 13.99, indicating solid financial stability.
3. Stock Volatility
Amcor plc
- Beta of 0.668 suggests lower stock volatility, providing relative stability in turbulent markets.
Packaging Corporation of America
- Beta of 0.898 implies higher volatility, exposing investors to greater price swings.
4. Regulatory & Legal
Amcor plc
- Operates globally, increasing exposure to diverse and complex regulatory environments.
Packaging Corporation of America
- Focuses primarily on US markets, facing concentrated regulatory risks but possibly more manageable compliance.
5. Supply Chain & Operations
Amcor plc
- Broad geographic footprint may cause supply chain complexity and operational disruption risks.
Packaging Corporation of America
- US-centric operations reduce international supply chain risks but create dependency on domestic logistics.
6. ESG & Climate Transition
Amcor plc
- Global presence demands significant ESG compliance investments, increasing transitional costs.
Packaging Corporation of America
- Domestic focus may ease ESG adaptation but risks lagging on global sustainability standards.
7. Geopolitical Exposure
Amcor plc
- Exposure to multiple regions subjects it to geopolitical tensions and trade policy risks.
Packaging Corporation of America
- Concentrated in the US, facing fewer geopolitical risks but vulnerable to domestic policy shifts.
Which company shows a better risk-adjusted profile?
Packaging Corporation of America presents a better risk-adjusted profile thanks to its strong balance sheet and safer financial footing. Amcor’s high leverage and low profitability weigh heavily against it. However, Amcor’s lower stock volatility offers some offset. The most impactful risk for Amcor is its elevated debt load coupled with weak returns, signaling financial strain. For Packaging Corp, operational inefficiency reflected in zero ROE and ROIC is the key concern. The data reveals Amcor’s Altman Z-score in the distress zone (1.08) versus Packaging’s safe zone (3.84), underscoring Packaging’s comparatively stronger financial health despite some operational red flags.
Final Verdict: Which stock to choose?
Amcor plc’s superpower lies in its resilience amid challenging profitability trends, fueled by steady revenue growth and a solid dividend yield. Its point of vigilance is the declining return on invested capital, signaling potential value erosion. It suits investors with a tolerance for cyclical recovery and income focus.
Packaging Corporation of America benefits from a strategic moat rooted in operational efficiency and a robust balance sheet, reflected in strong interest coverage and a safe-zone Altman Z-Score. Compared to Amcor, it offers better financial stability but commands a premium valuation. It fits well within a GARP (Growth at a Reasonable Price) portfolio.
If you prioritize income and recovery potential, Amcor presents a compelling scenario despite its waning ROIC. However, if you seek financial strength and operational discipline with less risk, Packaging Corporation of America offers better stability and a stronger safety profile. Both stocks carry sector-specific risks that prudent investors should weigh carefully.
Disclaimer: Investment carries a risk of loss of initial capital. The past performance is not a reliable indicator of future results. Be sure to understand risks before making an investment decision.
Go Further
I encourage you to read the complete analyses of Amcor plc and Packaging Corporation of America to enhance your investment decisions: