Home > Comparison > Consumer Cyclical > IP vs AMCR
The strategic rivalry between International Paper Company and Amcor plc shapes the global packaging industry’s future. International Paper stands as a capital-intensive packaging giant with a diverse cellulose fiber portfolio. In contrast, Amcor excels as a flexible and rigid packaging innovator focusing on high-margin consumer products. This analysis will clarify which company’s operational model offers superior risk-adjusted returns for a diversified portfolio navigating evolving market dynamics.
Table of contents
Companies Overview
International Paper Company and Amcor plc stand as pivotal players in the global packaging industry, shaping markets across continents.
International Paper Company: Packaging Powerhouse with Global Reach
International Paper Company dominates the packaging sector with its Industrial Packaging and Global Cellulose Fibers segments. It generates revenue mainly by manufacturing containerboards and specialty pulps for hygiene, tissue, and nonwoven products. In 2026, it strategically focuses on expanding its industrial packaging footprint while optimizing cellulose fiber applications across diverse markets.
Amcor plc: Flexible and Rigid Packaging Innovator
Amcor plc leads in developing flexible and rigid packaging solutions for food, beverage, medical, and personal care industries. Its core revenue derives from film-based flexible packaging and plastic containers. The company’s 2026 strategy centers on enhancing product innovation and sustainability across its global sales channels, boosting its presence in both emerging and mature markets.
Strategic Collision: Similarities & Divergences
Both firms emphasize packaging innovation but diverge in approach: International Paper prioritizes fiber-based products, while Amcor focuses on plastic and flexible materials. Their primary battleground lies in sustainable packaging solutions catering to evolving consumer demands. This contrast defines their distinct investment profiles—International Paper’s asset-heavy industrial scale versus Amcor’s adaptable, innovation-driven model.
Income Statement Comparison
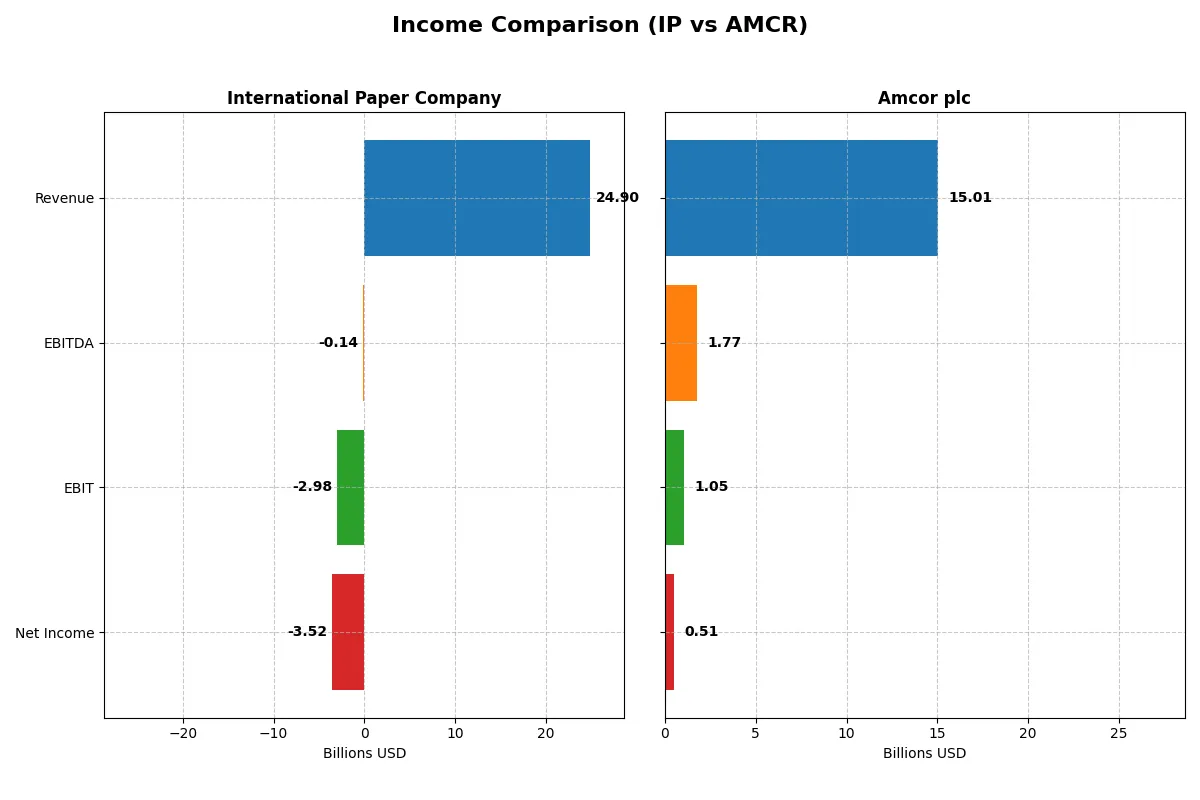
This data dissects the core profitability and scalability of both corporate engines to reveal who dominates the bottom line:
| Metric | International Paper Company (IP) | Amcor plc (AMCR) |
|---|---|---|
| Revenue | 24.9B | 15.0B |
| Cost of Revenue | 17.5B | 12.2B |
| Operating Expenses | 10.2B | 1.8B |
| Gross Profit | 7.4B | 2.8B |
| EBITDA | -138M | 1.8B |
| EBIT | -3.0B | 1.0B |
| Interest Expense | 372M | 396M |
| Net Income | -3.5B | 510M |
| EPS | -6.71 | 1.6 |
| Fiscal Year | 2025 | 2025 |
Income Statement Analysis: The Bottom-Line Duel
This income statement comparison reveals the true operational efficiency and profitability momentum of two industry players over recent years.
International Paper Company Analysis
International Paper’s revenue climbed sharply by 34% in 2025 to $24.9B, yet it posted a net loss of $3.5B, reversing prior profitability. Its gross margin remained solid near 29.5%, but the EBIT margin plunged to -12%, signaling deteriorating operational efficiency. The sharp net income decline highlights significant challenges despite top-line growth.
Amcor plc Analysis
Amcor’s revenue grew steadily by 10% in 2025, reaching $15B, while net income declined to $510M with a modest 3.4% net margin. Gross margin held steady at 18.9%, but EBIT margin slipped below 7%. Despite lower profitability, Amcor maintains positive earnings and more consistent margin stability, reflecting moderate but steady operational control.
Margin Resilience vs. Revenue Surge
International Paper shows strong revenue growth but suffers from negative profitability and shrinking margins, indicating operational stress. Amcor delivers slower top-line expansion but preserves positive net income and stable margins. For investors, Amcor’s profile suggests more reliable earnings, while International Paper’s sharp revenue surge carries higher risk given its deteriorating bottom line.
Financial Ratios Comparison
These vital ratios act as a diagnostic tool to expose the underlying fiscal health, valuation premiums, and capital efficiency of the companies analyzed:
| Ratios | International Paper Company (IP) | Amcor plc (AMCR) |
|---|---|---|
| ROE | -23.7% (2025) | 4.4% (2025) |
| ROIC | -7.6% (2025) | 2.6% (2025) |
| P/E | -5.9 (2025) | 28.6 (2025) |
| P/B | 1.40 (2025) | 1.25 (2025) |
| Current Ratio | 1.28 (2025) | 1.21 (2025) |
| Quick Ratio | 1.02 (2025) | 0.71 (2025) |
| D/E (Debt-to-Equity) | 0.70 (2025) | 1.28 (2025) |
| Debt-to-Assets | 27.2% (2025) | 40.5% (2025) |
| Interest Coverage | -7.58 (2025) | 2.55 (2025) |
| Asset Turnover | 0.66 (2025) | 0.40 (2025) |
| Fixed Asset Turnover | 1.64 (2025) | 1.61 (2025) |
| Payout ratio | -27.8% (2025) | 165.4% (2025) |
| Dividend yield | 4.7% (2025) | 5.8% (2025) |
| Fiscal Year | 2025 | 2025 |
Efficiency & Valuation Duel: The Vital Signs
Financial ratios serve as a company’s DNA, uncovering hidden risks and showcasing operational efficiency and valuation nuances.
International Paper Company
International Paper posts weak profitability with a -23.7% ROE and negative margins, signaling operational challenges. Its valuation metrics show a cheap P/E of -5.92 and a reasonable P/B of 1.4, implying undervaluation. The company rewards shareholders with a solid 4.7% dividend yield, reflecting a focus on income distribution over growth reinvestment.
Amcor plc
Amcor delivers modest profitability with a 4.36% ROE and a slim 3.4% net margin, indicating limited earnings efficiency. Its P/E of 28.58 suggests the stock is expensive relative to earnings, despite a favorable P/B of 1.25. Amcor offers a 5.79% dividend yield, balancing shareholder returns with moderate reinvestment in R&D and growth.
Valuation Discipline vs. Profitability Struggles
International Paper offers a more attractive valuation and stronger dividend yield despite operational losses, while Amcor’s profitability is positive but comes at a stretched valuation. Investors seeking value and income may lean toward International Paper, whereas those favoring modest profitability could consider Amcor’s profile.
Which one offers the Superior Shareholder Reward?
I see International Paper (IP) and Amcor (AMCR) both pay dividends but differ in distribution strategy. IP yields about 4.7% with payout ratios fluctuating, recently negative due to losses, signaling risk in dividend sustainability. AMCR offers a higher yield around 5.2–5.8% with payout ratios near 1.0–1.65, reflecting a more stable cash flow coverage. AMCR’s buyback programs appear more consistent and sizable, enhancing returns beyond dividends. IP’s negative free cash flow in 2025 raises red flags, undermining dividend safety and limiting buybacks. AMCR’s free cash flow coverage above 0.58 supports both dividends and buybacks sustainably. I conclude AMCR delivers superior total shareholder reward in 2026, combining a robust yield with disciplined capital allocation.
Comparative Score Analysis: The Strategic Profile
The radar chart reveals the core financial DNA and strategic trade-offs of International Paper Company and Amcor plc:
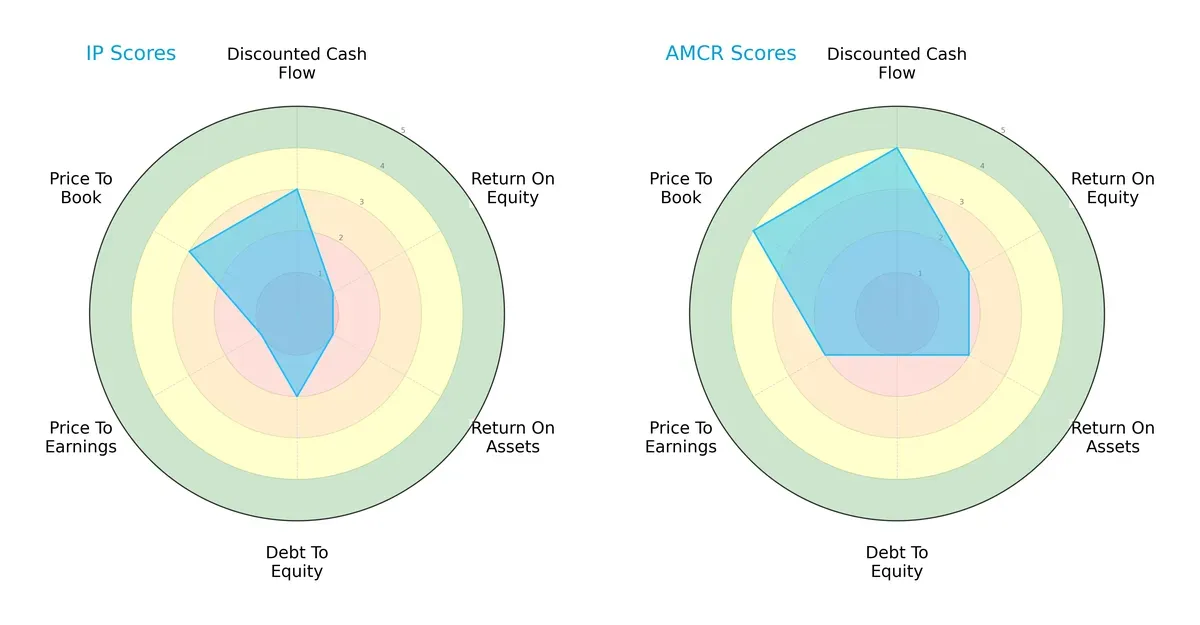
International Paper shows moderate DCF and balanced debt levels but suffers from very weak profitability metrics (ROE and ROA scores at 1). Amcor delivers stronger cash flow (DCF score 4) and more balanced profitability (ROE and ROA scores at 2), though it carries higher financial risk (Debt/Equity score 1). Amcor’s valuation scores (P/E and P/B) also suggest better market favorability. Overall, Amcor exhibits a more balanced profile, while International Paper relies on moderate leverage and undervalued book assets.
Bankruptcy Risk: Solvency Showdown
The Altman Z-Scores place both firms in the distress zone, signaling elevated bankruptcy risk amid current economic conditions:
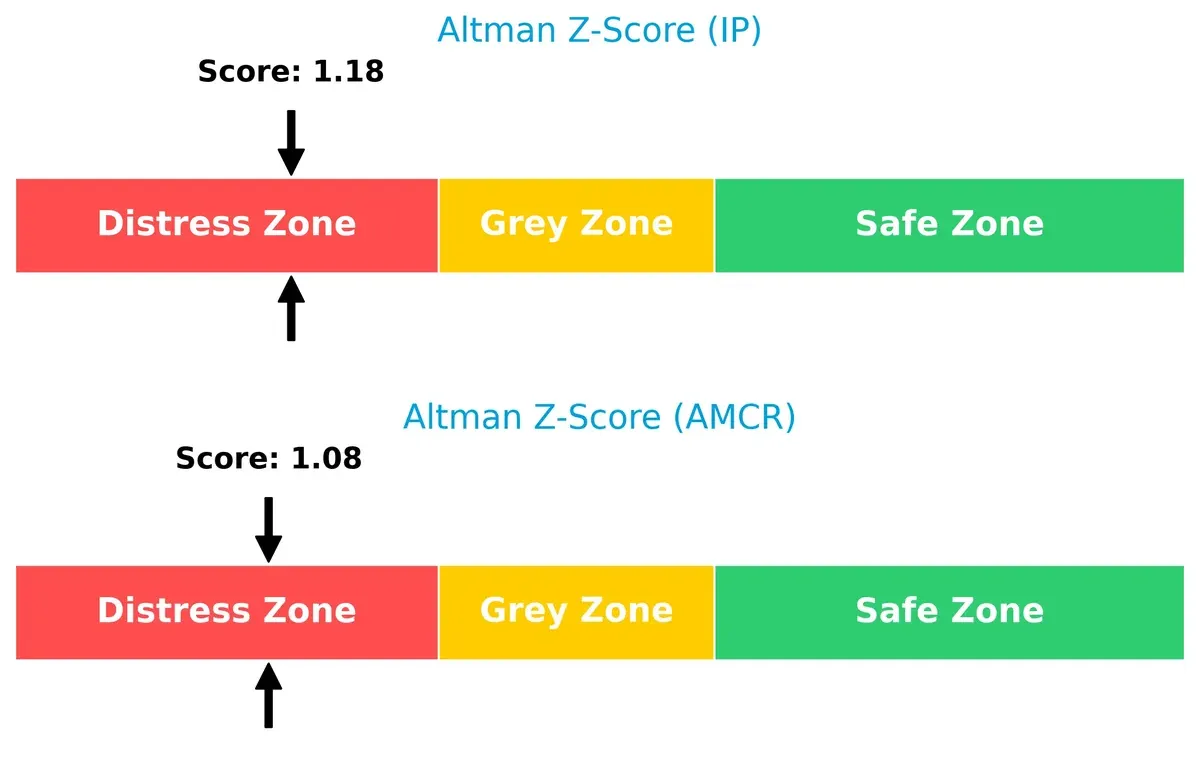
International Paper scores 1.18, slightly above Amcor’s 1.08, but both remain well below the safe threshold of 3. This implies both companies face significant solvency challenges and heightened default risk through this cycle.
Financial Health: Quality of Operations
Piotroski F-Scores highlight relative financial robustness, with Amcor outperforming International Paper in operational quality:
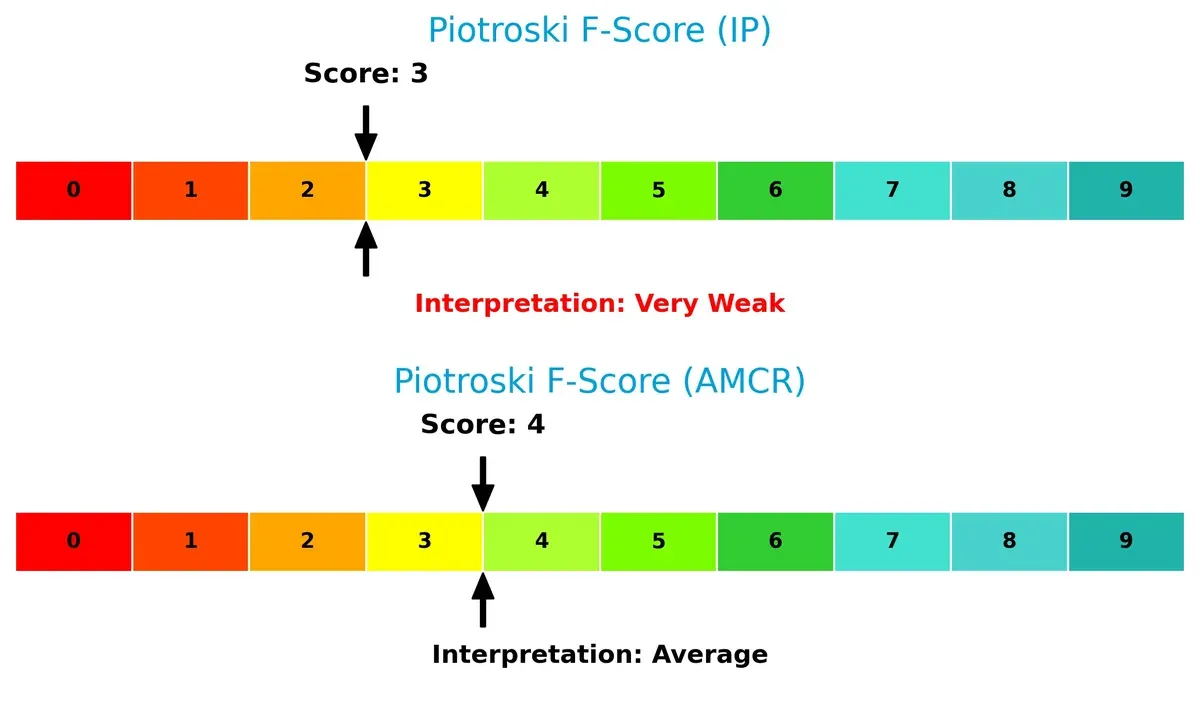
International Paper’s very weak score of 3 contrasts with Amcor’s average score of 4, flagging concerns about IP’s internal profitability and efficiency metrics. Amcor demonstrates steadier financial health, though neither firm ranks as strong, warranting cautious monitoring.
How are the two companies positioned?
This section dissects IP and AMCR’s operational DNA by comparing revenue distribution and internal dynamics. The goal is to confront their economic moats and identify which model offers the most resilient competitive advantage today.
Revenue Segmentation: The Strategic Mix
This visual comparison dissects how International Paper Company and Amcor plc diversify their income streams and where their primary sector bets lie:
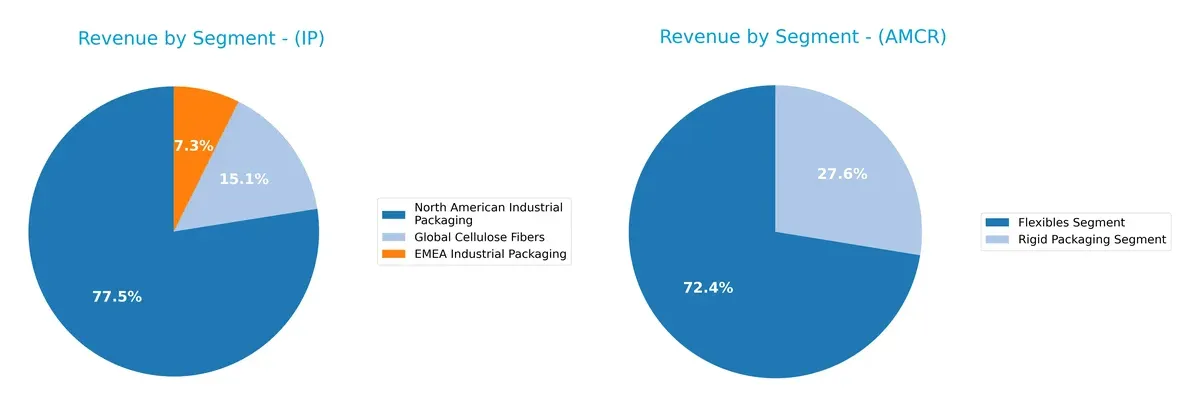
International Paper pivots heavily on North American Industrial Packaging at $14.3B in 2024, dwarfing its $2.8B Global Cellulose Fibers segment. Amcor shows a more balanced split with $10.3B in Flexibles and $3.3B in Rigid Packaging. IP’s concentration signals infrastructure dominance but heightens sector risk. Amcor’s diversified mix reduces dependency, supporting resilience amid packaging market shifts.
Strengths and Weaknesses Comparison
This table compares the strengths and weaknesses of International Paper Company and Amcor plc:
International Paper Company Strengths
- Diverse revenue streams in cellulose fibers and multiple packaging segments
- Strong presence in North America and EMEA
- Favorable WACC and dividend yield
- Solid quick ratio and low debt to assets
Amcor plc Strengths
- Balanced revenue between flexibles and rigid packaging
- Broad geographic reach including Europe, North America, Asia Pacific, Latin America
- Favorable WACC and price-to-book ratio
- Neutral interest coverage ratio
International Paper Company Weaknesses
- Negative net margin, ROE, and ROIC indicate profitability challenges
- Unfavorable interest coverage and negative PE ratio
- Limited diversification outside industrial packaging and cellulose fibers
Amcor plc Weaknesses
- Low profitability ratios with unfavorable net margin, ROE, ROIC
- Unfavorable debt-to-equity and quick ratio
- Lower asset turnover and relatively high PE ratio
International Paper shows strengths in capital structure and geographic diversification but suffers from poor profitability metrics. Amcor’s strengths lie in segment and regional balance, yet its profitability and efficiency indicators remain weak. Both face challenges that should influence strategic priorities.
The Moat Duel: Analyzing Competitive Defensibility
A structural moat is the only reliable barrier protecting long-term profits from relentless competitive erosion in packaging and containers:
International Paper Company: Intangible Assets and Scale Power
International Paper leverages vast scale and specialized cellulose fibers, reflected in steady gross margins near 30%. Yet, declining ROIC signals weakening capital efficiency in 2026. New product lines in specialty pulps could deepen its moat if managed well.
Amcor plc: Diversified Product Portfolio and Customer Reach
Amcor’s moat stems from a diversified packaging portfolio across flexible and rigid segments, supporting moderate margins and global sales. Its lower but stable ROIC trend contrasts with IP’s sharper decline. Expansion in emerging markets may bolster its competitive edge.
Scale and Diversification: Which Moat Holds Stronger?
Both companies currently shed value with declining ROIC below WACC, but International Paper’s scale and intangible assets offer a wider moat. However, Amcor’s diversification and geographic reach provide more resilience to market shifts. IP is better positioned to defend core markets if it reverses profitability trends.
Which stock offers better returns?
The past year shows contrasting dynamics: International Paper Company’s stock rose steadily with accelerating gains, while Amcor plc experienced a prolonged decline despite recent upward momentum.
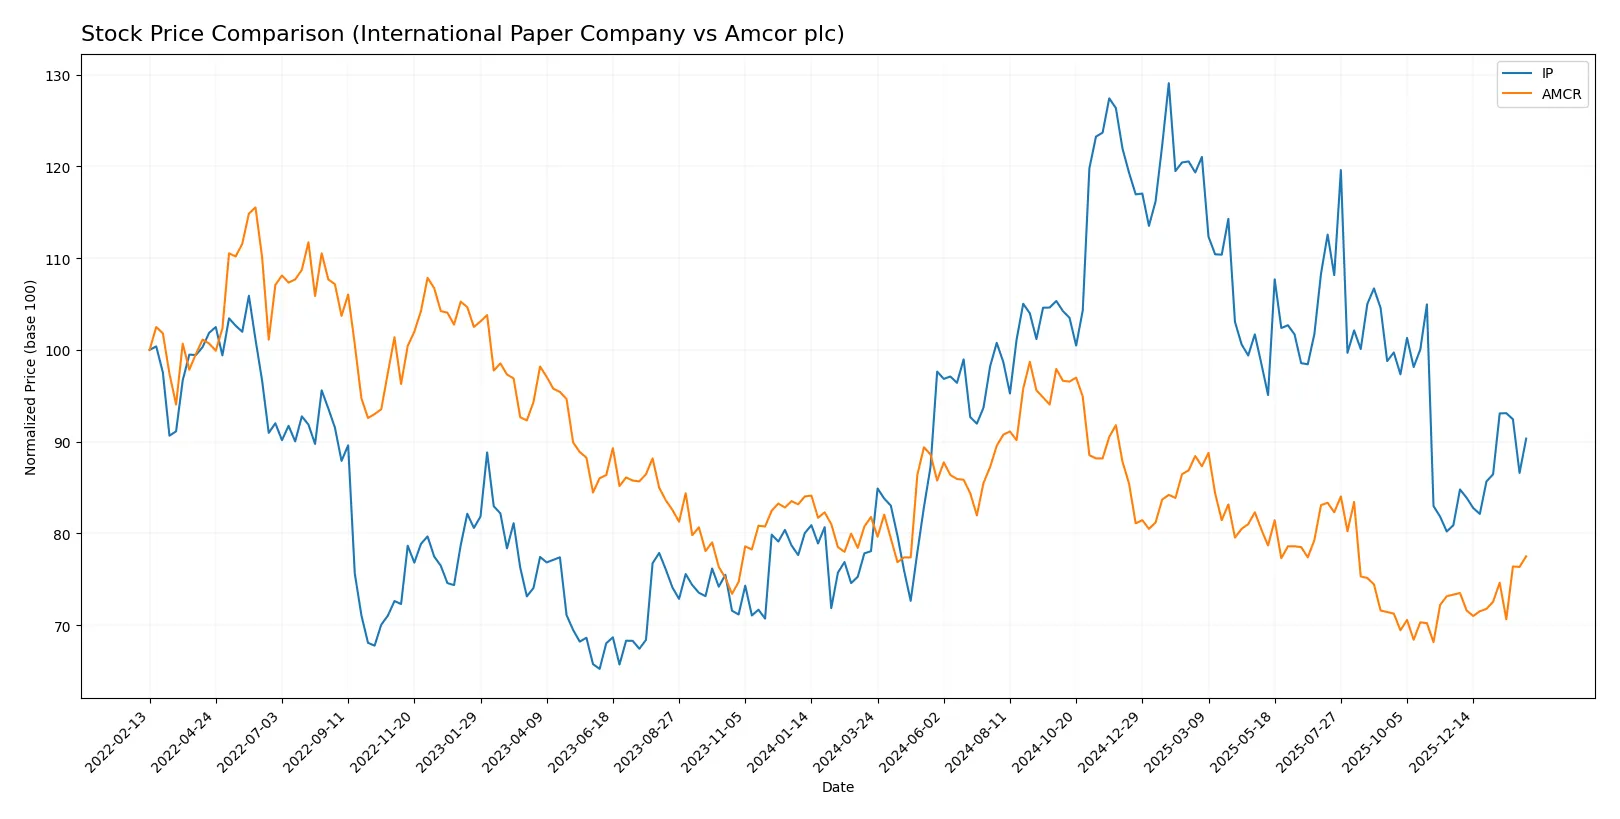
Trend Comparison
International Paper Company’s stock appreciated 15.71% over the past 12 months, marking a bullish trend with accelerating growth and a high volatility of 6.11%. It hit a peak of 60.09 and a low of 33.83.
Amcor plc posted a 5.23% decline over the same period, reflecting a bearish trend despite recent acceleration and a more moderate volatility of 4.43%. Its highest and lowest prices were 57.2 and 39.5, respectively.
Comparing the two, International Paper Company delivered the highest market performance, reversing recent slight seller dominance, while Amcor remains in recovery but below last year’s levels.
Target Prices
Analysts present a mixed target consensus for these packaging sector leaders.
| Company | Target Low | Target High | Consensus |
|---|---|---|---|
| International Paper Company | 40 | 57.8 | 48.3 |
| Amcor plc | 9 | 46 | 17.28 |
International Paper’s consensus target of 48.3 suggests modest upside from the current 42.06 price. Amcor’s consensus of 17.28 sharply undervalues the current 44.92 price, indicating a potential disconnect or higher risk perception among analysts.

Don’t Let Luck Decide Your Entry Point
Optimize your entry points with our advanced ProRealTime indicators. You’ll get efficient buy signals with precise price targets for maximum performance. Start outperforming now!
How do institutions grade them?
International Paper Company Grades
Here are recent analyst grades for International Paper Company from reputable firms:
| Grading Company | Action | New Grade | Date |
|---|---|---|---|
| Citigroup | Maintain | Buy | 2026-02-02 |
| UBS | Downgrade | Neutral | 2026-02-02 |
| Wells Fargo | Upgrade | Equal Weight | 2026-01-30 |
| RBC Capital | Maintain | Outperform | 2026-01-30 |
| UBS | Maintain | Buy | 2026-01-12 |
| Truist Securities | Maintain | Buy | 2026-01-06 |
| Argus Research | Maintain | Buy | 2025-12-22 |
| JP Morgan | Maintain | Neutral | 2025-12-05 |
| Citigroup | Maintain | Buy | 2025-11-03 |
| Wells Fargo | Maintain | Underweight | 2025-10-31 |
Amcor plc Grades
Below are recent analyst grades for Amcor plc from established firms:
| Grading Company | Action | New Grade | Date |
|---|---|---|---|
| Wells Fargo | Maintain | Overweight | 2026-01-20 |
| Baird | Upgrade | Outperform | 2026-01-07 |
| Truist Securities | Maintain | Buy | 2026-01-06 |
| Wells Fargo | Maintain | Overweight | 2025-10-15 |
| Baird | Maintain | Neutral | 2025-08-15 |
| Wells Fargo | Maintain | Overweight | 2025-07-18 |
| Truist Securities | Maintain | Buy | 2025-07-11 |
| UBS | Upgrade | Buy | 2025-06-26 |
| Truist Securities | Maintain | Buy | 2025-04-22 |
| Macquarie | Upgrade | Outperform | 2024-11-27 |
Which company has the best grades?
Amcor plc’s grades consistently tilt toward Outperform and Buy, reflecting stronger analyst confidence. International Paper shows more mixed ratings, with some downgrades and Neutral assessments. This contrast may influence investor sentiment and portfolio weighting decisions.
Risks specific to each company
In 2026’s complex market environment, these categories highlight critical pressure points and systemic threats facing International Paper Company and Amcor plc:
1. Market & Competition
International Paper Company
- Faces fierce competition in global packaging, pressured by declining profitability and negative ROIC.
Amcor plc
- Competes in flexible and rigid packaging with moderate margins but struggles with lower asset turnover.
2. Capital Structure & Debt
International Paper Company
- Maintains moderate debt levels with a debt-to-assets ratio of 27%, but negative interest coverage signals risk.
Amcor plc
- Higher leverage with debt-to-equity at 1.28 and strained quick ratio, increasing financial vulnerability.
3. Stock Volatility
International Paper Company
- Beta of 1.07 indicates market-level volatility, reflecting sensitivity to economic cycles.
Amcor plc
- Lower beta at 0.67 suggests less sensitivity to market swings, offering relative stability.
4. Regulatory & Legal
International Paper Company
- Exposed to US and international packaging regulations, with risks from environmental compliance costs.
Amcor plc
- Faces regulatory scrutiny across multiple regions, requiring compliance with diverse packaging and environmental laws.
5. Supply Chain & Operations
International Paper Company
- Global operations risk disruptions from raw material prices and logistics, impacting margins.
Amcor plc
- Operational complexity due to multi-region presence and diverse product lines increases supply chain risk.
6. ESG & Climate Transition
International Paper Company
- Sustainability efforts critical amid increasing pressure on paper and pulp industry for carbon footprint reduction.
Amcor plc
- Faces challenges in shifting flexible and rigid plastics toward eco-friendly alternatives amid tightening regulations.
7. Geopolitical Exposure
International Paper Company
- Significant exposure to US and emerging markets, vulnerable to trade tensions and tariffs.
Amcor plc
- Swiss-based with broad global footprint, exposed to currency risks and geopolitical instability in key markets.
Which company shows a better risk-adjusted profile?
International Paper’s most impactful risk lies in its negative profitability and weak interest coverage, signaling financial distress. Amcor’s greatest concern is its high leverage and operational complexity, which undermine stability. Despite both scoring in the distress zone on Altman Z-scores, International Paper’s lower debt burden and more favorable debt-to-assets ratio offer a marginally better risk-adjusted profile. The recent negative ROIC at International Paper raises red flags about capital efficiency, while Amcor’s elevated debt levels warrant caution.
Final Verdict: Which stock to choose?
International Paper Company’s superpower lies in its operational scale and resilient cash flow generation despite recent profitability challenges. Its key point of vigilance is the ongoing value destruction signaled by declining ROIC and negative returns, which could pressure long-term growth. It fits an aggressive growth portfolio willing to tolerate cyclical volatility for potential rebound.
Amcor plc benefits from a strategic moat rooted in packaging solutions with recurring revenue streams. While its financial leverage and weaker liquidity warrant caution, it offers better stability than International Paper amid market uncertainty. This makes it suitable for a GARP (Growth at a Reasonable Price) portfolio seeking moderate growth with controlled risk.
If you prioritize turnaround potential and can stomach short-term operational headwinds, International Paper outshines due to its scale and accelerating price momentum. However, if you seek steadier income and a more consistent moat, Amcor offers better stability despite a higher debt load. Both present analytical scenarios for distinct investor profiles with different risk appetites.
Disclaimer: Investment carries a risk of loss of initial capital. The past performance is not a reliable indicator of future results. Be sure to understand risks before making an investment decision.
Go Further
I encourage you to read the complete analyses of International Paper Company and Amcor plc to enhance your investment decisions: