Home > Comparison > Consumer Cyclical > AMCR vs BALL
The strategic rivalry between Amcor plc and Ball Corporation shapes the packaging sector’s evolution. Amcor operates as a global flexible and rigid packaging producer, leveraging scale across diverse industries. Ball Corporation combines aluminum beverage packaging expertise with a specialized aerospace segment, reflecting a dual operational model. This analysis pits broad-based packaging scale against focused innovation, aiming to identify which trajectory delivers superior risk-adjusted returns for diversified investors in a competitive landscape.
Table of contents
Companies Overview
Amcor and Ball Corporation stand as pivotal players in the global packaging industry, shaping consumer product delivery worldwide.
Amcor plc: Global Packaging Innovator
Amcor dominates the flexible and rigid packaging markets, serving food, beverage, and healthcare sectors across five continents. Its revenue comes chiefly from producing versatile packaging films and rigid containers for beverages and personal care goods. In 2026, Amcor sharpens its strategic focus on sustainability and innovation to meet evolving regulatory and consumer demands.
Ball Corporation: Aluminum Packaging and Aerospace Leader
Ball Corporation specializes in aluminum beverage containers while diversifying into aerospace technologies and defense systems. It generates revenue through beverage packaging in multiple regions and advanced aerospace components. In 2026, Ball intensifies investments in aerospace innovation alongside expanding its aluminum packaging footprint globally.
Strategic Collision: Similarities & Divergences
Both firms excel in packaging but diverge sharply in scope—Amcor embraces a broad material portfolio, while Ball focuses on aluminum and aerospace. Their primary market battle unfolds in beverage packaging innovation and sustainability. This dual focus positions Amcor as a materials innovator and Ball as a hybrid industrial-aerospace play, reflecting distinct risk and growth profiles.
Income Statement Comparison
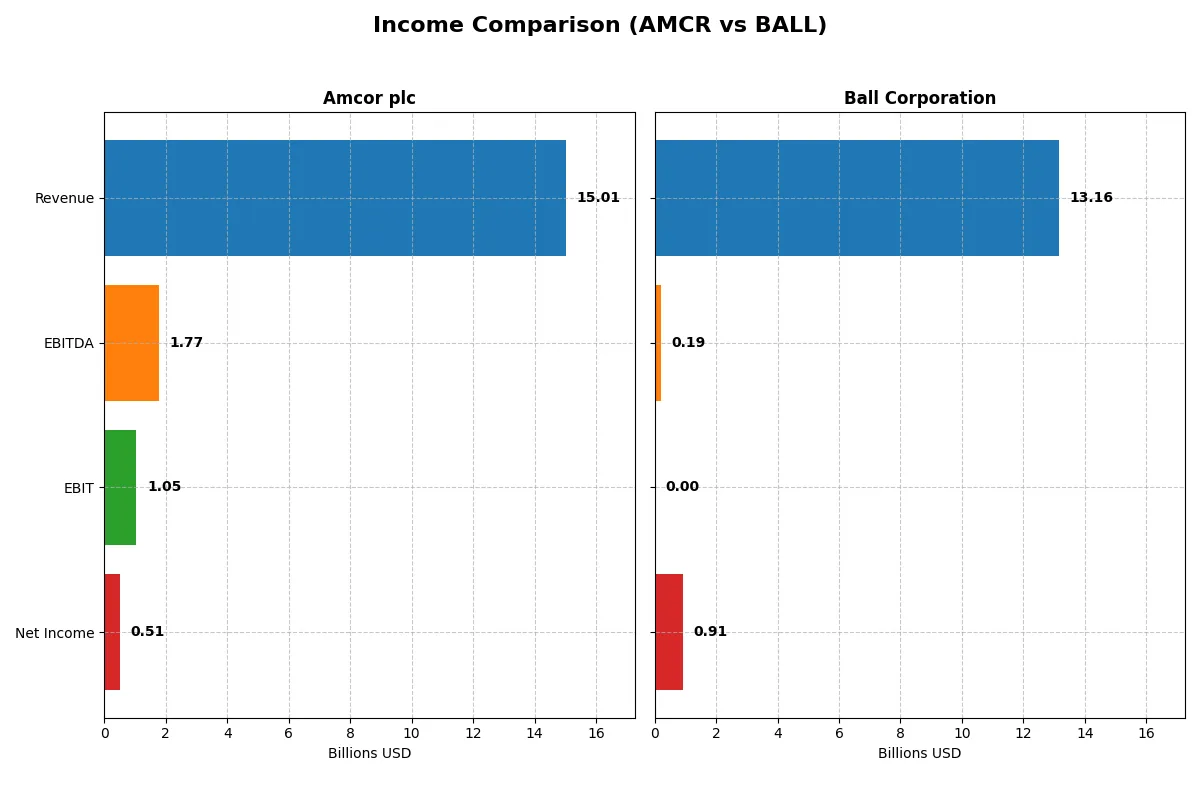
The following data dissects the core profitability and scalability of both corporate engines to reveal who dominates the bottom line:
| Metric | Amcor plc (AMCR) | Ball Corporation (BALL) |
|---|---|---|
| Revenue | 15B | 13.2B |
| Cost of Revenue | 12.2B | 0 |
| Operating Expenses | 1.83B | 566M |
| Gross Profit | 2.83B | 0 |
| EBITDA | 1.77B | 192M |
| EBIT | 1.05B | 0 |
| Interest Expense | 396M | -314M |
| Net Income | 511M | 912M |
| EPS | 1.6 | 3.3 |
| Fiscal Year | 2025 | 2025 |
Income Statement Analysis: The Bottom-Line Duel
The income statement comparison reveals the core operational efficiency and profitability trends of each company’s business model.
Amcor plc Analysis
Amcor’s revenue grew 16.7% from 2021 to 2025, reaching $15B in 2025, but net income dropped 45.6% to $510M. Gross margin held steady near 19%, while net margin declined to 3.4%, signaling margin pressures. The latest year shows revenue momentum but declining profitability and efficiency, with operating expenses rising faster than revenue.
Ball Corporation Analysis
Ball’s revenue declined 5.5% over five years to $13.2B in 2025, yet net income slightly increased to $912M. Gross profit data for 2025 is unavailable, complicating margin analysis, but net margin improved to 6.9%. Despite a recent 11.5% revenue rise, earnings per share fell sharply, reflecting volatility and potential one-off impacts in previous years.
Verdict: Revenue Growth vs. Margin Resilience
Amcor commands stronger revenue growth but suffers from shrinking net margins and earnings, indicating operational strain. Ball shows better net margin stability and modest net income growth despite revenue softness. For investors, Amcor’s scale and momentum contrast with Ball’s more resilient profitability profile, illustrating a trade-off between growth and margin quality.
Financial Ratios Comparison
These vital ratios act as a diagnostic tool to expose the underlying fiscal health, valuation premiums, and capital efficiency of the companies compared below:
| Ratios | Amcor plc (AMCR) | Ball Corporation (BALL) |
|---|---|---|
| ROE | 4.36% | 0% |
| ROIC | 2.64% | 0% |
| P/E | 28.58 | 15.93 |
| P/B | 1.25 | 0 |
| Current Ratio | 1.21 | 0 |
| Quick Ratio | 0.71 | 0 |
| D/E (Debt-to-Equity) | 1.28 | 0 |
| Debt-to-Assets | 40.5% | 0 |
| Interest Coverage | 2.55 | -2.91 |
| Asset Turnover | 0.40 | 0 |
| Fixed Asset Turnover | 1.61 | 0 |
| Payout ratio | 165.4% | 24.1% |
| Dividend yield | 5.79% | 1.51% |
| Fiscal Year | 2025 | 2025 |
Efficiency & Valuation Duel: The Vital Signs
Financial ratios serve as a company’s DNA, exposing hidden risks and operational strengths critical for informed investment decisions.
Amcor plc
Amcor shows weak profitability with a 4.36% ROE and a narrow 3.4% net margin, signaling operational challenges. Its P/E ratio of 28.58 suggests the stock is stretched relative to earnings. The firm offers a solid 5.79% dividend yield, balancing modest returns with shareholder distributions amid reinvestment in R&D.
Ball Corporation
Ball posts a moderate 6.93% net margin but reports no ROE or ROIC, raising profitability concerns. Its P/E at 15.93 appears reasonable, reflecting moderate valuation. Dividend yield stands at 1.51%, indicating limited income focus. Absent reinvestment data, the company’s financial health remains unclear due to incomplete liquidity and leverage metrics.
Valuation Stretch vs. Profitability Shadows
Both firms exhibit slightly unfavorable ratio profiles with 50% unfavorable metrics. Amcor’s higher dividend yield contrasts with Ball’s slimmer payout and missing profitability ratios. Risk-averse investors may prefer Amcor’s clearer shareholder returns, while those tolerating ambiguity might consider Ball’s more moderate valuation.
Which one offers the Superior Shareholder Reward?
I observe Amcor plc (AMCR) delivers a far stronger dividend yield around 5.8% in 2025, with payout ratios exceeding 100%, suggesting aggressive cash returns. Ball Corporation (BALL) offers a modest 1.5% yield and a conservative 24% payout ratio, signaling restrained dividends but solid free cash flow. Both deploy buybacks, but Amcor’s higher leverage raises sustainability concerns. Ball’s balanced payout and lower debt-to-equity ratio indicate a more prudent capital allocation. For 2026, I favor Amcor for total shareholder return due to its richer yield and buyback intensity, though investors must monitor its debt load closely.
Comparative Score Analysis: The Strategic Profile
The radar chart reveals the fundamental DNA and trade-offs of Amcor plc and Ball Corporation, highlighting their core financial strengths and weaknesses:
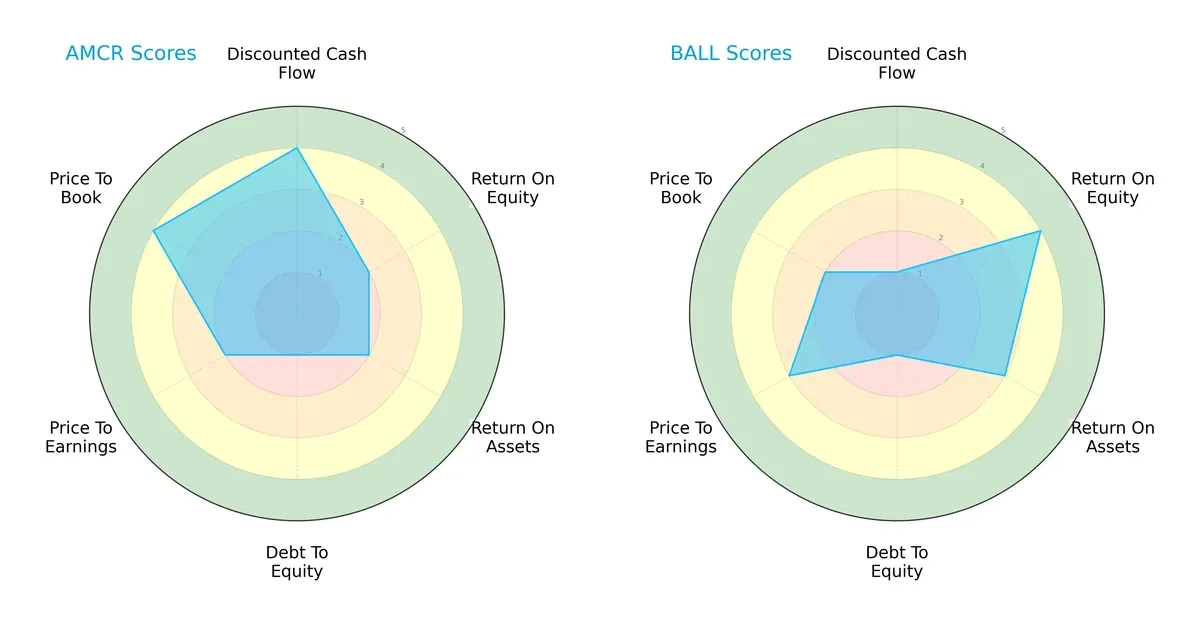
Amcor shows strength in discounted cash flow (4) and price-to-book (4), signaling undervaluation and asset efficiency. Ball excels in return on equity (4) and return on assets (3), reflecting operational efficiency. Both have weak debt-to-equity scores (1), indicating leverage concerns. Amcor’s profile is more balanced, while Ball leans on profitability metrics.
Bankruptcy Risk: Solvency Showdown
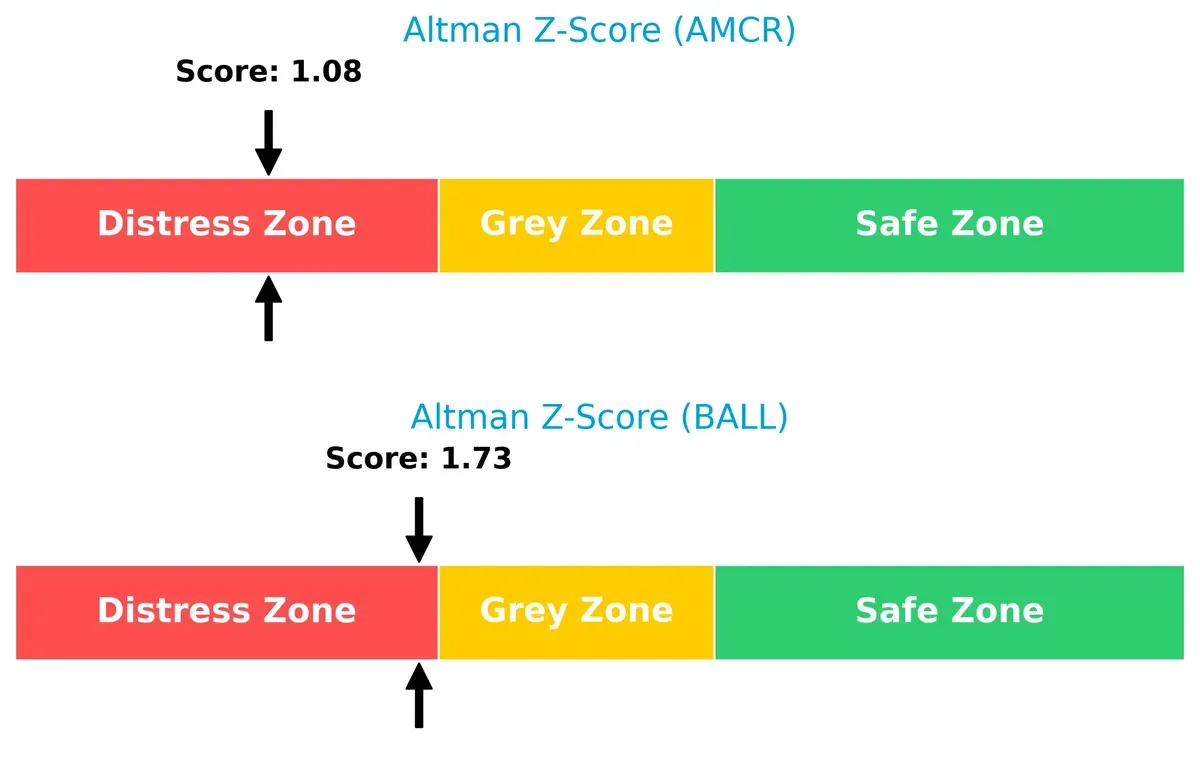
The Altman Z-Score comparison shows both firms in the distress zone, with Amcor at 1.08 and Ball at 1.73, signaling elevated bankruptcy risk in this cycle:
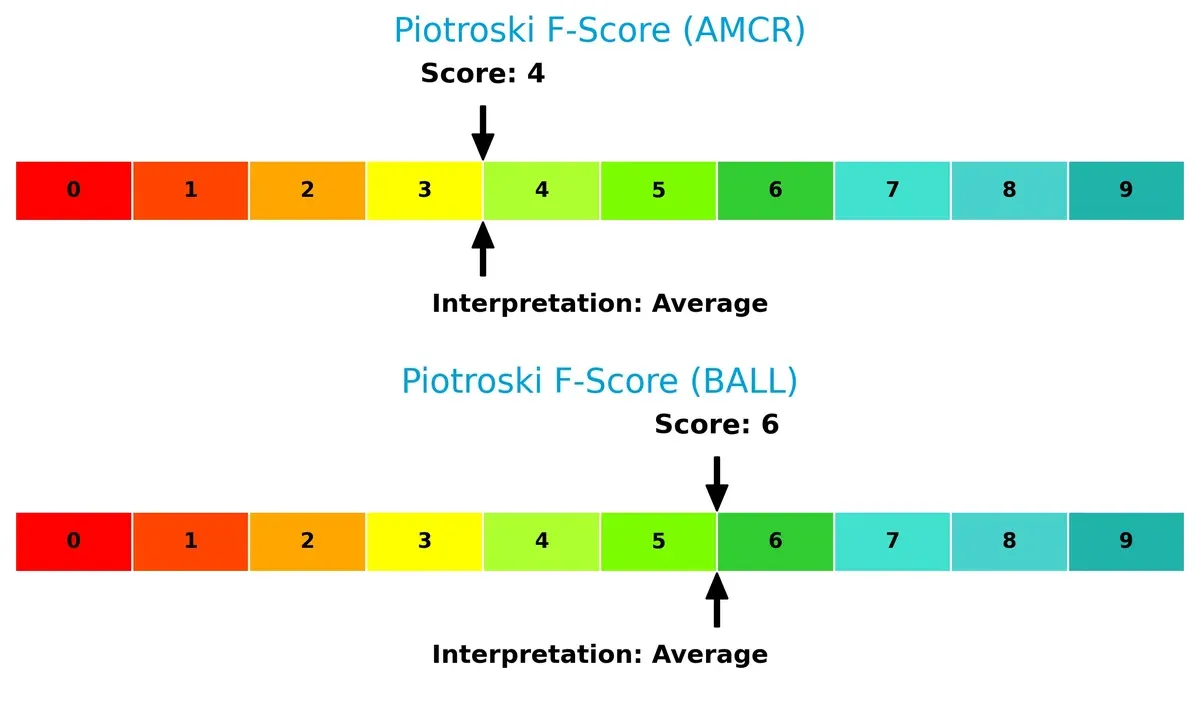
Financial Health: Quality of Operations
Ball’s Piotroski F-Score of 6 outperforms Amcor’s 4, suggesting Ball maintains stronger internal financial health and fewer red flags in operational metrics:
How are the two companies positioned?
This section dissects Amcor and Ball’s operational DNA by comparing their revenue distribution and internal strengths and weaknesses. The ultimate goal is to confront their economic moats and identify which model delivers the most resilient competitive advantage today.
Revenue Segmentation: The Strategic Mix
This visual comparison dissects how Amcor plc and Ball Corporation diversify their income streams and where their primary sector bets lie:
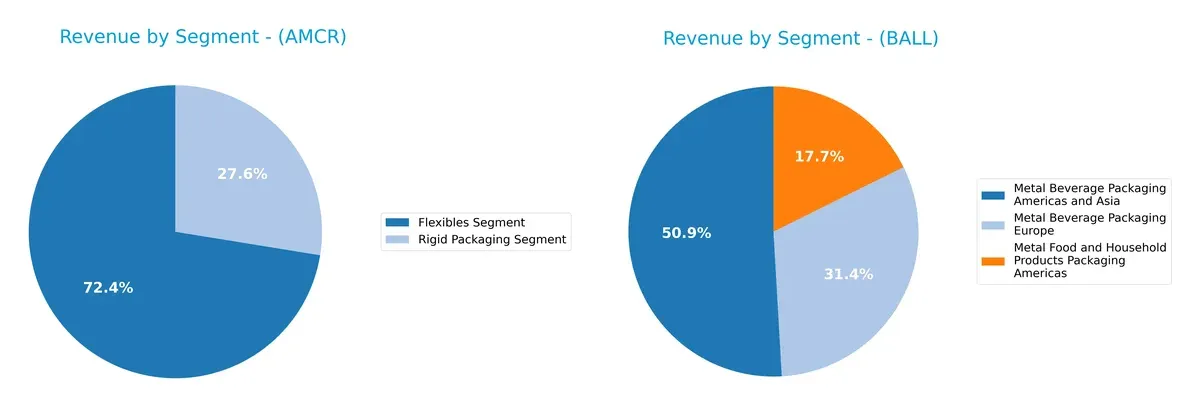
Amcor’s revenue pivots heavily on its Flexibles Segment, generating $10.9B in 2025 and anchoring its business. Its Rigid Packaging segment adds $4.1B but remains secondary. Ball Corporation shows a more diversified mix across three metal packaging segments, with $5.6B from Americas and Asia beverage packaging, $3.5B from Europe, and $1.9B from food and household packaging. Ball’s broader footprint mitigates concentration risk compared to Amcor’s reliance on a dominant segment.
Strengths and Weaknesses Comparison
This table compares the strengths and weaknesses of Amcor plc and Ball Corporation based on diversification, profitability, financials, innovation, global presence, and market share:
Amcor plc Strengths
- Diversified revenue from flexibles and rigid packaging segments
- Strong presence in North America, Europe, Asia Pacific, Latin America
- Favorable WACC supports cost of capital management
- Price-to-book ratio indicates reasonable valuation
Ball Corporation Strengths
- Diversified metal packaging across beverages and food segments
- Large US market exposure with substantial revenues
- Some favorable financial ratios including debt metrics
- Neutral P/E ratio suggests balanced market expectations
Amcor plc Weaknesses
- Unfavorable net margin, ROE, and ROIC indicate profitability challenges
- High debt-to-equity ratio signals leverage risk
- Low quick ratio highlights liquidity concerns
- Asset turnover suggests inefficient asset use
Ball Corporation Weaknesses
- Zero or unavailable profitability ratios (ROE, ROIC) reflect earnings issues
- Unfavorable liquidity ratios and negative interest coverage pose financial risks
- Low asset turnover and fixed asset turnover suggest operational inefficiencies
Both companies show slightly unfavorable overall financial metrics. Amcor demonstrates broader geographic diversification but struggles with profitability and leverage. Ball has focused metal packaging segments and favorable balance sheet metrics but faces critical profitability and liquidity weaknesses. These factors shape each company’s strategic and financial risk profile going forward.
The Moat Duel: Analyzing Competitive Defensibility
A structural moat alone shields long-term profits from relentless competitive erosion. Let’s dissect the core competitive advantages of Amcor and Ball Corporation:
Amcor plc: Cost Advantage in Global Packaging
Amcor leverages scale and diversified geographic reach to maintain cost leadership in flexible and rigid packaging. However, declining ROIC signals weakening efficiency. Expansion in Asia Pacific could deepen this moat if operational execution improves by 2026.
Ball Corporation: Aerospace-Backed Aluminum Packaging
Ball combines aluminum packaging with aerospace technology, creating a unique asset moat. Unlike Amcor’s cost focus, Ball’s innovation drives premium pricing and margin resilience. Yet, recent earnings volatility threatens this edge. Growth in aerospace tech integration offers upside potential.
Verdict: Cost Leadership vs. Innovation Synergy
Amcor’s extensive cost advantage is under pressure from declining capital returns. Ball’s innovation moat is niche but promising, albeit with short-term earnings risks. I see Ball better positioned to defend market share through technology-driven differentiation.
Which stock offers better returns?
Both Amcor plc and Ball Corporation experienced notable price shifts over the past year, with distinct trading dynamics shaping their overall performance.
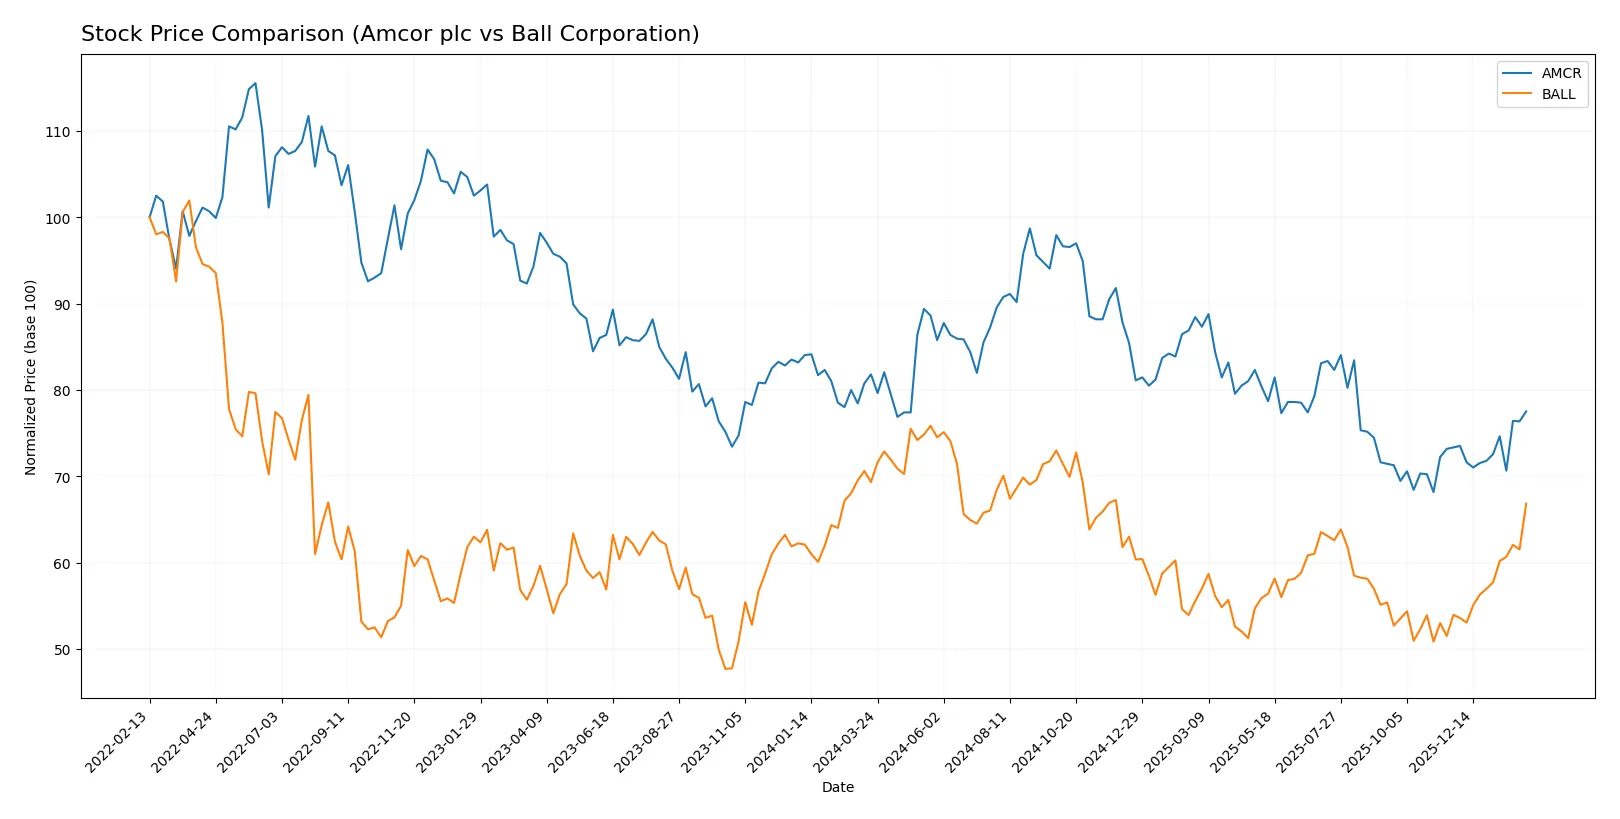
Trend Comparison
Amcor plc shows a bearish trend over the past 12 months, with a -5.23% price change and accelerating decline, hitting lows near 39.5 and highs of 57.2. Recent months show a mild recovery of +5.69%.
Ball Corporation also faces a bearish trend, down -3.6% over the year, with accelerating losses and a wider price range between 47.0 and 70.11. Recently, it posted a strong rebound of +23.86%, indicating sharp upward momentum.
Comparing the two, Ball Corporation outperformed Amcor with a smaller annual decline and a stronger recent rally, delivering the highest market performance over the analyzed period.
Target Prices
Analysts present mixed but informative target price ranges for Amcor plc and Ball Corporation, revealing diverse growth expectations.
| Company | Target Low | Target High | Consensus |
|---|---|---|---|
| Amcor plc | 9 | 46 | 17.28 |
| Ball Corporation | 55 | 69 | 62.5 |
Amcor’s consensus target of 17.28 sits well below its current price of 44.92, indicating market skepticism or valuation concerns. In contrast, Ball’s consensus target of 62.5 aligns closely with its current price of 61.77, reflecting more confidence among analysts.

Don’t Let Luck Decide Your Entry Point
Optimize your entry points with our advanced ProRealTime indicators. You’ll get efficient buy signals with precise price targets for maximum performance. Start outperforming now!
How do institutions grade them?
Amcor plc Grades
The table below summarizes recent analyst grades for Amcor plc from leading firms.
| Grading Company | Action | New Grade | Date |
|---|---|---|---|
| Wells Fargo | Maintain | Overweight | 2026-01-20 |
| Baird | Upgrade | Outperform | 2026-01-07 |
| Truist Securities | Maintain | Buy | 2026-01-06 |
Ball Corporation Grades
Recent analyst grades for Ball Corporation are shown in the table below.
| Grading Company | Action | New Grade | Date |
|---|---|---|---|
| UBS | Maintain | Neutral | 2026-01-12 |
| Citigroup | Upgrade | Buy | 2026-01-06 |
| Truist Securities | Maintain | Buy | 2026-01-06 |
| Wells Fargo | Upgrade | Overweight | 2026-01-06 |
Which company has the best grades?
Amcor plc consistently earns higher grades, including multiple “Outperform” and “Overweight” ratings. Ball Corporation’s grades are mixed, with several “Neutral” ratings. Higher grades may indicate stronger analyst confidence, potentially influencing investor sentiment.
Risks specific to each company
The following categories highlight the critical pressure points and systemic threats facing Amcor plc and Ball Corporation in the 2026 market environment:
1. Market & Competition
Amcor plc
- Faces fierce global packaging competition with margin pressure and modest net margin of 3.4%.
Ball Corporation
- Competes in aluminum packaging and aerospace, showing stronger net margin at 6.93% but higher beta risk.
2. Capital Structure & Debt
Amcor plc
- Debt-to-equity ratio of 1.28 signals leverage risk; interest coverage moderate at 2.64 times.
Ball Corporation
- Lacks disclosed debt data; interest coverage negative, implying financial distress or reporting gaps.
3. Stock Volatility
Amcor plc
- Beta of 0.668 indicates lower stock volatility than market average.
Ball Corporation
- Beta of 1.138 suggests higher volatility, increasing risk for investors.
4. Regulatory & Legal
Amcor plc
- Global packaging exposure entails regulatory scrutiny on environmental and safety standards.
Ball Corporation
- Aerospace segment exposes firm to strict defense and export controls, increasing compliance costs.
5. Supply Chain & Operations
Amcor plc
- Complex global supply chains in flexible and rigid packaging require robust risk management.
Ball Corporation
- Diverse operations across continents and aerospace hardware add operational complexity and supply risks.
6. ESG & Climate Transition
Amcor plc
- ESG pressures mounting in packaging industry to reduce plastic waste and carbon footprint.
Ball Corporation
- Faces significant climate transition risks in aluminum production and aerospace emissions.
7. Geopolitical Exposure
Amcor plc
- Operations span Europe, Americas, Asia, and Africa, exposing it to multiple geopolitical tensions.
Ball Corporation
- US-based with international aerospace contracts, sensitive to US-China and defense-related geopolitical risks.
Which company shows a better risk-adjusted profile?
Amcor’s manageable leverage and lower stock volatility provide a steadier risk profile despite margin pressures. Ball’s zero or missing debt disclosures and negative interest coverage raise red flags. Its higher beta and aerospace regulatory risks amplify uncertainty. Amcor’s Altman Z-score at 1.08 and Ball’s 1.73 both signal distress, but Amcor’s slightly stronger liquidity ratios and stable dividend yield suggest a marginally better risk-adjusted position in 2026. Ball’s negative interest coverage and operational opacity are concerning, demanding cautious scrutiny.
Final Verdict: Which stock to choose?
Amcor’s superpower lies in its resilient cash flow generation and attractive dividend yield, making it a dependable income source. However, its declining profitability signals a point of vigilance. It suits portfolios focused on steady income with moderate risk tolerance.
Ball Corporation boasts a strategic moat through its industry position and operational scale, offering a relatively safer profile amid market volatility. Its recent acceleration in stock price highlights potential for growth, fitting Growth-at-a-Reasonable-Price (GARP) investors who value a blend of stability and upside.
If you prioritize reliable income and conservative growth, Amcor is the compelling choice due to its strong cash conversion and dividend yield. However, if you seek growth with operational scale and better recent momentum, Ball offers superior upside potential despite some financial uncertainties.
Disclaimer: Investment carries a risk of loss of initial capital. The past performance is not a reliable indicator of future results. Be sure to understand risks before making an investment decision.
Go Further
I encourage you to read the complete analyses of Amcor plc and Ball Corporation to enhance your investment decisions: