In the fast-evolving semiconductor industry, Tower Semiconductor Ltd. (TSEM) and Ambarella, Inc. (AMBA) stand out for their innovative approaches and distinct market niches. Tower Semiconductor excels in analog and mixed-signal foundry services, while Ambarella leads in advanced video processing chips with AI capabilities. Their overlapping yet specialized technologies make this comparison crucial for investors seeking growth and stability. Join me as we analyze which company offers the most compelling investment opportunity today.
Table of contents
Companies Overview
I will begin the comparison between Tower Semiconductor Ltd. and Ambarella, Inc. by providing an overview of these two companies and their main differences.
Tower Semiconductor Ltd. Overview
Tower Semiconductor Ltd. is an independent semiconductor foundry specializing in analog intensive mixed-signal semiconductor devices. With a market cap of 13.9B USD and over 5,600 employees, it offers customizable process technologies including SiGe, BiCMOS, and MEMS. The company serves diverse markets such as consumer electronics, automotive, aerospace, and medical devices from its headquarters in Israel.
Ambarella, Inc. Overview
Ambarella, Inc. develops semiconductor solutions focused on video processing, incorporating HD and ultra HD compression, AI vision algorithms, and low power consumption. Based in Santa Clara, California, it has a market cap of 2.7B USD and employs around 940 people. Its chips are used in automotive cameras, security devices, robotics, drones, and virtual reality applications worldwide.
Key similarities and differences
Both companies operate in the semiconductor industry and serve technology markets requiring advanced chip solutions. Tower Semiconductor emphasizes customizable fabrication processes for a wide range of analog and mixed-signal devices, while Ambarella specializes in video-centric system-on-a-chip designs integrating AI and imaging functions. Tower has a significantly larger market cap and workforce, reflecting its broader manufacturing scope compared to Ambarella’s focused product portfolio.
Income Statement Comparison
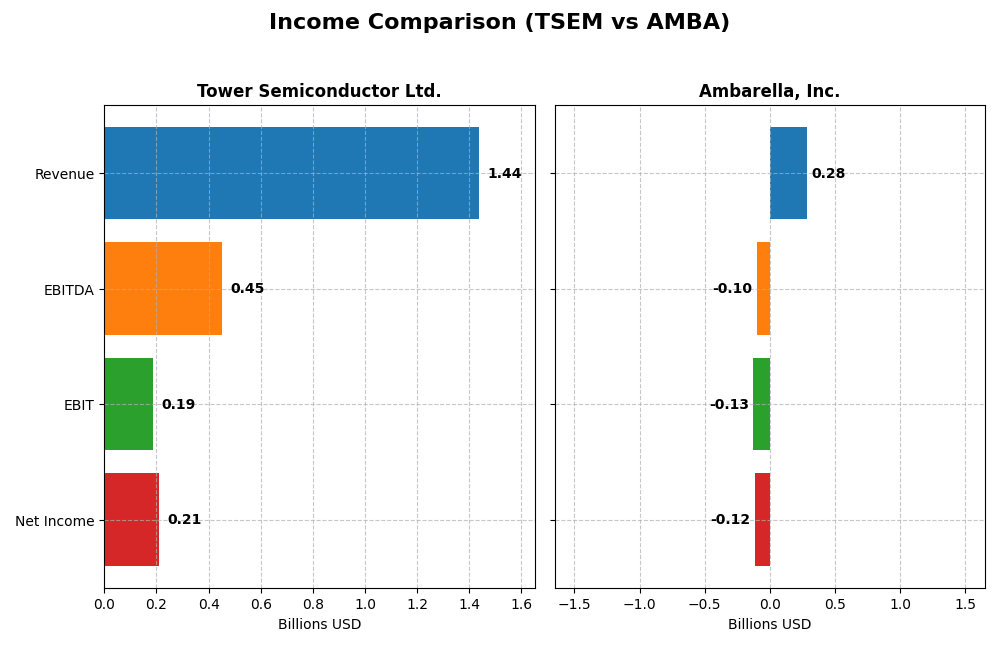
The table below presents a side-by-side comparison of key income statement metrics for Tower Semiconductor Ltd. and Ambarella, Inc. for their most recent fiscal years.
| Metric | Tower Semiconductor Ltd. (2024) | Ambarella, Inc. (2025) |
|---|---|---|
| Market Cap | 13.9B | 2.7B |
| Revenue | 1.44B | 285M |
| EBITDA | 451M | -101M |
| EBIT | 185M | -127M |
| Net Income | 208M | -117M |
| EPS | 1.87 | -2.84 |
| Fiscal Year | 2024 | 2025 |
Income Statement Interpretations
Tower Semiconductor Ltd.
Tower Semiconductor’s revenue showed modest growth of 0.94% from 2023 to 2024, with a 13.47% rise over the five-year span. Net income also increased substantially overall, growing 153% across the period despite a 60% drop in the most recent year. Margins remain favorable, with a 23.64% gross margin and a 14.47% net margin in 2024. However, earnings and net margin contracted sharply last year.
Ambarella, Inc.
Ambarella experienced a 25.78% revenue increase in 2025, continuing a positive trend over the period. Gross margin is robust at 60.5%, but the company faces unfavorable net and EBIT margins of -41.12% and -44.44%, respectively. While recent margin and EPS growth were positive, net income declined nearly 96% overall, reflecting ongoing profitability challenges despite revenue gains.
Which one has the stronger fundamentals?
Tower Semiconductor shows stronger fundamentals with consistent profitability and favorable margins, despite a recent earnings setback. Ambarella’s high gross margin contrasts with persistent net losses and negative EBIT margins, signaling operational challenges. Overall, Tower’s positive net income growth and stable margins suggest a more resilient income statement profile.
Financial Ratios Comparison
The table below presents a side-by-side comparison of key financial ratios for Tower Semiconductor Ltd. (TSEM) and Ambarella, Inc. (AMBA) based on their most recent full fiscal year data.
| Ratios | Tower Semiconductor Ltd. (2024) | Ambarella, Inc. (2025) |
|---|---|---|
| ROE | 7.83% | -20.86% |
| ROIC | 6.41% | -21.96% |
| P/E | 27.54 | -27.05 |
| P/B | 2.16 | 5.64 |
| Current Ratio | 6.18 | 2.65 |
| Quick Ratio | 5.23 | 2.36 |
| D/E | 0.068 | 0.009 |
| Debt-to-Assets | 5.87% | 0.76% |
| Interest Coverage | 32.64 | 0 |
| Asset Turnover | 0.47 | 0.41 |
| Fixed Asset Turnover | 1.11 | 19.96 |
| Payout Ratio | 0 | 0 |
| Dividend Yield | 0% | 0% |
Interpretation of the Ratios
Tower Semiconductor Ltd.
Tower Semiconductor presents a mixed ratio profile with favorable net margin at 14.47% and strong interest coverage of 31.57, indicating good earnings and debt service capacity. However, return on equity at 7.83% and asset turnover at 0.47 are unfavorable, suggesting efficiency concerns. The company does not pay dividends, reflecting a possible reinvestment strategy or growth focus.
Ambarella, Inc.
Ambarella’s ratios show significant challenges, with negative net margin (-41.12%) and return on equity (-20.86%), indicating operational losses and poor profitability. The firm maintains favorable liquidity ratios and low debt levels but has zero interest coverage, signaling risk in debt servicing. Ambarella also does not pay dividends, likely due to ongoing losses and investment in R&D.
Which one has the best ratios?
Based on the evaluations, Tower Semiconductor’s ratios are slightly favorable with balanced strengths in profitability and solvency, whereas Ambarella’s ratios are overall unfavorable due to negative returns and earnings. Consequently, Tower Semiconductor demonstrates a comparatively stronger financial position in this ratio analysis.
Strategic Positioning
This section compares the strategic positioning of Tower Semiconductor Ltd. and Ambarella, Inc., focusing on Market position, Key segments, and Exposure to technological disruption:
Tower Semiconductor Ltd.
- Independent foundry in semiconductors with global presence and moderate competitive pressure.
- Serves diverse markets including consumer electronics, automotive, industrial, aerospace, and medical devices.
- Provides various customizable analog and mixed-signal process technologies, enabling adaptability to evolving tech.
Ambarella, Inc.
- Developer of semiconductor solutions for video with niche focus on HD and AI-enabled video processing.
- Key segments include automotive cameras, security cameras, robotics, and consumer video applications.
- Focuses on integrated system-on-chip designs with AI and video compression, exposed to AI technology disruption.
Tower Semiconductor Ltd. vs Ambarella, Inc. Positioning
Tower Semiconductor has a diversified market approach, serving multiple sectors with broad semiconductor foundry services. Ambarella concentrates on video and AI semiconductor solutions, providing specialized products but with narrower market exposure.
Which has the best competitive advantage?
Based on MOAT evaluation, Tower Semiconductor shows slightly unfavorable positioning with growing profitability, while Ambarella faces a very unfavorable position with declining returns, indicating Tower Semiconductor currently holds a stronger competitive advantage.
Stock Comparison
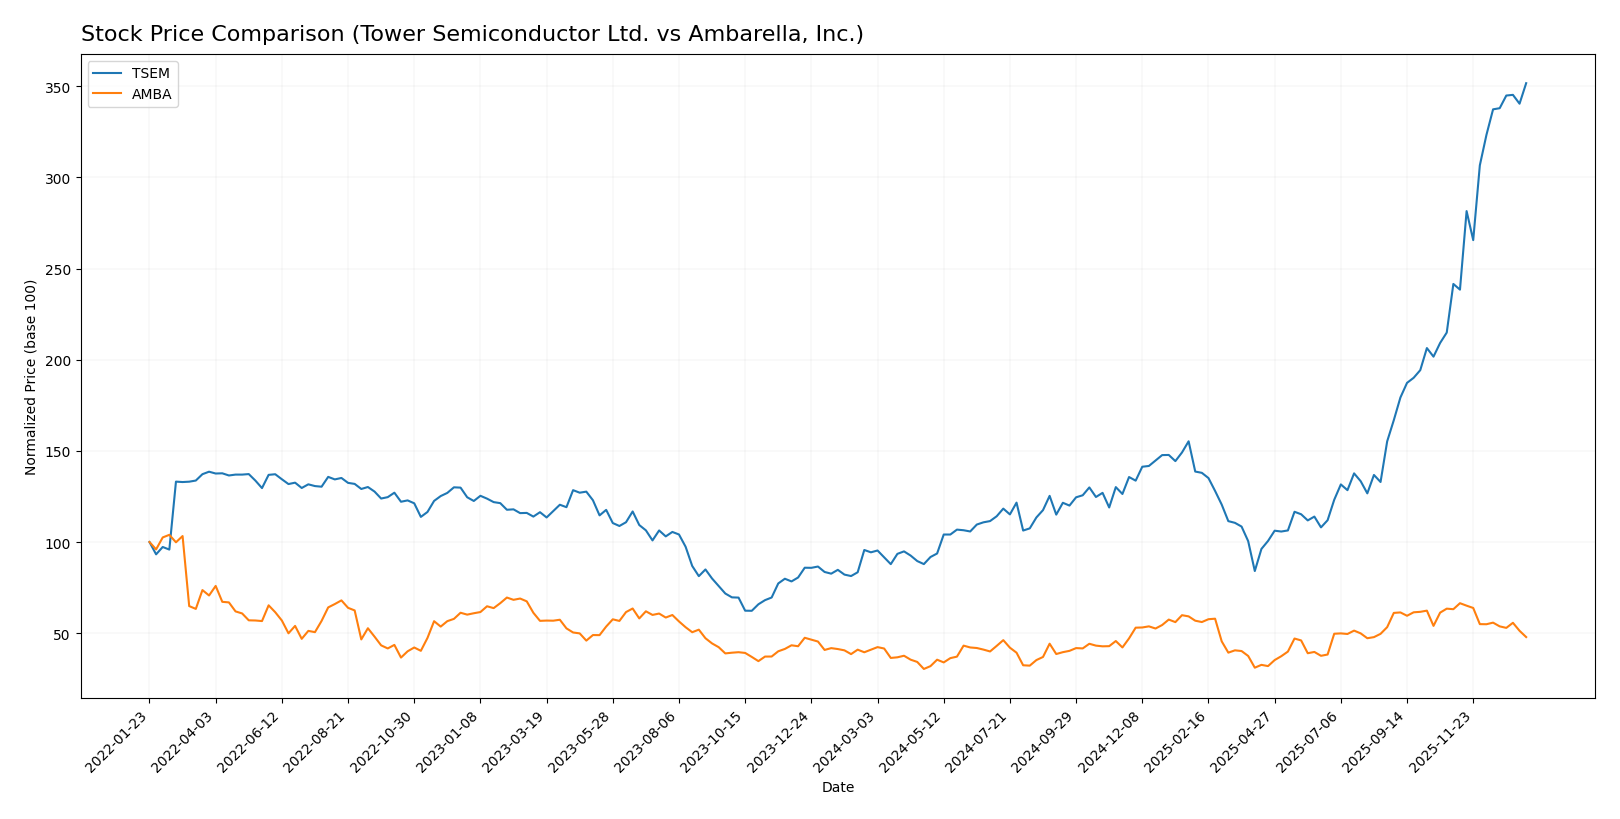
The stock price movements of Tower Semiconductor Ltd. and Ambarella, Inc. over the past year reveal contrasting market dynamics, with Tower Semiconductor showing strong bullish momentum and Ambarella experiencing recent bearish pressures.
Trend Analysis
Tower Semiconductor Ltd. exhibited a strong bullish trend over the past 12 months with a 272.71% price increase, marked by acceleration and a high volatility level (std deviation 23.67). The stock hit a low of 29.65 and a high of 124.0.
Ambarella, Inc. showed a bullish trend overall with a 16.9% price increase, but with deceleration and moderate volatility (std deviation 12.81). The stock fluctuated between 40.99 and 89.67, though recent trends indicate a 24.21% decline.
Comparing both, Tower Semiconductor delivered the highest market performance with a significantly stronger price increase and acceleration, while Ambarella faced recent bearish momentum despite its overall positive yearly trend.
Target Prices
The current analyst consensus target prices suggest moderate upside potential for both Tower Semiconductor Ltd. and Ambarella, Inc.
| Company | Target High | Target Low | Consensus |
|---|---|---|---|
| Tower Semiconductor Ltd. | 125 | 66 | 96 |
| Ambarella, Inc. | 115 | 80 | 97.5 |
Analysts expect Tower Semiconductor’s price to hold near its current level of 124 USD, while Ambarella’s consensus target of 97.5 USD indicates potential upside from its 64.6 USD stock price.
Analyst Opinions Comparison
This section compares analysts’ ratings and grades for Tower Semiconductor Ltd. and Ambarella, Inc.:
Rating Comparison
TSEM Rating
- Rating: B+ indicating a very favorable overall evaluation.
- Discounted Cash Flow Score: Moderate score of 3 reflecting average valuation based on cash flow.
- ROE Score: Moderate score of 3 showing decent profit generation from equity.
- ROA Score: Favorable score of 4, highlighting effective asset utilization.
- Debt To Equity Score: Favorable score of 4 implies a strong balance sheet with low financial risk.
- Overall Score: Moderate score of 3 reflecting a balanced financial standing.
AMBA Rating
- Rating: C+ also marked as very favorable overall.
- Discounted Cash Flow Score: Moderate score of 3, similar assessment on cash flow valuation.
- ROE Score: Very unfavorable score of 1, indicating weak profit efficiency from shareholders’ equity.
- ROA Score: Very unfavorable score of 1, suggesting poor asset earnings efficiency.
- Debt To Equity Score: Favorable score of 4, also indicating a solid financial position.
- Overall Score: Moderate score of 2, slightly lower financial standing compared to TSEM.
Which one is the best rated?
Based strictly on the provided data, Tower Semiconductor Ltd. (TSEM) is better rated overall, with higher ROE and ROA scores and a better overall score compared to Ambarella, Inc. (AMBA), which shows weaker profitability metrics.
Scores Comparison
Here is a comparison of the financial health scores for Tower Semiconductor Ltd. and Ambarella, Inc.:
TSEM Scores
- Altman Z-Score: 21.06, indicating a safe zone with very low bankruptcy risk.
- Piotroski Score: 7, showing strong financial health and investment potential.
AMBA Scores
- Altman Z-Score: 10.69, indicating a safe zone with low bankruptcy risk.
- Piotroski Score: 3, indicating very weak financial health and poor investment potential.
Which company has the best scores?
Tower Semiconductor Ltd. has the best overall financial scores with a higher Altman Z-Score and a strong Piotroski Score, while Ambarella, Inc. has a lower Piotroski score indicating weaker financial strength despite a safe Altman Z-Score.
Grades Comparison
Here is a detailed comparison of the recent grades assigned to Tower Semiconductor Ltd. and Ambarella, Inc.:
Tower Semiconductor Ltd. Grades
The following table summarizes the recent grades from reputable grading companies for Tower Semiconductor Ltd.:
| Grading Company | Action | New Grade | Date |
|---|---|---|---|
| Benchmark | Maintain | Buy | 2026-01-09 |
| Wedbush | Downgrade | Neutral | 2025-12-31 |
| Benchmark | Maintain | Buy | 2025-11-11 |
| Susquehanna | Maintain | Positive | 2025-11-11 |
| Wedbush | Maintain | Outperform | 2025-11-11 |
| Barclays | Maintain | Equal Weight | 2025-11-11 |
| Benchmark | Maintain | Buy | 2025-09-08 |
| Susquehanna | Maintain | Positive | 2025-08-05 |
| Benchmark | Maintain | Buy | 2025-08-05 |
| Benchmark | Maintain | Buy | 2025-08-04 |
Tower Semiconductor’s grades mostly indicate a Buy or Positive stance, with one recent downgrade from Wedbush to Neutral and several Maintains on Buy ratings, showing some mixed but overall positive sentiment.
Ambarella, Inc. Grades
The following table summarizes the recent grades from reputable grading companies for Ambarella, Inc.:
| Grading Company | Action | New Grade | Date |
|---|---|---|---|
| B of A Securities | Maintain | Neutral | 2025-11-26 |
| Needham | Maintain | Buy | 2025-11-26 |
| Stifel | Maintain | Buy | 2025-11-26 |
| Rosenblatt | Maintain | Buy | 2025-11-26 |
| Rosenblatt | Maintain | Buy | 2025-11-24 |
| Stifel | Maintain | Buy | 2025-08-29 |
| Needham | Maintain | Buy | 2025-08-29 |
| Northland Capital Markets | Maintain | Outperform | 2025-08-29 |
| Morgan Stanley | Maintain | Overweight | 2025-08-29 |
| Oppenheimer | Maintain | Perform | 2025-08-29 |
Ambarella’s grades show a strong tendency towards Buy and Outperform ratings, with no downgrades or negative actions reported recently, indicating a consistent positive outlook.
Which company has the best grades?
Ambarella, Inc. has received more consistently positive grades, including multiple Buy and Outperform ratings without downgrades, compared to Tower Semiconductor Ltd., which shows some mixed signals and a recent Neutral downgrade. This pattern may influence investor confidence differently, reflecting varying market perceptions of growth and risk.
Strengths and Weaknesses
Here is a comparative overview of Tower Semiconductor Ltd. (TSEM) and Ambarella, Inc. (AMBA) based on key investment criteria:
| Criterion | Tower Semiconductor Ltd. (TSEM) | Ambarella, Inc. (AMBA) |
|---|---|---|
| Diversification | Moderate, focused on semiconductor manufacturing | Moderate, specialized in video processing chips |
| Profitability | Positive net margin (14.47%), ROIC slightly below WACC but improving | Negative net margin (-41.12%), declining ROIC well below WACC |
| Innovation | Steady innovation supporting growing ROIC | Innovation challenged by declining profitability and ROIC |
| Global presence | Established semiconductor industry footprint | Niche market focus with limited global scale |
| Market Share | Stable within foundry segment, moderate asset turnover (0.47) | Smaller market share with asset turnover 0.41 but higher fixed asset efficiency |
Key takeaways: Tower Semiconductor shows improving profitability and a slightly favorable financial profile despite currently shedding value. Ambarella faces significant profitability challenges with a very unfavorable moat status and declining returns, signaling higher investment risk.
Risk Analysis
Below is a comparison of key risks for Tower Semiconductor Ltd. (TSEM) and Ambarella, Inc. (AMBA) based on the most recent data available for 2025-2026:
| Metric | Tower Semiconductor Ltd. (TSEM) | Ambarella, Inc. (AMBA) |
|---|---|---|
| Market Risk | Moderate (Beta 0.876; stable semiconductor demand) | High (Beta 1.953; volatile due to niche markets) |
| Debt Level | Very Low (D/E 0.07; strong balance sheet) | Very Low (D/E 0.01; minimal leverage) |
| Regulatory Risk | Moderate (Global operations, especially in Asia and Europe) | Moderate to High (US-based, AI and automotive sectors) |
| Operational Risk | Moderate (Complex manufacturing processes) | Moderate (R&D intensive with rapid tech changes) |
| Environmental Risk | Moderate (Manufacturing waste management) | Moderate (Semiconductor production and energy use) |
| Geopolitical Risk | Moderate (Israeli base, exposure to global trade tensions) | Low to Moderate (US base, some exposure to global supply chains) |
The most impactful risks are market volatility for Ambarella due to its higher beta and challenging profitability, and regulatory plus geopolitical exposure for Tower Semiconductor given its international manufacturing footprint. Tower’s strong balance sheet mitigates financial risks, whereas Ambarella’s weak profitability and low Piotroski score suggest higher operational and financial vulnerability.
Which Stock to Choose?
Tower Semiconductor Ltd. (TSEM) shows a favorable income statement with improving profitability despite recent growth challenges, a slightly favorable financial ratio profile, low debt levels, and a very favorable B+ rating indicating moderate overall financial strength.
Ambarella, Inc. (AMBA) has a favorable income growth trend but suffers from negative profitability metrics, unfavorable financial ratios overall, minimal debt, and a very favorable C+ rating that contrasts with its very weak Piotroski score and deteriorating returns on invested capital.
For investors prioritizing stability and moderate financial strength, TSEM might appear more favorable given its positive income evaluation and balanced financial ratios, while those focusing on growth potential amid volatility could interpret AMBA’s mixed signals with caution due to its declining profitability and value destruction.
Disclaimer: Investment carries a risk of loss of initial capital. The past performance is not a reliable indicator of future results. Be sure to understand risks before making an investment decision.
Go Further
I encourage you to read the complete analyses of Tower Semiconductor Ltd. and Ambarella, Inc. to enhance your investment decisions: